Ta-lib函数功能列表
import tkinter as tk
from tkinter import ttk
import matplotlib.pyplot as plt
import numpy as np
import talib as ta
series = np.random.choice([1, -1], size=200)
close = np.cumsum(series).astype(float)
# 重叠指标
def overlap_process(event):
print(event.widget.get())
overlap = event.widget.get()
upperband, middleband, lowerband = ta.BBANDS(close, timeperiod=5, nbdevup=2, nbdevdn=2, matype=0)
fig, axes = plt.subplots(2, 1, sharex=True)
ax1, ax2 = axes[0], axes[1]
axes[0].plot(close, 'rd-', markersize=3)
axes[0].plot(upperband, 'y-')
axes[0].plot(middleband, 'b-')
axes[0].plot(lowerband, 'y-')
axes[0].set_title(overlap, fontproperties="SimHei")
if overlap == '布林线':
pass
elif overlap == '双指数移动平均线':
real = ta.DEMA(close, timeperiod=30)
axes[1].plot(real, 'r-')
elif overlap == '指数移动平均线 ':
real = ta.EMA(close, timeperiod=30)
axes[1].plot(real, 'r-')
elif overlap == '希尔伯特变换——瞬时趋势线':
real = ta.HT_TRENDLINE(close)
axes[1].plot(real, 'r-')
elif overlap == '考夫曼自适应移动平均线':
real = ta.KAMA(close, timeperiod=30)
axes[1].plot(real, 'r-')
elif overlap == '移动平均线':
real = ta.MA(close, timeperiod=30, matype=0)
axes[1].plot(real, 'r-')
elif overlap == 'MESA自适应移动平均':
mama, fama = ta.MAMA(close, fastlimit=0, slowlimit=0)
axes[1].plot(mama, 'r-')
axes[1].plot(fama, 'g-')
elif overlap == '变周期移动平均线':
real = ta.MAVP(close, periods, minperiod=2, maxperiod=30, matype=0)
axes[1].plot(real, 'r-')
elif overlap == '简单移动平均线':
real = ta.SMA(close, timeperiod=30)
axes[1].plot(real, 'r-')
elif overlap == '三指数移动平均线(T3)':
real = ta.T3(close, timeperiod=5, vfactor=0)
axes[1].plot(real, 'r-')
elif overlap == '三指数移动平均线':
real = ta.TEMA(close, timeperiod=30)
axes[1].plot(real, 'r-')
elif overlap == '三角形加权法 ':
real = ta.TRIMA(close, timeperiod=30)
axes[1].plot(real, 'r-')
elif overlap == '加权移动平均数':
real = ta.WMA(close, timeperiod=30)
axes[1].plot(real, 'r-')
plt.show()
# 动量指标
def momentum_process(event):
print(event.widget.get())
momentum = event.widget.get()
upperband, middleband, lowerband = ta.BBANDS(close, timeperiod=5, nbdevup=2, nbdevdn=2, matype=0)
fig, axes = plt.subplots(2, 1, sharex=True)
ax1, ax2 = axes[0], axes[1]
axes[0].plot(close, 'rd-', markersize=3)
axes[0].plot(upperband, 'y-')
axes[0].plot(middleband, 'b-')
axes[0].plot(lowerband, 'y-')
axes[0].set_title(momentum, fontproperties="SimHei")
if momentum == '绝对价格振荡器':
real = ta.APO(close, fastperiod=12, slowperiod=26, matype=0)
axes[1].plot(real, 'r-')
elif momentum == '钱德动量摆动指标':
real = ta.CMO(close, timeperiod=14)
axes[1].plot(real, 'r-')
elif momentum == '移动平均收敛/散度':
macd, macdsignal, macdhist = ta.MACD(close, fastperiod=12, slowperiod=26, signalperiod=9)
axes[1].plot(macd, 'r-')
axes[1].plot(macdsignal, 'g-')
axes[1].plot(macdhist, 'b-')
elif momentum == '带可控MA类型的MACD':
macd, macdsignal, macdhist = ta.MACDEXT(close, fastperiod=12, fastmatype=0, slowperiod=26, slowmatype=0, signalperiod=9, signalmatype=0)
axes[1].plot(macd, 'r-')
axes[1].plot(macdsignal, 'g-')
axes[1].plot(macdhist, 'b-')
elif momentum == '移动平均收敛/散度 固定 12/26':
macd, macdsignal, macdhist = ta.MACDFIX(close, signalperiod=9)
axes[1].plot(macd, 'r-')
axes[1].plot(macdsignal, 'g-')
axes[1].plot(macdhist, 'b-')
elif momentum == '动量':
real = ta.MOM(close, timeperiod=10)
axes[1].plot(real, 'r-')
elif momentum == '比例价格振荡器':
real = ta.PPO(close, fastperiod=12, slowperiod=26, matype=0)
axes[1].plot(real, 'r-')
elif momentum == '变化率':
real = ta.ROC(close, timeperiod=10)
axes[1].plot(real, 'r-')
elif momentum == '变化率百分比':
real = ta.ROCP(close, timeperiod=10)
axes[1].plot(real, 'r-')
elif momentum == '变化率的比率':
real = ta.ROCR(close, timeperiod=10)
axes[1].plot(real, 'r-')
elif momentum == '变化率的比率100倍':
real = ta.ROCR100(close, timeperiod=10)
axes[1].plot(real, 'r-')
elif momentum == '相对强弱指数':
real = ta.RSI(close, timeperiod=14)
axes[1].plot(real, 'r-')
elif momentum == '随机相对强弱指标':
fastk, fastd = ta.STOCHRSI(close, timeperiod=14, fastk_period=5, fastd_period=3, fastd_matype=0)
axes[1].plot(fastk, 'r-')
axes[1].plot(fastd, 'r-')
elif momentum == '三重光滑EMA的日变化率':
real = ta.TRIX(close, timeperiod=30)
axes[1].plot(real, 'r-')
plt.show()
# 周期指标
def cycle_process(event):
print(event.widget.get())
cycle = event.widget.get()
upperband, middleband, lowerband = ta.BBANDS(close, timeperiod=5, nbdevup=2, nbdevdn=2, matype=0)
fig, axes = plt.subplots(2, 1, sharex=True)
ax1, ax2 = axes[0], axes[1]
axes[0].plot(close, 'rd-', markersize=3)
axes[0].plot(upperband, 'y-')
axes[0].plot(middleband, 'b-')
axes[0].plot(lowerband, 'y-')
axes[0].set_title(cycle, fontproperties="SimHei")
if cycle == '希尔伯特变换——主要的循环周期':
real = ta.HT_DCPERIOD(close)
axes[1].plot(real, 'r-')
elif cycle == '希尔伯特变换,占主导地位的周期阶段':
real = ta.HT_DCPHASE(close)
axes[1].plot(real, 'r-')
elif cycle == '希尔伯特变换——相量组件':
inphase, quadrature = ta.HT_PHASOR(close)
axes[1].plot(inphase, 'r-')
axes[1].plot(quadrature, 'g-')
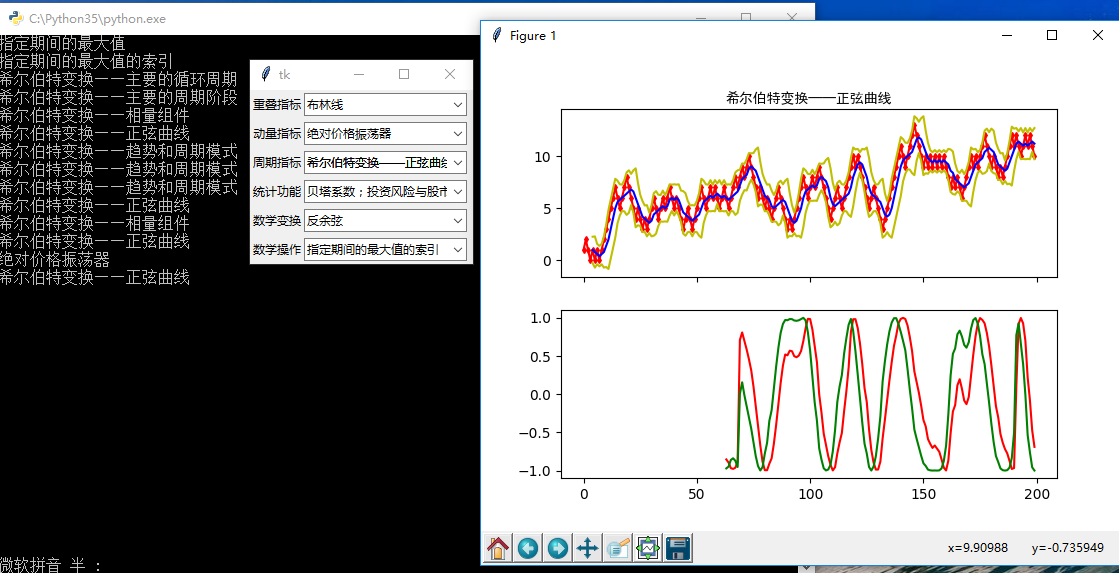
elif cycle == '希尔伯特变换——正弦曲线':
sine, leadsine = ta.HT_SINE(close)
axes[1].plot(sine, 'r-')
axes[1].plot(leadsine, 'g-')
elif cycle == '希尔伯特变换——趋势和周期模式':
integer = ta.HT_TRENDMODE(close)
axes[1].plot(integer, 'r-')
plt.show()
# 统计功能
def statistic_process(event):
print(event.widget.get())
statistic = event.widget.get()
upperband, middleband, lowerband = ta.BBANDS(close, timeperiod=5, nbdevup=2, nbdevdn=2, matype=0)
fig, axes = plt.subplots(2, 1, sharex=True)
ax1, ax2 = axes[0], axes[1]
axes[0].plot(close, 'rd-', markersize=3)
axes[0].plot(upperband, 'y-')
axes[0].plot(middleband, 'b-')
axes[0].plot(lowerband, 'y-')
axes[0].set_title(statistic, fontproperties="SimHei")
if statistic == '线性回归':
real = ta.LINEARREG(close, timeperiod=14)
axes[1].plot(real, 'r-')
elif statistic == '线性回归角度':
real = ta.LINEARREG_ANGLE(close, timeperiod=14)
axes[1].plot(real, 'r-')
elif statistic == '线性回归截距':
real = ta.LINEARREG_INTERCEPT(close, timeperiod=14)
axes[1].plot(real, 'r-')
elif statistic == '线性回归斜率':
real = ta.LINEARREG_SLOPE(close, timeperiod=14)
axes[1].plot(real, 'r-')
elif statistic == '标准差':
real = ta.STDDEV(close, timeperiod=5, nbdev=1)
axes[1].plot(real, 'r-')
elif statistic == '时间序列预测':
real = ta.TSF(close, timeperiod=14)
axes[1].plot(real, 'r-')
elif statistic == '方差':
real = ta.VAR(close, timeperiod=5, nbdev=1)
axes[1].plot(real, 'r-')
plt.show()
# 数学变换
def math_transform_process(event):
print(event.widget.get())
math_transform = event.widget.get()
upperband, middleband, lowerband = ta.BBANDS(close, timeperiod=5, nbdevup=2, nbdevdn=2, matype=0)
fig, axes = plt.subplots(2, 1, sharex=True)
ax1, ax2 = axes[0], axes[1]
axes[0].plot(close, 'rd-', markersize=3)
axes[0].plot(upperband, 'y-')
axes[0].plot(middleband, 'b-')
axes[0].plot(lowerband, 'y-')
axes[0].set_title(math_transform, fontproperties="SimHei")
if math_transform == '反余弦':
real = ta.ACOS(close)
axes[1].plot(real, 'r-')
elif math_transform == '反正弦':
real = ta.ASIN(close)
axes[1].plot(real, 'r-')
elif math_transform == '反正切':
real = ta.ATAN(close)
axes[1].plot(real, 'r-')
elif math_transform == '向上取整':
real = ta.CEIL(close)
axes[1].plot(real, 'r-')
elif math_transform == '余弦':
real = ta.COS(close)
axes[1].plot(real, 'r-')
elif math_transform == '双曲余弦':
real = ta.COSH(close)
axes[1].plot(real, 'r-')
elif math_transform == '指数':
real = ta.EXP(close)
axes[1].plot(real, 'r-')
elif math_transform == '向下取整':
real = ta.FLOOR(close)
axes[1].plot(real, 'r-')
elif math_transform == '自然对数':
real = ta.LN(close)
axes[1].plot(real, 'r-')
elif math_transform == '常用对数':
real = ta.LOG10(close)
axes[1].plot(real, 'r-')
elif math_transform == '正弦':
real = ta.SIN(close)
axes[1].plot(real, 'r-')
elif math_transform == '双曲正弦':
real = ta.SINH(close)
axes[1].plot(real, 'r-')
elif math_transform == '平方根':
real = ta.SQRT(close)
axes[1].plot(real, 'r-')
elif math_transform == '正切':
real = ta.TAN(close)
axes[1].plot(real, 'r-')
elif math_transform == '双曲正切':
real = ta.TANH(close)
axes[1].plot(real, 'r-')
plt.show()
# 数学操作
def math_operator_process(event):
print(event.widget.get())
math_operator = event.widget.get()
upperband, middleband, lowerband = ta.BBANDS(close, timeperiod=5, nbdevup=2, nbdevdn=2, matype=0)
fig, axes = plt.subplots(2, 1, sharex=True)
ax1, ax2 = axes[0], axes[1]
axes[0].plot(close, 'rd-', markersize=3)
axes[0].plot(upperband, 'y-')
axes[0].plot(middleband, 'b-')
axes[0].plot(lowerband, 'y-')
axes[0].set_title(math_operator, fontproperties="SimHei")
if math_operator == '指定的期间的最大值':
real = ta.MAX(close, timeperiod=30)
axes[1].plot(real, 'r-')
elif math_operator == '指定的期间的最大值的索引':
integer = ta.MAXINDEX(close, timeperiod=30)
axes[1].plot(integer, 'r-')
elif math_operator == '指定的期间的最小值':
real = ta.MIN(close, timeperiod=30)
axes[1].plot(real, 'r-')
elif math_operator == '指定的期间的最小值的索引':
integer = ta.MININDEX(close, timeperiod=30)
axes[1].plot(integer, 'r-')
elif math_operator == '指定的期间的最小和最大值':
min, max = ta.MINMAX(close, timeperiod=30)
axes[1].plot(min, 'r-')
axes[1].plot(max, 'r-')
elif math_operator == '指定的期间的最小和最大值的索引':
minidx, maxidx = ta.MINMAXINDEX(close, timeperiod=30)
axes[1].plot(minidx, 'r-')
axes[1].plot(maxidx, 'r-')
elif math_operator == '合计':
real = ta.SUM(close, timeperiod=30)
axes[1].plot(real, 'r-')
plt.show()
root = tk.Tk()
# 第一行:重叠指标
rowframe1 = tk.Frame(root)
rowframe1.pack(side=tk.TOP, ipadx=3, ipady=3)
tk.Label(rowframe1, text="重叠指标").pack(side=tk.LEFT)
overlap_indicator = tk.StringVar() # 重叠指标
combobox1 = ttk.Combobox(rowframe1, textvariable=overlap_indicator)
combobox1['values'] = ['布林线','双指数移动平均线','指数移动平均线 ','希尔伯特变换——瞬时趋势线',
'考夫曼自适应移动平均线','移动平均线','MESA自适应移动平均','变周期移动平均线',
'简单移动平均线','三指数移动平均线(T3)','三指数移动平均线','三角形加权法 ','加权移动平均数']
combobox1.current(0)
combobox1.pack(side=tk.LEFT)
combobox1.bind('<<ComboboxSelected>>', overlap_process)
# 第二行:动量指标
rowframe2 = tk.Frame(root)
rowframe2.pack(side=tk.TOP, ipadx=3, ipady=3)
tk.Label(rowframe2, text="动量指标").pack(side=tk.LEFT)
momentum_indicator = tk.StringVar() # 动量指标
combobox2 = ttk.Combobox(rowframe2, textvariable=momentum_indicator)
combobox2['values'] = ['绝对价格振荡器','钱德动量摆动指标','移动平均收敛/散度','带可控MA类型的MACD',
'移动平均收敛/散度 固定 12/26','动量','比例价格振荡器','变化率','变化率百分比',
'变化率的比率','变化率的比率100倍','相对强弱指数','随机相对强弱指标','三重光滑EMA的日变化率']
combobox2.current(0)
combobox2.pack(side=tk.LEFT)
combobox2.bind('<<ComboboxSelected>>', momentum_process)
# 第三行:周期指标
rowframe3 = tk.Frame(root)
rowframe3.pack(side=tk.TOP, ipadx=3, ipady=3)
tk.Label(rowframe3, text="周期指标").pack(side=tk.LEFT)
cycle_indicator = tk.StringVar() # 周期指标
combobox3 = ttk.Combobox(rowframe3, textvariable=cycle_indicator)
combobox3['values'] = ['希尔伯特变换——主要的循环周期','希尔伯特变换——主要的周期阶段','希尔伯特变换——相量组件',
'希尔伯特变换——正弦曲线','希尔伯特变换——趋势和周期模式']
combobox3.current(0)
combobox3.pack(side=tk.LEFT)
combobox3.bind('<<ComboboxSelected>>', cycle_process)
# 第四行:统计功能
rowframe4 = tk.Frame(root)
rowframe4.pack(side=tk.TOP, ipadx=3, ipady=3)
tk.Label(rowframe4, text="统计功能").pack(side=tk.LEFT)
statistic_indicator = tk.StringVar() # 统计功能
combobox4 = ttk.Combobox(rowframe4, textvariable=statistic_indicator)
combobox4['values'] = ['贝塔系数;投资风险与股市风险系数','皮尔逊相关系数','线性回归','线性回归角度',
'线性回归截距','线性回归斜率','标准差','时间序列预测','方差']
combobox4.current(0)
combobox4.pack(side=tk.LEFT)
combobox4.bind('<<ComboboxSelected>>', statistic_process)
# 第五行:数学变换
rowframe5 = tk.Frame(root)
rowframe5.pack(side=tk.TOP, ipadx=3, ipady=3)
tk.Label(rowframe5, text="数学变换").pack(side=tk.LEFT)
math_transform = tk.StringVar() # 数学变换
combobox5 = ttk.Combobox(rowframe5, textvariable=math_transform_process)
combobox5['values'] = ['反余弦','反正弦','反正切','向上取整','余弦','双曲余弦','指数','向下取整',
'自然对数','常用对数','正弦','双曲正弦','平方根','正切','双曲正切']
combobox5.current(0)
combobox5.pack(side=tk.LEFT)
combobox5.bind('<<ComboboxSelected>>', math_transform_process)
# 第六行:数学操作
rowframe6 = tk.Frame(root)
rowframe6.pack(side=tk.TOP, ipadx=3, ipady=3)
tk.Label(rowframe6, text="数学操作").pack(side=tk.LEFT)
math_operator = tk.StringVar() # 数学操作
combobox6 = ttk.Combobox(rowframe6, textvariable=math_operator_process)
combobox6['values'] = ['指定期间的最大值','指定期间的最大值的索引','指定期间的最小值','指定期间的最小值的索引',
'指定期间的最小和最大值','指定期间的最小和最大值的索引','合计']
combobox6.current(0)
combobox6.pack(side=tk.LEFT)
combobox6.bind('<<ComboboxSelected>>', math_operator_process)
root.mainloop()
原文:http://www.cnblogs.com/hhh5460/p/5602357.html
Ta-lib函数功能列表的更多相关文章
- 2-3 Sass的函数功能-列表函数
列表函数主要包括一些对列表参数的函数使用,主要包括以下几种: length($list):返回一个列表的长度值: nth($list, $n):返回一个列表中指定的某个标签值 join($list1, ...
- dir()函数:罗列出参数所有的功能列表
#coding=utf-8import sysprint dir(sys)#罗列出参数中所有的功能列表sys.__doc__#调用参数中的函数 #dir()函数扩展展详解python中dir()函数不 ...
- Python3:sorted()函数及列表中的sort()函数
一.sort,sorted函数介绍: Sort函数是list列表中的函数,而sorted可以对list或者iterator进行排序. 下面我们使用help来查看他们的用法及功能: sort: ...
- 2-2 Sass的函数功能-字符串与数字函数
Sass的函数简介 在 Sass 中除了可以定义变量,具有 @extend.%placeholder 和 mixins 等特性之外,还自备了一系列的函数功能.其主要包括: 字符串函数 数字函数 列表函 ...
- python协程函数应用 列表生成式 生成器表达式
协程函数应用 列表生成式 生成器表达式 一.知识点整理: 1.可迭代的:对象下有_iter_方法的都是可迭代的对象 迭代器:对象._iter_()得到的结果就是迭代器 迭代器的特性: 迭代器._n ...
- 【UEFI】---BIOS中对Guid的使用以及Lib函数的使用总结
---恢复内容开始--- BIOS发展至今传统的汇编实现早已被抛弃,UEFI作为目前一套主流的标准定义接口,被广泛使用.之前被一些有关GUID和一些Lib函数的使用以及跨Pkg调用给折腾的不行,每次改 ...
- Android 手机卫士--设置界面&功能列表界面跳转逻辑处理
在<Android 手机卫士--md5加密过程>中已经实现了加密类,这里接着实现手机防盗功能 本文地址:http://www.cnblogs.com/wuyudong/p/5941959. ...
- oracle实现split函数功能
转载: http://blog.csdn.net/jojo52013145/article/details/6758279在实际的应用中,为了让PL/SQL 函数返回数据的多个行,必须通过返回一个 R ...
- 模拟实现兼容低版本IE浏览器的原生bind()函数功能
模拟实现兼容低版本IE浏览器的原生bind()函数功能: 代码如下: if(!Function.prototype.bind){ Function.prototype.bind=function( ...
随机推荐
- mysql5.7 date类型无法设置'0000-00-00'默认值
现象: mysql5.7之后版本datetime默认值设置'0000-00-00',出现异常:Invalid default value for 'create_time' 原因: mysql5.7之 ...
- 2.1 insertion sort 《算法导论》答案
2.1 insertion sort <算法导论>答案 答案索引帖 2.1-1 Using Figure 2.2 as a model, illustrate the operation ...
- ES6关于Unicode的相关扩展
前面的话 字符串是编程中重要的数据类型,只有熟练掌握字符串操作才能更高效地开发程序.JS中的字符串String类型是由引号括起来的一组由16位Unicode字符组成的字符序列.在过去,16位足以包含任 ...
- 学会用requirejs,5分钟足矣
学会用requirejs,5分钟足矣 据说公司的项目较多的用到requirejs管理依赖,所以大熊同学挤出了5分钟休息时间学习了一下,现在分享一下.如果你想了解requirejs的实现原理,请绕道!如 ...
- LInux挂载windows共享磁盘
#!/bin/sh #进行windows paths目录同步 cd /mnt str="//10.33.4.199/linux" result=$(df | grep ${str} ...
- Windows7 下安装 tersorflow
最近看起深度学习的一些知识,想要学习一个框架.在网上看了别人对这些框架的评比后,决定学习 tersorflow.之前一直以为 tersorflow 只可以在 Linux 下安装,出乎意料的是,Wind ...
- 【科普】什么是TLS1.3
TLS1.3是一种新的加密协议,它既能提高各地互联网用户的访问速度,又能增强安全性. 我们在访问许多网页的时候,常常会在浏览器的地址栏上看到一个锁的图标,并使用"https"代替传 ...
- (转)log4j(五)——如何控制不同目的地的日志输出?
一:测试环境与log4j(一)——为什么要使用log4j?一样,这里不再重述 1 老规矩,先来个栗子,然后再聊聊感受 package test.log4j.test5; /** * @author l ...
- Postgres by BigSQL and Hadoop_fdw
Postgres by BigSQL and hadoop_fdw 测试Postgresql和远程Hive的Join操作. 测试环境 Centos6.8 HDP2.4集群,其中Hive Server2 ...
- HDU1027 Ignatius and the Princess II
Problem Description Now our hero finds the door to the BEelzebub feng5166. He opens the door and fin ...