Kubernetes之利用prometheus监控K8S集群
prometheus它是一个主动拉取的数据库,在K8S中应该展示图形的grafana数据实例化要保存下来,使用分布式文件系统加动态PV,但是在本测试环境中使用本地磁盘,安装采集数据的agent使用DaemonSet来部署,DaemonSet的特性就是在每个node上部署一个服务进程,这一切都是自动的部署。
此处只讲如何用prometheus来监控K8S集群,关于prometheus的知识参考官方文档。另外有
部署前提: 准备好所需要的文件
$ ls -l

Prometheus/prometheus#:/data/Prometheus/prometheus# ls -l

total 28

drwxr-xr-x 2 root root 4096 Jan 15 02:53 grafana

drwxr-xr-x 2 root root 4096 Jan 15 03:11 kube-state-metrics

-rw-r--r-- 1 root root   60 Jan 14 06:48 namespace.yaml

drwxr-xr-x 2 root root 4096 Jan 15 03:22 node-directory-size-metrics

drwxr-xr-x 2 root root 4096 Jan 15 03:02 node-exporter

drwxr-xr-x 2 root root 4096 Jan 15 02:55 prometheus

drwxr-xr-x 2 root root 4096 Jan 15 02:37 rbac

$ ls grafana/

grafana-configmap.yaml  grafana-core-deployment.yaml  grafana-import-dashboards-job.yaml  grafana-pvc-claim.yaml  grafana-pvc-volume.yaml  grafana-service.yaml

$ ls prometheus/

configmap.yaml  deployment.yaml  prometheus-rules.yaml  service.yaml
grafana和 prometheus 都是部署文件,node-exporter、kube-state-metrics、node-directory-size-metrics这三个是采集器,相当于prometheus的agent
文件准备好了,现在开始一步一步来部署:
1,,创建所需Namespace
因为prometheus 部署的所有的deploy、pod、svc都是在monitoring完成的,所以需要事先创建之。
 $ cat namespace.yaml

 apiVersion: v1

 kind: Namespace

 metadata:

  name: monitoring


 $ kubectl create -f namespace.yaml

 namespace "monitoring" created
2,创建grafana的pv、 pvc
grafana# cat grafana-pvc-volume.yaml

kind: PersistentVolume

apiVersion: v1

metadata:

  name: grafana-pv-volume

  labels:

    type: local

spec:

  storageClassName: grafana-pv-volume

  capacity:

    storage: 10Gi

  accessModes:

    - ReadWriteOnce

  persistentVolumeReclaimPolicy: Recycle

  hostPath:

    path: "/data/volume/grafana"


grafana# cat grafana-pvc-claim.yaml

kind: PersistentVolumeClaim

apiVersion: v1

metadata:

  name: grafana-pvc-volume

  namespace: "monitoring"

spec:

  accessModes:

    - ReadWriteOnce

  resources:

    requests:

      storage: 5Gi

  storageClassName: grafana-pv-volume


$ kubectl create -f grafana/grafana-pvc-volume.yaml -f grafana/grafana-pvc-claim.yaml

persistentvolume "grafana-pv-volume" created

persistentvolumeclaim "grafana-pvc-volume" created

$ kubectl get pvc -n monitoring

NAME          STATUS           VOLUME       CAPACITY   ACCESS MODES   STORAGECLASS     AGE

grafana-pvc-volume   Bound     grafana-pv-volume   10Gi       RWO     grafana-pv-volume   52s


状态bound已绑定到了 grafana-pv-volume
3,创建grafana应用,这些应用都是第三方的,都会有自已的配置,通过configmap来定义
grafana# ls

grafana-configmap.yaml  grafana-core-deployment.yaml  grafana-import-dashboards-job.yaml  grafana-pvc-claim.yaml  grafana-pvc-volume.yaml  grafana-service.yaml

grafana# kubectl create -f ./    #grafana目录下所有文件都创建

configmap "grafana-import-dashboards" created

deployment "grafana-core" created

job "grafana-import-dashboards" created

service "grafana" created

grafana# kubectl get deployment,pod -n monitoring

NAME                  DESIRED   CURRENT   UP-TO-DATE   AVAILABLE   AGE

deploy/grafana-core   1         1         1            0           1m

NAME                              READY     STATUS              RESTARTS   AGE

po/grafana-core-9c7f66868-7q8lx   0/1       ContainerCreating   0          1m

运行po/grafana-core 容器时会下载镜像: grafana/grafana:4.2.0
grafana创建的应用 简单的自已描述了下:
      grafana-pv-volume=/data/volume/grafana =10G

      grafana-pvc-volume=5G--->grafana-pv-volume

      ---configmap=grafana-import-dashboards

      Job=grafana-import-dashboards


      Deployment=grafana-core     replicas: 1  containers=grafana-core   mount:  grafana-pvc-volume:/var

      service=grafana     port: 3000  = nodePort: 30161     (3000是grafana服务的默认端口)
4, 现在grafana的核心应用已部署好了,现在来部署prometheus的RBAC
prometheus/rbac# ls

grant_serviceAccount.sh  prometheus_rbac.yaml

#先创建RBAC文件:

prometheus/rbac# kubectl create -f prometheus_rbac.yaml

clusterrolebinding "prometheus-k8s" created

clusterrolebinding "kube-state-metrics" created

clusterrole "kube-state-metrics" created

serviceaccount "kube-state-metrics" created

clusterrolebinding "prometheus" created

clusterrole "prometheus" created

serviceaccount "prometheus-k8s" created

prometheus/rbac#
5,创建prometheus的deloyment,service
prometheus/prometheus# ls

configmap.yaml  deployment.yaml  prometheus-rules.yaml  service.yaml

prometheus/prometheus#

在configmap.yaml中要注意的是在1.7以后,获取cadvsion监控pod等的信息时,用的是kubelet的4194端口,

注意以下这段:这是采集cadvision信息,必须是通过kubelet的4194端口,所以Kubelet必须监听着,4194部署了cadvsion来获取pod中容器信息

prometheus/prometheus#cat configmap.yaml

 # https://github.com/prometheus/prometheus/blob/master/documentation/examples/prometheus-kubernetes.yml#L37

      - job_name: 'kubernetes-nodes'

        tls_config:

          ca_file: /var/run/secrets/kubernetes.io/serviceaccount/ca.crt

        bearer_token_file: /var/run/secrets/kubernetes.io/serviceaccount/token

        kubernetes_sd_configs:

          - role: node

        relabel_configs:

          - source_labels: [__address__]

            regex: '(.*):10250'

            replacement: '${1}:10255'

            target_label: __address__

      - job_name: 'kubernetes-cadvisor'

        scheme: https

        tls_config:

          ca_file: /var/run/secrets/kubernetes.io/serviceaccount/ca.crt

        bearer_token_file: /var/run/secrets/kubernetes.io/serviceaccount/token

        kubernetes_sd_configs:

          - role: node

        relabel_configs:

        - action: labelmap

          regex: __meta_kubernetes_node_label_(.+)

        - target_label: __address__

          replacement: kubernetes.default.svc.cluster.local:443

        - source_labels: [__meta_kubernetes_node_name]

          regex: (.+)

          target_label: __metrics_path__

          replacement: /api/v1/nodes/${1}:4194/proxy/metrics

      # https://github.com/prometheus/prometheus/blob/master/documentation/examples/prometheus-kubernetes.yml#L79
prometheus-rules.yaml 这是它的发现规则文件
deployment.yaml service.yaml 这两个是部署的文件, deployment部署中资源限制建议放大一点
现在部署prometheus目录下所有文件:
prometheus/prometheus# kubectl create -f ./

configmap "prometheus-core" created

deployment "prometheus-core" created

configmap "prometheus-rules" created

service "prometheus" created

prometheus/prometheus#

prometheus/prometheus# kubectl get deployment,pod -n monitoring

NAME                     DESIRED   CURRENT   UP-TO-DATE   AVAILABLE   AGE

deploy/grafana-core      1         1         1            1           16m

deploy/prometheus-core   1         1         1            1           1m

NAME                                  READY     STATUS    RESTARTS   AGE

po/grafana-core-9c7f66868-wm68j       1/1       Running   0          16m

po/prometheus-core-6dc6777c5b-5nc7j   1/1       Running   0          1m
prometheus应用的部署,简单描述下创建的内容:
    Deployment= prometheus-core   replicas: 1    containers=prometheus   image: prom/prometheus:v1.7.0    containerPort: 9090(webui)

    Service    name: prometheus   NodePort-->port: 9090 -webui
6,prometheus部署完了现在来部署它的agent,也就是采集器:
Prometheus/prometheus# ls node-directory-size-metrics/

daemonset.yaml

Prometheus/prometheus# ls kube-state-metrics/

deployment.yaml  service.yaml

Prometheus/prometheus# ls node-exporter/

exporter-daemonset.yaml  exporter-service.yaml

Prometheus/prometheus#

#其中两个用的是daemonset

Prometheus/prometheus# kubectl create -f node-exporter/ -f kube-state-metrics/ -f node-directory-size-metrics/

daemonset "prometheus-node-exporter" created

service "prometheus-node-exporter" created

deployment "kube-state-metrics" created

service "kube-state-metrics" created

daemonset "node-directory-size-metrics" created

Prometheus/prometheus#

Prometheus/prometheus# kubectl get deploy,pod,svc -n monitoring

NAME                        DESIRED   CURRENT   UP-TO-DATE   AVAILABLE   AGE

deploy/grafana-core         1         1         1            1           26m

deploy/kube-state-metrics   2         2         2            2           1m

deploy/prometheus-core      1         1         1            1           11m

NAME                                     READY     STATUS    RESTARTS   AGE

po/grafana-core-9c7f66868-wm68j          1/1       Running   0          26m

po/kube-state-metrics-694fdcf55f-bqcp8   1/1       Running   0          1m

po/kube-state-metrics-694fdcf55f-nnqqd   1/1       Running   0          1m

po/node-directory-size-metrics-n9wx7     2/2       Running   0          1m

po/node-directory-size-metrics-ppscw     2/2       Running   0          1m

po/prometheus-core-6dc6777c5b-5nc7j      1/1       Running   0          11m

po/prometheus-node-exporter-kchmb        1/1       Running   0          1m

po/prometheus-node-exporter-lks5m        1/1       Running   0          1m

NAME                           TYPE        CLUSTER-IP      EXTERNAL-IP   PORT(S)          AGE

svc/grafana                    NodePort    10.254.231.25   <none>        3000:30161/TCP   26m

svc/kube-state-metrics         ClusterIP   10.254.156.51   <none>        8080/TCP         1m

svc/prometheus                 NodePort    10.254.239.90   <none>        9090:37318/TCP   10m

svc/prometheus-node-exporter   ClusterIP   None            <none>        9100/TCP         1m

Prometheus/prometheus#

--------

Prometheus/prometheus# kubectl get pod -o wide -n monitoring

NAME                                  READY     STATUS    RESTARTS   AGE       IP             NODE

prometheus-node-exporter-kchmb        1/1       Running   0          4m        10.3.1.16      10.3.1.16

prometheus-node-exporter-lks5m        1/1       Running   0          4m        10.3.1.17      10.3.1.17

#这两个是exporter,用的是daemonset 分别在这两个node上运行了。这样就可以采集到所有数据了。
如上部署完成,以下是用自已的话简单描述下:
 node-exporter/exporter-daemonset.yaml 文件:

       DaemonSet=prometheus-node-exporter

          containers: name: prometheus-node-exporter    image: prom/node-exporter:v0.14.0

          containerPort: 9100   hostPort: 9100  hostNetwork: true    #它用的是主机的9100端口


		Prometheus/prometheus/node-exporter# kubectl get  daemonset,pod -n monitoring

		NAME                             DESIRED   CURRENT   READY     UP-TO-DATE   AVAILABLE   NODE SELECTOR   AGE

		ds/node-directory-size-metrics   2         2         2         2            2           <none>          16h

		ds/prometheus-node-exporter      2         2         2         2            2           <none>          16h

           因为它是daemonset,所以相应的也会运行着两个Pod: prometheus-node-exporter

      Service=prometheus-node-exporter   clusterIP: None   port: 9100  type: ClusterIP   #它没有clusterIP


	# kubectl get  service -n monitoring

	NAME                       TYPE        CLUSTER-IP      EXTERNAL-IP   PORT(S)          AGE

	prometheus-node-exporter   ClusterIP   None            <none>        9100/TCP         16h
kube-state-metrics/deployment.yaml 文件:

      Deployment=kube-state-metrics replicas: 2   containers-->name: kube-state-metrics  image: gcr.io/google_containers/kube-state-metrics:v0.5.0

                 containerPort: 8080


      Service     name: kube-state-metrics   port: 8080  #没有映射

                                 #kubectl get deployment,pod,svc -n monitoring

			NAME                        DESIRED   CURRENT   UP-TO-DATE   AVAILABLE   AGE

			deploy/kube-state-metrics   2         2         2            2           16h

			NAME                                     READY     STATUS    RESTARTS   AGE

			po/kube-state-metrics-694fdcf55f-2mmd5   1/1       Running   0          11h

			po/kube-state-metrics-694fdcf55f-bqcp8   1/1       Running   0          16h

			NAME                           TYPE        CLUSTER-IP      EXTERNAL-IP   PORT(S)          AGE

			svc/kube-state-metrics         ClusterIP   10.254.156.51   <none>        8080/TCP         16h
node-directory-size-metrics/daemonset.yaml 文件:

        #因为是daemonset,所以未定义replicas数量,直接运行在每个node之上,但是它没有创建service

      DaemonSet : name: node-directory-size-metrics

                  containers-->name: read-du  image: giantswarm/tiny-tools   mountPath: /mnt/var   mountPath: /tmp

                  containers--> name: caddy    image: dockermuenster/caddy:0.9.3 containerPort: 9102

                               mountPath: /var/www   hostPath /var


		kubectl get daemonset,pod,svc -n monitoring

		NAME                             DESIRED   CURRENT   READY     UP-TO-DATE   AVAILABLE   NODE SELECTOR   AGE

		ds/node-directory-size-metrics   2         2         2         2            2           <none>          16h

		NAME                                     READY     STATUS    RESTARTS   AGE

		po/node-directory-size-metrics-n9wx7     2/2       Running   0          16h

		po/node-directory-size-metrics-ppscw     2/2       Running   0          16h

		NAME                           TYPE        CLUSTER-IP      EXTERNAL-IP   PORT(S)          AGE

                     没有node-directory-size-metrics的service
到此 prometheus算是部署完成了,最后来看下它暴露的端口:
Prometheus/prometheus# kubectl get svc -o wide -n monitoring

NAME                       TYPE        CLUSTER-IP      EXTERNAL-IP   PORT(S)          AGE       SELECTOR

grafana                    NodePort    10.254.231.25   <none>        3000:30161/TCP   31m       app=grafana,component=core

kube-state-metrics         ClusterIP   10.254.156.51   <none>        8080/TCP         6m        app=kube-state-metrics

prometheus                 NodePort    10.254.239.90   <none>        9090:37318/TCP   16m       app=prometheus,component=core

prometheus-node-exporter   ClusterIP   None            <none>        9100/TCP         6m        app=prometheus,component=node-exporter

Prometheus/prometheus#
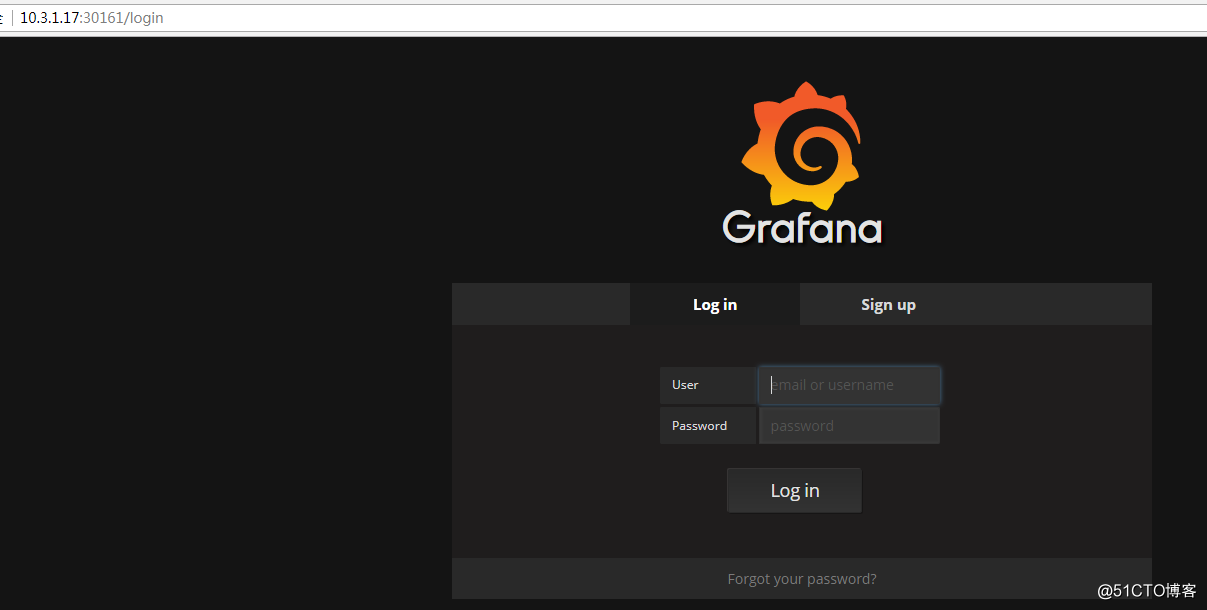
7,访问、使用prometheus
如上可以看到grafana的端口号是30161,NodeIP:30161 就可以打开grafana,默认admin/admin
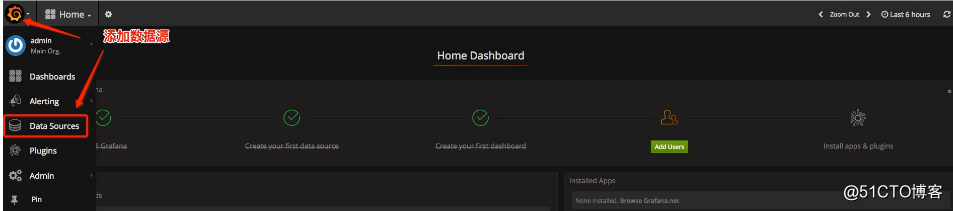
登录后,添加数据源:
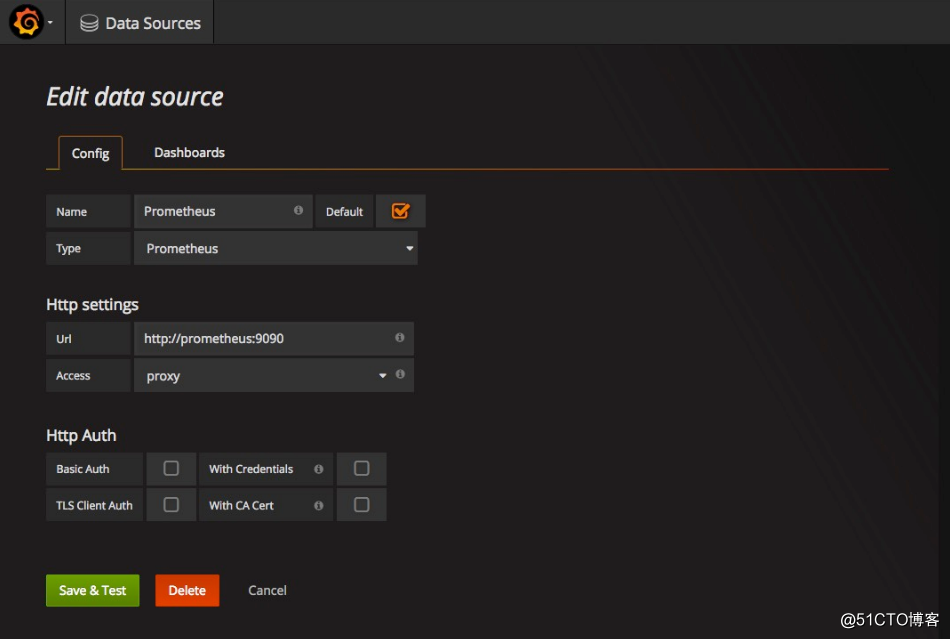
添加Prometheus的数据源:
将Prometheus的作为数据源的相关参数如下图所示:
添加完后,导入模板文件:
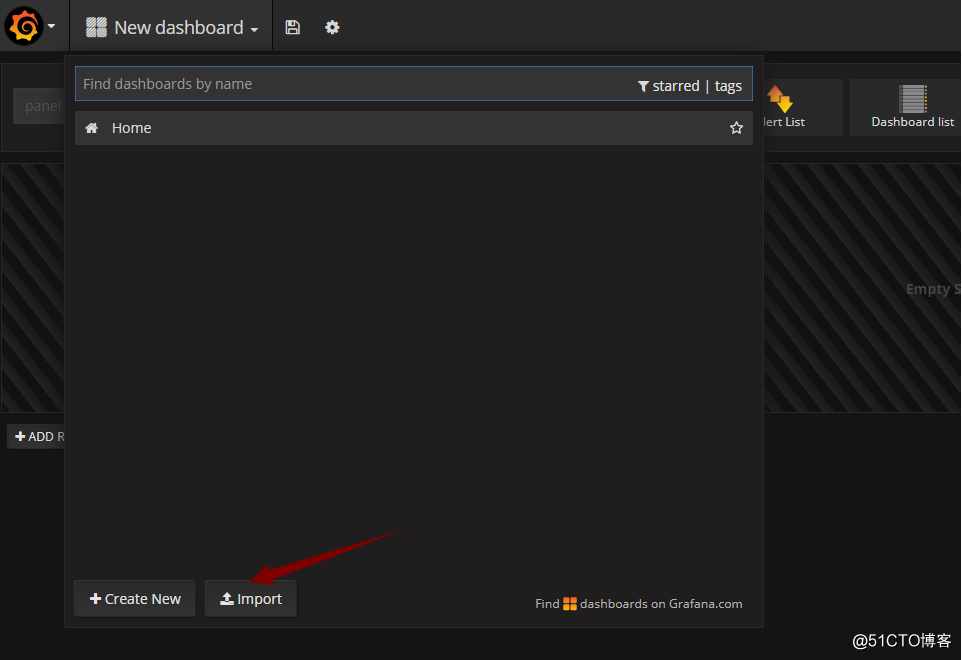
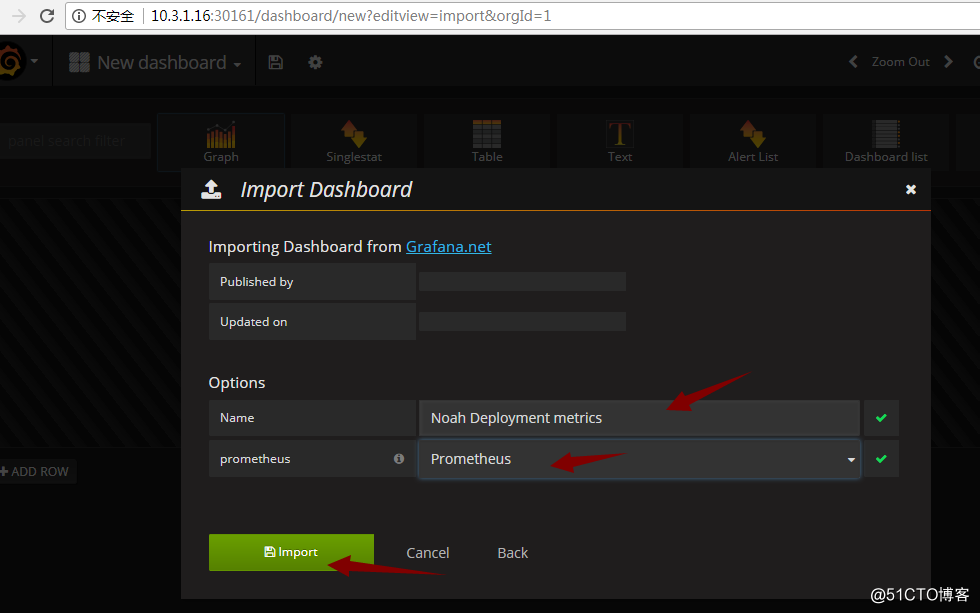
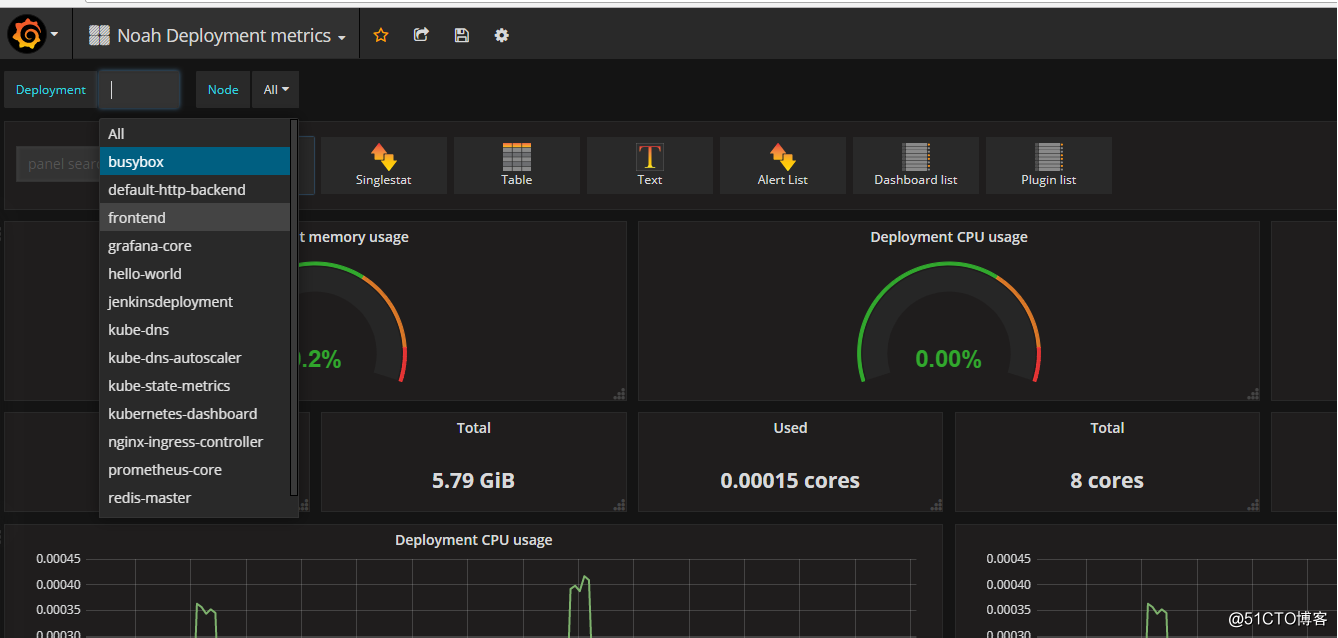
部署完成。
Kubernetes之利用prometheus监控K8S集群的更多相关文章
- 基于prometheus监控k8s集群
本文建立在你已经会安装prometheus服务的基础之上,如果你还不会安装,请参考:prometheus多维度监控容器 如果你还没有安装库k8s集群,情参考: 从零开始搭建基于calico的kuben ...
- Prometheus 监控K8S集群资源监控
Prometheus 监控K8S集群中Pod 目前cAdvisor集成到了kubelet组件内,可以在kubernetes集群中每个启动了kubelet的节点使用cAdvisor提供的metrics接 ...
- 如何用prometheus监控k8s集群中业务pod的metrics
一般,我们从网上看到的帖子和资料, 都是用prometheus监控k8s的各项资源, 如api server, namespace, pod, node等. 那如果是自己的业务pod上的自定义metr ...
- 如何使用helm优雅安装prometheus-operator,并监控k8s集群微服务
前言:随着云原生概念盛行,对于容器.服务.节点以及集群的监控变得越来越重要.Prometheus 作为 Kubernetes 监控的事实标准,有着强大的功能和良好的生态.但是它不支持分布式,不支持数据 ...
- Prometheus 监控 Redis 集群的正确姿势
Prometheus 监控Redis的正确姿势(redis集群) Prometheus 监控 Redis cluster,其实套路都是一样的,使用 exporter. exporter 负责采集指标, ...
- shell脚本监控k8s集群job状态,若出现error通过触发阿里云的进程监控报警
#!/bin/bash while [ 1 ] do job_error_no=`kubectl get pod -n weifeng |grep -i "job"|grep -c ...
- Kubernetes 学习3 kubeadm初始化k8s集群
一.k8s集群 1.k8s整体架构图 2.k8s网络架构图 二.基于kubeadm安装k8s步骤 1.master,nodes:安装kubelet,kubeadm,docker 2.master: k ...
- Prometheus神器之监控K8s集群
Prometheus 简介 Prometheus是SoundCloud开源的一款开源软件.它的实现参考了Google内部的监控实现,与源自Google的Kubernetes结合起来非常合适.另外相比i ...
- Prometheus监控elasticsearch集群(以elasticsearch-6.4.2版本为例)
部署elasticsearch集群,配置文件可"浓缩"为以下: cluster.name: es_cluster node.name: node1 path.data: /app/ ...
随机推荐
- Docker容器和本机之间的文件传输 使用Docker部署Tomcat项目
Docker容器和本机之间的文件传输. http://blog.csdn.net/leafage_m/article/details/72082011 使用Docker部署Tomcat项目 http: ...
- Chapter 2 软件过程
软件发展前期,人们只重视结果而忽略了过程,随着技术的成熟,软件过程的重要性被日益发觉.软件过程是软件工程人员为了获得软件产品而在软件工具的支持下实施的一系列软件工程活动. 软件过程的基本活动包括问题提 ...
- 图论 Kruskal算法 并查集
#include<iostream> #include<cstring> #include<string> #include<cstdio> #incl ...
- HDU 1170 Shopping Offers 离散+状态压缩+完全背包
题目链接: http://poj.org/problem?id=1170 Shopping Offers Time Limit: 1000MSMemory Limit: 10000K 问题描述 In ...
- 【动态规划】POJ-2229
一.题目 Description Farmer John commanded his cows to search for different sets of numbers that sum to ...
- eg_6
问题描述: 将一句话的单词进行倒置,标点不倒置.比如 I like beijing. 经过函数后变为:beijing. like I Demo1: import java.util.Scanner; ...
- springboot maven
更多信息请从官网获取https://docs.spring.io/spring-boot/docs/2.0.1.RELEASE 1.parent基于自己项目而非spring-boot-starter- ...
- win xp安装
Windows XP with sp3 VOL 微软原版下载: zh-hans_windows_xp_professional_with_service_pack_3_x86_cd_vl_x14-74 ...
- Augmenting DOM Storage with IE's userData behavior
http://www.javascriptkit.com/javatutors/domstorage2.shtml Augmenting DOM Storage with IE's userData ...
- Whitecoin区块链钱包高级功能使用命令
格式:NO-命令-命令概要-主要对象-参数 <必须参数> [可选参数]-含义-描述-需要未锁定钱包 1 addmultisigaddress 新增多重签名地址 地址 <nrequ ...