matlab 初级画图
matlab 初级画图
1.plot()
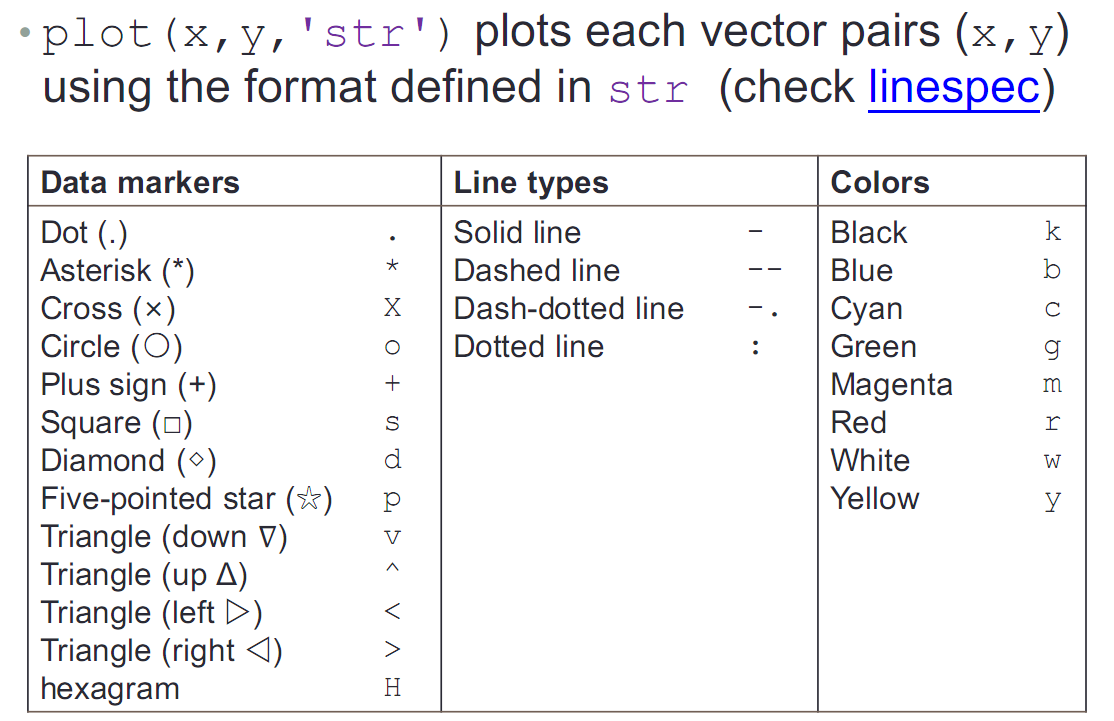
plot(x,y) plots each vector pairs (x,y)
画图函数画出每个点 每组变量
plot (y) plots each vector pairs(x,y),where x=[1...n],n=length(y)
仅有一个变量时 仅画出 当x=整数点时的对应y值得点
example:
plot (cos(0:pi/20:2*pi));
从0-2π 间隔为pi/20的 那些cos值
x=0:1/1000:2*pi; 1/1000为步进值 越小越光滑
y=sin(x);
plot(x,y);
保持当前图的基础上再另加其他的图 需要用到指令 hold on
关闭功能为hold off
例如 hold on
plot(sin(0:2pi));
plot(cos(0:2pi));
hold off
plot style
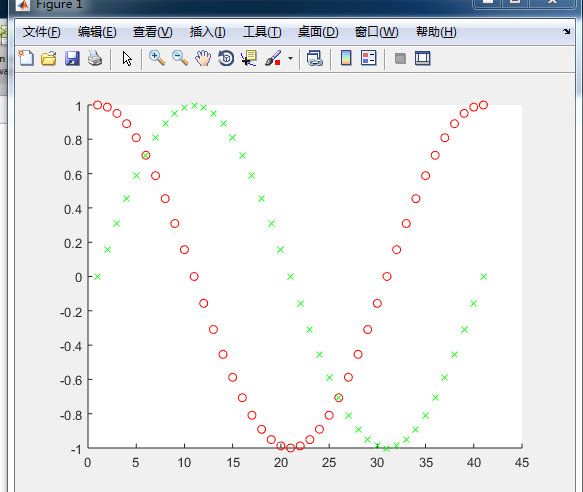
hold on
plot (cos(0:pi/20:2*pi),'or'); 对照上表中 or表示红色的圆圈
plot(sin(0:pi/20:2*pi).'xg'); xg 表示绿色的XX
hold off
如下图所示
legend() 图例
1.add legend to graph
legend('L1',....)
1.position adjustment 位置调节
例如:
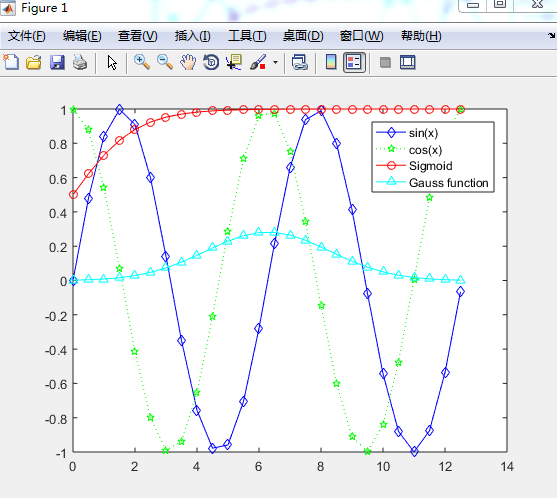
x=0:0.05:4*pi;
y=sin(x);
h=cos(x);
w=1./(1+exp(-x));
g=(1/(2*pi*2)^0.5).*exp((-1.*(x-2*pi).^2)./(2*2^2));
plot(x,y,'bd-',x,h,'gp:',x,w,'ro-',x,g,'c^-');
legend('sin(x)','cos(x)','Sigmoid','Gauss function');
如下图所示
title() and ?label() 标题和坐标轴
title() xlabel() ylabel() zlabel()
xlabel('str');
ylabel('str');
title('str');
str中的转义字符 例如pi 表示成π 则需要 输入\pi
表示e的-x次方 需要输入 e^{-x} 大括号表示特殊的字元
text() and annotation()
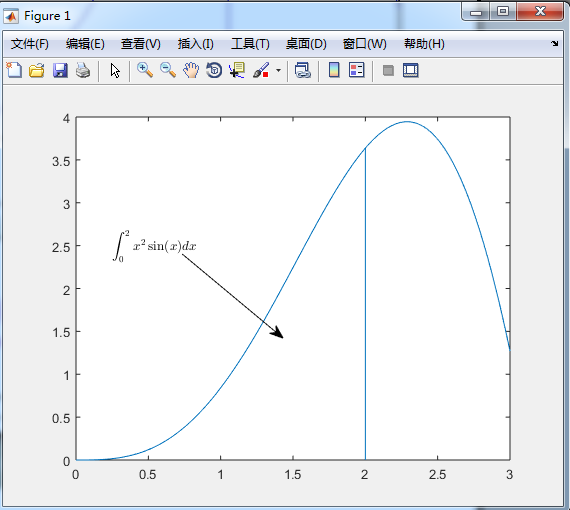
text with mathematical expression using LaTex
x=linspace(0,3);
y=x.^2.*sin(x);
plot(x,y);
line([2,2],[0,2^2*sin(2)]);
str='$$ \int_{0}^{2} x^2\sin(x) dx $$';
text(0.25,2.5,str,'Interpreter','latex');
annotation('arrow','X',[0.32,0.5],'Y',[0.6,0.4]);
1.
linspace是Matlab中的均分计算指令,用于产生x1,x2之间的N点行线性的矢量。其中x1、x2、N分别为起始值、终止值、元素个数。若默认N,默认点数为100。 X=linspace(1,100)
3.\int 就是积分符号 _{0}为下标 ^{2} 表示上标 ,x^2\sin(x)dx 为内容为x的平方sin(x)dx ,$$为语法格式
4.'arrow','X',[0.32,0.5],'Y',[0.6,0.4] 其中的0.32和0.5为箭头的坐标
练习
plot f as a black line and g as aseries of red circles for the range t=1 to 2 in on figure
f=t^2 and g=sin(2πt)
Label each axis, and add title and legend
hold on
t=linspace(1,2);
f=t.^2;
g=sin(2*pi*t);
plot(t,f,'k-',t,g,'ro');
xlabel('Time(ms)');
ylabel('f(t)');
title('Mini Assignment \#1');
legend('t^{2}','sin(2\pit)');
hold off
图示如下

Figure Adjustment
several properties:
font font size line width axis limit tick position tick label
字体 大小 线条宽度 轴的极限 步进位置 步进标签
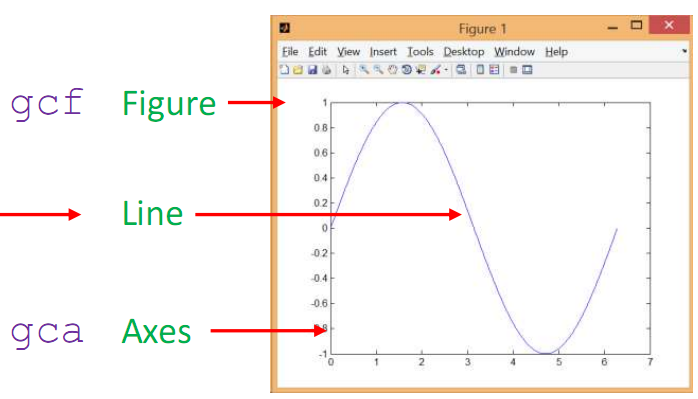
first step what kinds of objects in the graph?
a figure is composed of many objects?
figure object axes object line object
层级关系
hierarchy--》figure--》axes----》(line;text;surface;....) 对象的层级关系 分别是 图形 坐标轴 (线 文本 表面...)
figure 的属性 编辑---》图形属性 调出界面

modifying properties of an object
strategy:
1. identify the handle of an object 定义对象的句柄(变量实例);
2. fetch or modify the object 's properties 获取或修改对象的属性
example
1.upon creantion:
h=plot(x,y);
get(h);
例子中的h指向line
utility functions 工具函数
gca return handle of current axes 当前的坐标轴实例句柄
gcf return handle of the current figure 当前图像的实例句柄
allchild find all children of specified objects 所有特殊指定对象的孩子
ancestor find ancestor of graphics object 图像中对象的祖先
delete delete an object
findall find all graphics objects
fetching modifying properties
to fetch properties ,
get()
to modify properties
set()
geting object properties
获取对象的属性
get(h);
get(gca);
setting axes limites
set(gca,'XLim',[0,2*pi]);
set(gca,'YLim',[-1.2,1.2]);
alternative:
xlim({0,2*pi});
ylim({-1.2,1.2});
setting font and tick of axes
set(gca,'FontSize ',25);
set(gca,'XTick',0:pi/2:2*pi); 给定范围和步进
set(gca,'XTickLabel',0:90:360); 以角度的形式替代上面的pi值
set(gca,'FontName','symbol'); 设置显示字类型 符号(字符串显示)
set(gca,'XTickLabel',{0",'p/2','p','3p/2','2p'}); 将坐标数值用字符显示 将字符列出
line specification
line style and width
set(h,'LineStyle','-.',...'LineWidth',7.0,'Color','g'); 其中 ...表示 其余的参数可以输入 如果没有其余参数 则...去掉
alternative:
plot(x,y,'-.g','LineWidth',7.0);
删除delete(h);
Marker specification
face and edge colors of the markder
x=rand(20,1); 随机生成矩阵 数值大于等于0 20个数
set(gca,'FontSize',18);
plot(x,'-md','LineWidth',2,'MarkerEdgeColor','k','MarkerFaceColor','g','MarkerSize',10); k为黑色 markeredgecolor 黑色边框 ;markerfacecolor 边框范围内的颜色为g 绿色 如图所示
xlim([1,20]);

exercise:

图1代码如下
set(gca,'XTick',1:1/5:2);
set(gca,'YTick',-1:1/2:4);
t=linspace(1,2);
y=t.^2;
f=sin(2*pi*t);
plot(t,y,'k-',t,f,'ro');
xlabel('Time(ms)');
ylabel('f(t)');
title('Mini Assignment #1');
legend('t^2','sin(2\pi t)','Location','northwest');
图2代码如下
set(gca,'XTick',1:1/5:2,'YTick',-1:1:4,'FontSize',15);
t=linspace(1,2);
y=t.^2;
f=sin(2*pi*t);
hold on
m=plot(t,y,'k-');
n=plot(t,f,'ro');
set(n,'MarkerEdgeColor','r','MarkerFaceColor','b');
set(m,'LineWidth',4);
xlabel('Time(ms)');
ylabel('f(t)');
title('Mini Assignment #1');
legend('t^2','sin(2\pi t)','Location','northwest');
hold off
Multiple Figures
Create a figure windows by calling figure 调用函数 创建图像
example:
x=-10:0.1:10;
y1=x.^2-8;
y2=exp(x);
figure, plot(x,y1);
figure,plot(x,y2);
分别画出两个图像

be careful when using the gcf handle where there exists multiple figures
存在多个figure 注意 gcf函数时调用的那个句柄
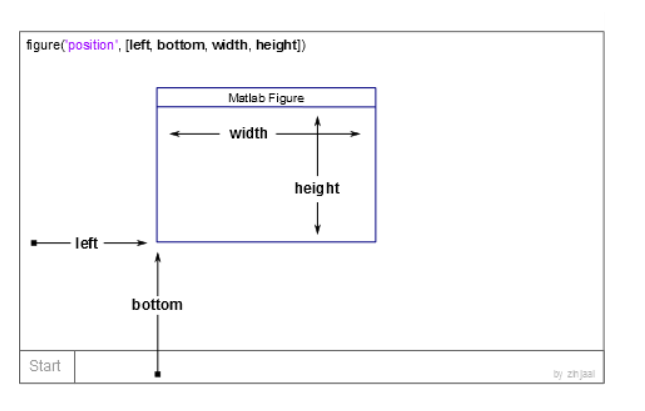
Figure Position and Size
figure('Position',[left,bottom,width,height]);
example:
x=-10:0.1:10;
y1=x.^2-8;
figure('position',[10,10,1000,700]); 窗口在屏幕中的位置会变化
plot(x,y1);
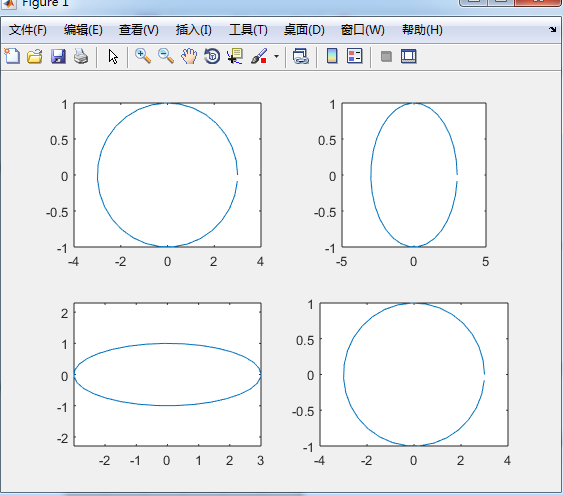
Several Plots in One Figure 一个窗口中多个图像
Several small plots "in a figure"
subplot(m,n,1); 其中的m n为矩阵中的行数和列数 1为位置

example:
t=0:0.2:2*pi;
x=3*cos(t);
y=sin(t);
subplot(2,2,1);plot(x,y);axis normal
subplot(2,2,2);plot(x,y);axis square
subplot(2,2,3);plot(x,y);axis equal
subplot(2,2,4);plot(x,y);axis equal tight
如图所示
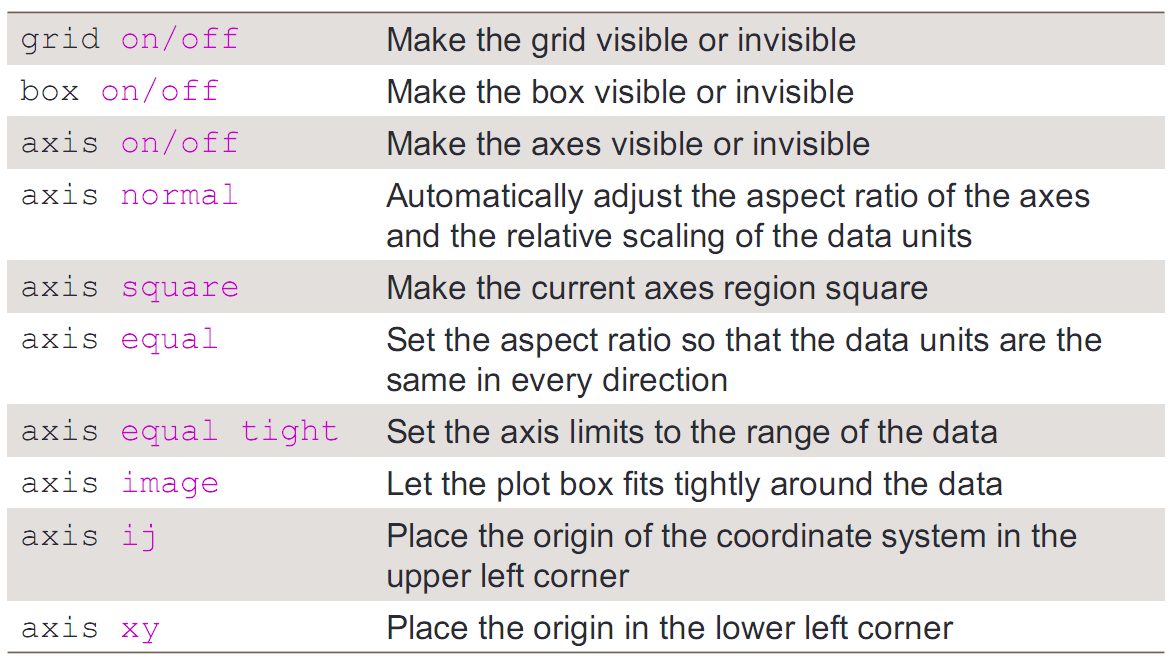
Control of Grid,Box,and Axis
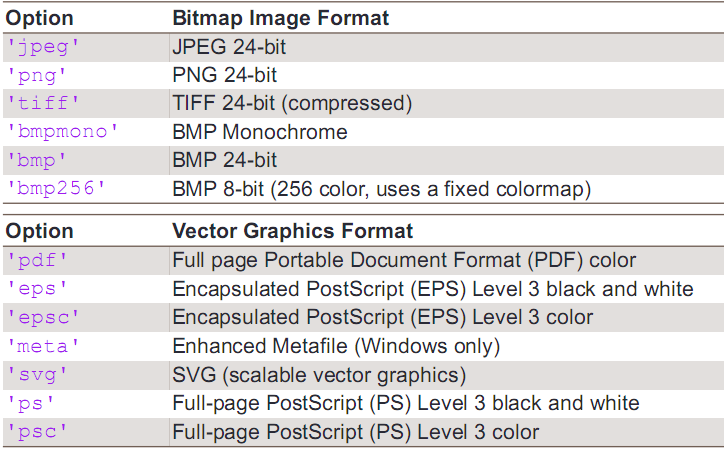
Saving Figures into Files
命令:saveas(gcf,'<filename>','<formattype>');
选项
matlab 初级画图的更多相关文章
- matlab三维画图
matlab三维画图主要有三个命令:plot3命令.mesh命令和surf命令. plot3 plot3是三维画图的基本函数,绘制的是最为主要的3D曲线图,最主要的调用格式是: plot3(X,Y,Z ...
- MATLAB简易画图2—普通直角坐标系
MATLAB简易画图2—普通直角坐标系 本人的MATLAB版本为: 作者:凯鲁嘎吉 - 博客园 http://www.cnblogs.com/kailugaji/ 继续在“MATLAB简易画图”这篇随 ...
- 在Matlab中画图输出
在Matlab中画图后,可能会调整格式.输出存储时,格式会忽然消失. 可以修改右下边Export setup,将Font size设置成auto. 这样就保留了编辑效果.
- (matlab)plot画图的颜色线型(转)
http://wenku.baidu.com/link?url=SVVMVH8QlDIu2hVKDtoBYs6l0CnQvFnFHJJ9yexmYVKQqhz47qIr7aK7LOf8nN0qNdy8 ...
- MATLAB plot 画图大全
距离上一次打开Matlab已经过去了半年多,再次上手,画图时诸多不熟悉,促使我写下这篇blog,自己以后可以快速查看,也分享给大家~ 二维线图 plot plot(X1,Y1,LineSpec1,. ...
- MATLAB 损失函数画图
损失函数画图 Hinge loss function: \[H(z) = max(0,1-z)\] $\psi$-learning loss function: \[{\phi _s}(z) = \l ...
- matlab初级
命令 ======== 系统命令 命令 功能 例 date 显示当前日期 ans = 20-Jul-2019 what 当前文件夹下的matlab文件 type 文件中的内容 type CV.m ...
- Matlab之画图
1.设置对数坐标 set(gca,'XScale','log','YScale','log'); 2.加网格 grid on; 3.加log对齐网格 set(gca,'XScale','log','Y ...
- 关于matlab中画图放大局部细节的问题
1)需要用得到一个matnify.m文件,下载地址magnify 2)接下来就是如何使用magnify的问题,参见使用 只是在“使用”中的第二步之前首先要用cd进入magnify所在位置.
随机推荐
- php 判断字符串中是否包含另一个字符串 strpos
strpos (PHP 4, PHP 5, PHP 7) strpos — 查找字符串首次出现的位置 说明 strpos ( string $haystack , $needle [, int $o ...
- PHP中的魔术方法总结 :__construct, __destruct , __call, __callStatic,__get, __set, __isset, __unset , __sleep
PHP中的魔术方法总结 :__construct, __destruct , __call, __callStatic,__get, __set, __isset, __unset , __sleep ...
- Spring boot 集成Kafka
搭建Kafka集群,参考: https://www.cnblogs.com/jonban/p/kafka.html 源码示例如下: 1.新建 Maven 项目 kafka 2.pom.xml < ...
- 解决ubuntu上ifconfig没有eth0/ens33且无法上网的问题
ifconfig只有一个轮回端口lo,没有我们的网卡eth0,一开始以为是vsphere(新手对于vsphere不是很熟悉)上我的虚拟机配置问题,还查看了相关的网络配置,后来才知道是因为: 问题出在配 ...
- CMDB 数据加密 最终整合API验证+AES数据加密
当CMDB运行在内网的时候,经过API验证的三关是没有问题的,但是如果运行在外网,有一个问题是,黑客截取后的访问速度比客户端快的时候还会造成数据泄露.为了解决这个问题,就要对数据进行加密 RSA加密 ...
- 解决sublime text 2总是在新窗口中打开文件(标签中打开)
在mac下不是很喜欢sublime text 2 总是在新窗口中打开文件,很麻烦,文件打多了,就会出现N多窗口,虽然可以直接打开当前目录可以解决,但有时候查看其它项目中的单个文件,就比较麻烦.百度一直 ...
- docker单主机网络
当你安装Docker时,它会自动创建三个网络.你可以使用以下docker network ls命令列出这些网络: [root@localhost ~]# docker network ls NETWO ...
- DROP OPERATOR - 删除一个操作符
SYNOPSIS DROP OPERATOR name ( lefttype | NONE , righttype | NONE ) [ CASCADE | RESTRICT ] DESCRIPTIO ...
- linux ecrypt decrypt
reference ecrypt vickey | openssl enc -aes-256-cbc -a -salt -pass pass:wu decrypt echo U2FsdGVkX1+Hn ...
- 解决cocos游戏安卓release版本闪退问题
在cocos中偶尔会遇到闪退的问题,特别是android和ios系统下的闪退就特别难处理了, 虽然说能使用xcode和eclipse显示log,但是也会出现一些特别的情况,直接闪退而且 没有任何预兆. ...