Visual Studio 2010初学者的调试指南:Mastering Debugging in Visual Studio 2010 - A Beginner's Guide
Introduction
In the software development life cycle, testing and defect fixing take more time than actually code writing. In general, debugging is a process of finding out defects in the program and fixing them. Defect fixing comes after the debugging, or you can say they are co-related. When you have some defects in your code, first of all you need to identify the root cause of the defect, which is called the debugging. When you have the root cause, you can fix the defect to make the program behavior as expected.
Now how to debug the code? Visual Studio IDE gives us a lot of tools to debug our application. Sometimes debugging activity takes a very long time to identify the root cause. But VS IDE provides a lot of handy tools which help to debug code in a better way. Debugger features include error listing, adding breakpoints, visualize the program flow, control the flow of execution, data tips, watch variables and many more. Many of them are very common for many developers and many are not. In this article, I have discussed all the important features of VS IDE for debugging like Breakpoint, labeling and saving breakpoints, putting conditions and filter on breakpoints, DataTips, Watch windows, Multithreaded debugging, Thread window, overview of parallel debugging and overview of IntelliTrace Debugging. I hope this will be very helpful for beginners to start up with and for becoming an expert on debugging. Please note, targeted Visual Studio version is Visual Studio 2010. Many things are common in older versions, but many features such as Labeling breakpoint, Pinned DataTip, Multithreaded Debugging, Parallel debugging and IntelliTrace are added in VS 2010. Please provide your valuable suggestions and feedback to improve my article.
How to Start?
You can start debugging from the Debug menu of VS IDE. From the Debug Menu, you can select "Start Debugging" or just press F5 to start the program. If you have placed breakpoints in your code, then execution will begin automatically.
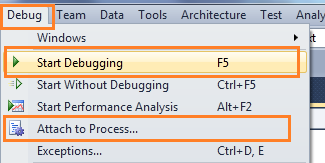
There is another way to start the debugging by "Attach Process". Attach process will start a debug session for the application. Mainly we are very much familiar with the attach process debugging for ASP.NET Web Application. I have published two different articles on the same on CodeProject. You may have a look into this.
- Debug Your ASP.NET Application that Hosted on IIS
- Remote IIS Debugging: Debug your ASP.NET Application which is hosted on "Remote IIS Server"
We generally start debugging any application just by putting breakpoint on code where we think the problem may occur. So, let’s start with breakpoints.
Breakpoints
Breakpoint is used to notify debugger where and when to pause the execution of program. You can put a breakpoint in code by clicking on the side bar of code or by just pressing F9 at the front of the line. So before keeping a breakpoint, you should know what is going wrong in your code and where it has to be stopped. When the debugger reaches the breakpoint, you can check out what's going wrong within the code by using a different debugging tool.
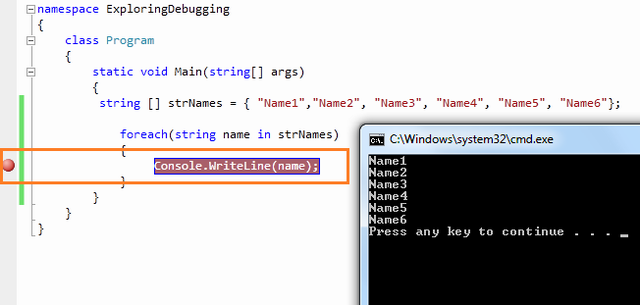
Debugging with Breakpoints
You have already set a breakpoint in your code where you want to pause the execution. And now start the program by pressing "F5". When the program reaches the breakpoint, execution will automatically pause. Now you have several options to check your code. After hitting the breakpoint, breakpoint line will show as yellow color which indicates that this is the line which will execute next.
Now you have several commands available in break mode, using which you can proceed for further debugging.

Step Over
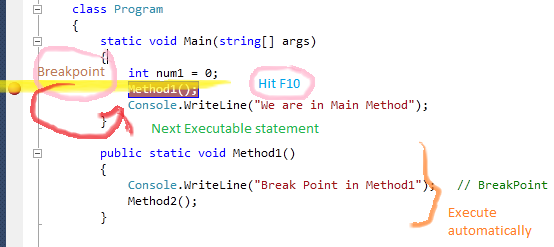
After debugger hits the breakpoint, you may need to execute the code line by line. "Step Over" [ F10 ]command is used to execute the code line by line. This will execute the currently highlighted line and then pause. If you select F10 while a method call statement is highlighted, the execution will stop after the next line of the calling statement. Step Over will execute the entire method at a time.
Step Into
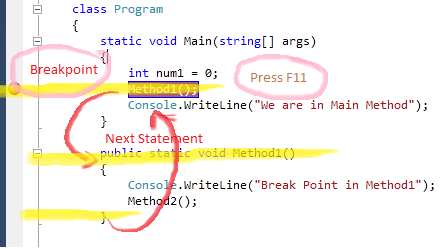
This is similar to Step Over. The only difference is, if the current highlighted section is any methods call, the debugger will go inside the method. Shortcut key for Step Into is "F11".
Step Out
This is related when you are debugging inside a method. If you press the Shift - F11 within the current method, then the execution will complete the execution of the method and will pause at the next statement from where it called.
Continue
It's like run your application again. It will continue the program flow unless it reaches the next breakpoint. The shortcut key for continue is "F5".
Set Next Statement
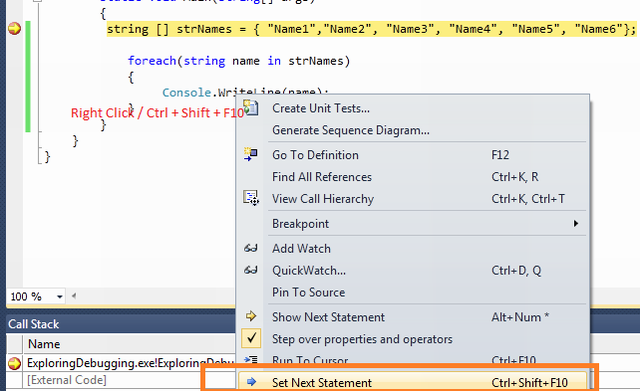
This is quite an interesting feature. Set Next Statement allows you to change the path of execution of program while debugging. If your program paused in a particular line and you want to change the execution path, go to the particular line, Right click on the line and select "Set Next Statement" from the context menu. You will see, execution comes to that line without executing the previous lines of code. This is quite useful when you found some line of code may causing breaking your application and you don’t want to break at that time. Shortcut key for Set Next Statement is Ctrl + Shift + F10.
Show Next Statement [ Ctrl+* ]
This line is marked as a yellow arrow. These lines indicate that it will be executed next when we continue the program.
Labeling in Break Point
This is the new feature in VS 2010. This is used for better managing breakpoints. It enables us to better group and filter breakpoints. It's kind of categorization of breakpoints. If you are having different types of breakpoints which are related with a particular functionality, you can give their name and can enable, disable, filter based on the requirements. To understand the whole functionality, let's assume that you have the below code block which you want to debug.
class Program

   {

       static void Main(string[] args)

       {

           string[] strNames = { "Name1", "Name2", "Name3", "Name4", "Name5", "Name6" };

           foreach (string name in strNames)

           {

               Console.WriteLine(name);   // BreakPoint

           }

           int temp = 4;

           for (int i = 1; i <= 10; i++)

           {

               if (i > 6)

                   temp = 5;

           }

       }

       public static void Method1()

       {

           Console.WriteLine("Break Point in Method1");   // BreakPoint

       }

       public static void Method2()

       {

           Console.WriteLine("Break Point in Method2");  // BreakPoint

           Console.WriteLine("Break Point in Method2");  // BreakPoint

       }

       public static void Method3()

       {

           Console.WriteLine("Break Point in Method3");  // Breakpoint

       }

   }
If you run the program, execution will pause on the first breakpoint. Now see the below picture, where you have the list of breakpoints.

In the given picture label column in blank. Now, see how you can set the label on break point and what is the use of it. To set label for any breakpoint, you just need to right click on the breakpoint symbol on the particular line or you can set it directly from breakpoint window.
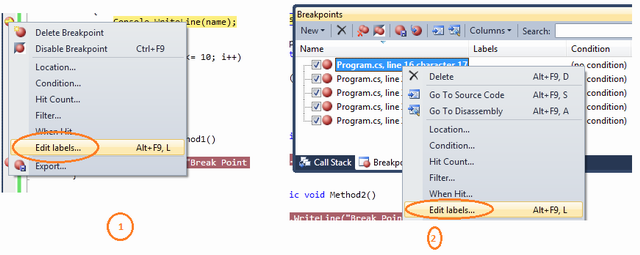
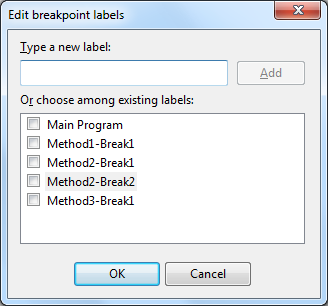
Right Click on Breakpoint, Click on the Edit Labels link, you can add the label for each and every breakpoints. As per the sample code, I have given very simple understandable names for all the breakpoints.
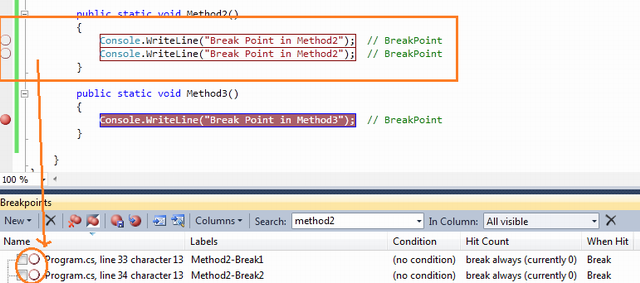
Let's have a look at how this labeling helps us during debugging. At this time, all the break points are enabled. Now if you don’t want to debug the method2, in a general case you need to go to the particular method and need to disable the breakpoints one by one, here you can filter/search them by label name and can disable easily by selecting them together.
This is all about the Breakpoint labeling. The example I have shown to you is very basic, but it is very much useful when you have huge lines of code, multiple projects, etc.
Conditional Breakpoint
Suppose you are iterating through a large amount of data and you want to debug a few of them. It means you want to pause your program on some specific condition. Visual Studio Breakpoints allow you to put conditional breakpoint. So if and only if that condition is satisfied, the debugger will pause the execution.
To do this, first of all you need to put the breakpoint on a particular line where you want to pause execution. Then just "Right Click" on the "Red" breakpoint icon. From there you just click on "Condition" .
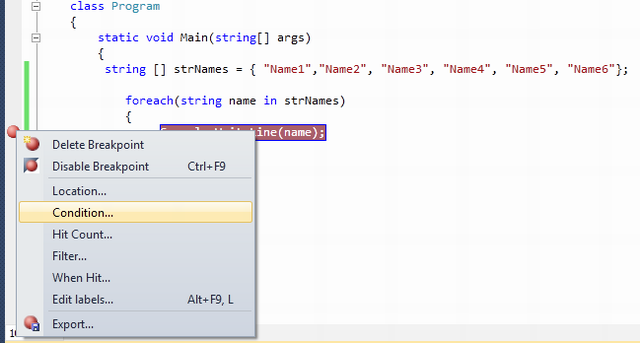
By clicking on the "Condition" link from context menu, the below screen will come where you can set the condition for breakpoints.
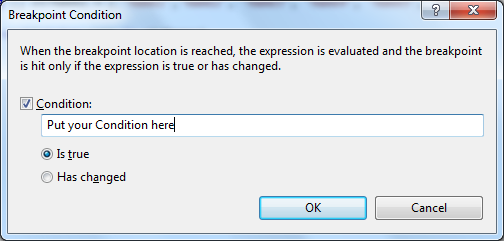
Let's assume that you have the following code block:
class Program

   {

       static void Main(string[] args)

       {

        string [] strNames = { "Name1","Name2", "Name3", "Name4", "Name5", "Name6"};

           foreach(string name in strNames)

           {

                Console.WriteLine(name); // Breakpoint is here

           }

       }

   }
You have a breakpoint on Console.WriteLine() statement. On running of the program, execution will stop every time inside that for-each statement. Now if you want your code to break only when name="Name3". What needs to be done? This is very simple, you need to give the condition like name.Equals("Name3").
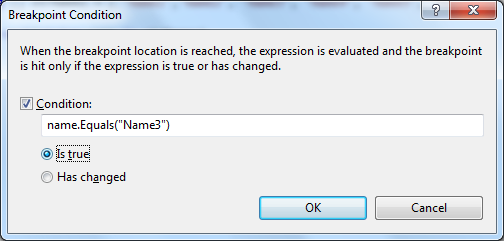
Check the Breakpoint Symbol. It should look like a plus (+) symbol inside the breakpoint circle which indicates the conditional breakpoints.

After setup of the condition of your breakpoint, if you run the application to debug it, you will see execution of program is only paused when it satisfied the given condition with breakpoint. In this case whenname="Name3".

intellisense In Condition Text Box: The breakpoint condition which I have demonstrated here is very simple and can be written easily inside condition textbox. Sometimes, you may need to specify too big or complex conditions also. For that, you do not need to worry, VS IDE provide the intellisense within the condition textbox also. So whenever you are going to type anything inside the condition box, you will feel like typing inside the editor itself. Have a look into the below picture.
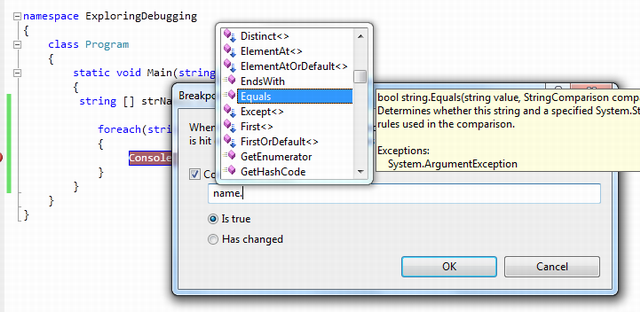
I have almost covered all about the conditional breakpoints except one thing. In condition window you have seen that there are two options available:
- Is True and
- Has Changed
We have already seen what is the use of "Is True" option. "Has changed" is used when you want to break the code if some value has changed for some particular value.
Import / Export Breakpoint
This is another interesting feature where you can save breakpoints and can use them in future. Visual Studio saves breakpoints in an XML Format. To save the breakpoints, you just need to click on the "Export" button in breakpoint window.
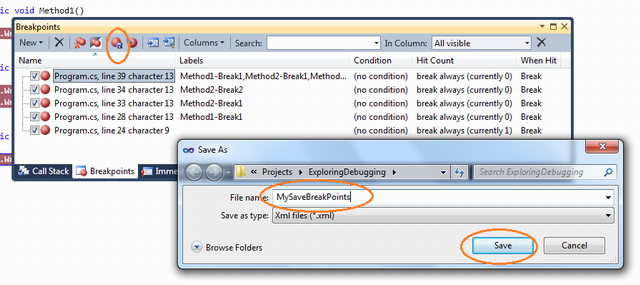
You can use the saved XML file for the future and you can pass the same to other developers. You can also save breakpoints based on the search on labels. Let's have a quick look inside the content of the XML File. The XML file is collection of BreakPoints tag within BreakpointCollection. Each breakpoints tag contains information about the particular breakpoint like line number, is enabled, etc.
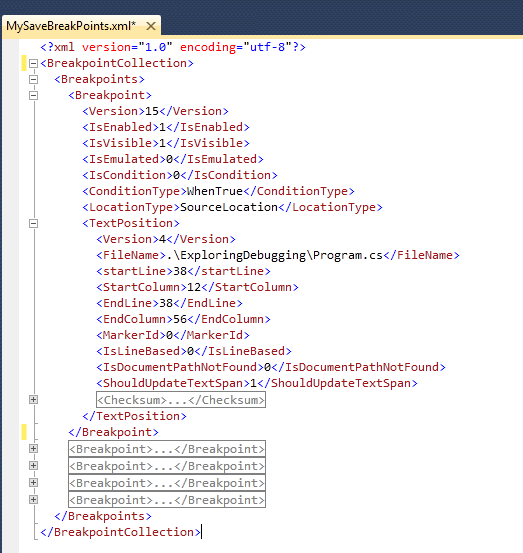
If you delete all the breakpoints from your code at any time, you can easily import them by just clicking on the "Import" breakpoints button. This will restore all of your saved breakpoints.
Note: Breakpoint Import depends on the line number where you have set your breakpoint earlier. If your line number changed, breakpoint will set on the previous line number only, so you will get breakpoints on unexpected lines.
Breakpoint Hit Count
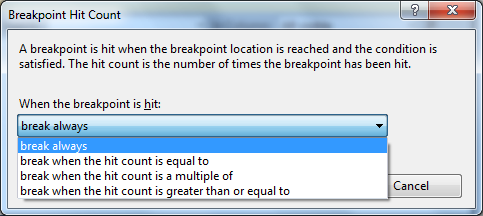
Breakpoint Hit Count is used to keep track of how many times the debugger has paused at some particular breakpoint. You also have some option like to choose when the debugger will stop. "Breakpoint Hit Count"window having the following:
- Break always
- Break when the hit count is equal to a specified number
- Break when the hit count is a multiple of a specified number
- Break when the hit count is greater than or equal to a specified number.
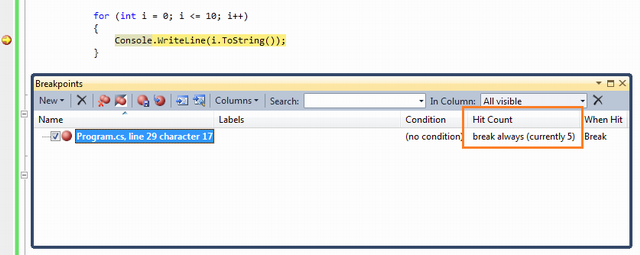
By default, it's set to always. So, whenever the breakpoints hits, hit count will increase automatically. Now we can set some condition as earlier mentioned. So based on that condition, breakpoint will hit and counter will be increased.
Let's explore it with the sample code block below:
for (int i = 0; i <= 10; i++)

{

    Console.WriteLine(i.ToString());  // Breakpoint

}
If you want your code to break when hit count is a multiple of 2, you need to select the third option from the dropdown list. After that, your code line should break only when the hit count is 2,4,6,... etc.
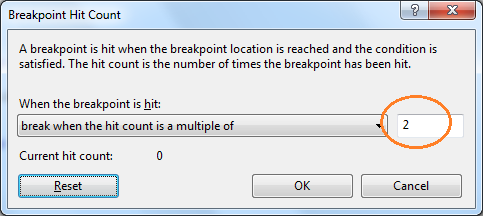
Till now, I hope you are very much clear about breakpoints, labeling, hit count, etc. Now have a look at what is "Breakpoint When Hit" option.
Breakpoint When Hit
This is apart from your normal debug steps, you want to do something else while breakpoint is hit, like print a message or run some macros. For those type of scenarios, you may go for this option. You can open this window by just right clicking on breakpoint.
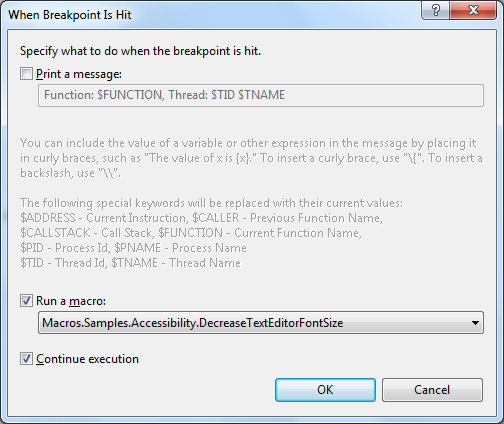
The first thing that you need to notice is the symbol of breakpoint. Breakpoint symbol has changed to a diamond and you can also check out the tool tip message which indicates what it is going to do when execution reaches here.

Breakpoint Filter
You can restrict the breakpoint to hit for certain processes or threads. This is extremely helpful while you are dealing with multithreading program. To open the filter window, you need to right click on the breakpoint and select "Filter".
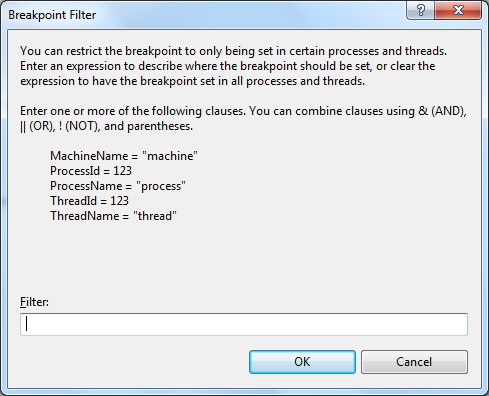
In the filter criteria, you can set the process name, Id, Machine name, Thread ID, etc. I have described it in detailed uses in Multithreading debugging section.
Data Tip
Data tip is kind of an advanced tool tip message which is used to inspect the objects or variable during the debugging of the application. When debugger hits the breakpoint, if you mouse over to any of the objects or variables, you can see their current values. Even you can get the details of some complex object like dataset,datatable, etc. There is a "+" sign associated with the dataTip which is used to expand its child objects or variables.
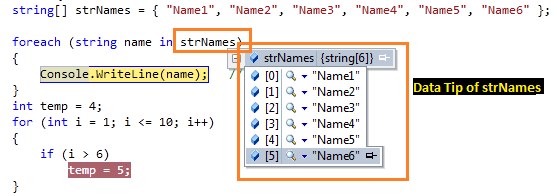
Few months ago, I published one article on VS 2010 DataTip Debugging Tips.
Here are a few cool features that you can use during debugging of your application.
Pin Inspect Value During Debugging
While debugging in Visual Studio, we generally used mouse over on the object or variable to inspect the current value. This shows the current data items held by the inspected object. But this is for a limited time, as long as the mouse is pointed to that object those value will be available. But in Visual Studio 2010 Beta 2, there is a great feature to pin and unpin this inspected value. We can pin as many of any object and their sub object value also. Please have a look into the below picture:
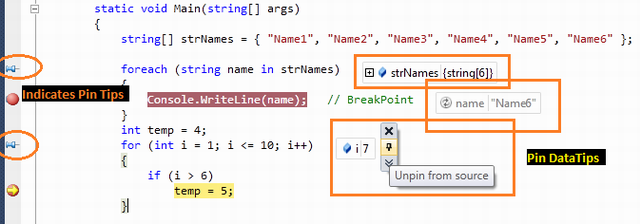
When you mouse over on the inspect object, you will get pin icon with each and every object's properties, variable. Click on that pin icon to make it pinned. Unless you manually close these pinned items, they will be visible in the IDE.
Drag-Drop Pin Data Tip
You can easily Drag and Drop the data tip inside the Visual Studio IDE. This is quite helpful when you need to see some object value list in the bottom section of code. You can easily drag those pinned data tips over there.
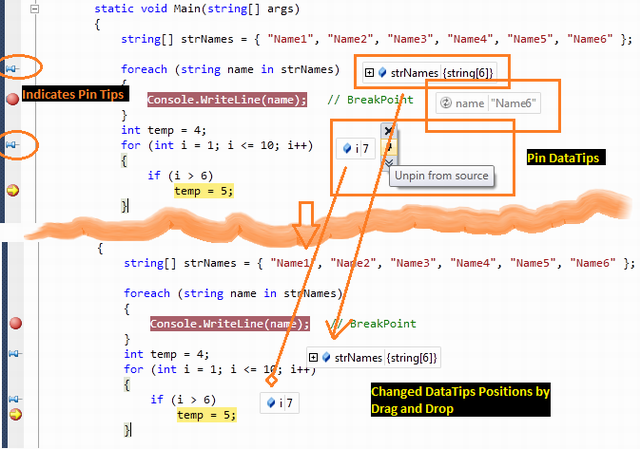
Adding Comments
You can add comments on the pinned data tip. For providing comments, you need to click on “Expand to see the comments” button. This will brings up an additional textbox to add comments.

Below is some demonstration of Adding comments on pinned inspect value:
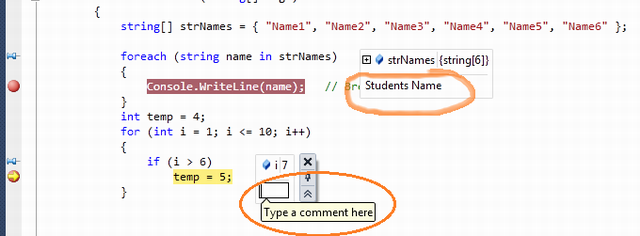
Last Session Debugging Value
This is another great feature of Visual Studio 2010 debugging. If you pinned some data tip during the debugging, the value of pinned item will remain stored in a session. In normal mode of coding, if you mouse over the pin icon, it will show the details of the last debugging session value as shown in the the below picture:

Import Export Data Tips
This feature is quite similar to the import/Export breakpoints. Like Breakpoints, you can import and export pinned data tips values in an XML file.
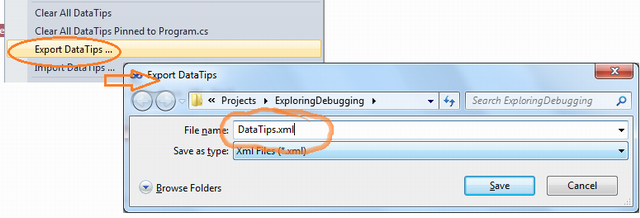
These saved data tips can be imported during any point of time for further debugging. The XML file looks like below:
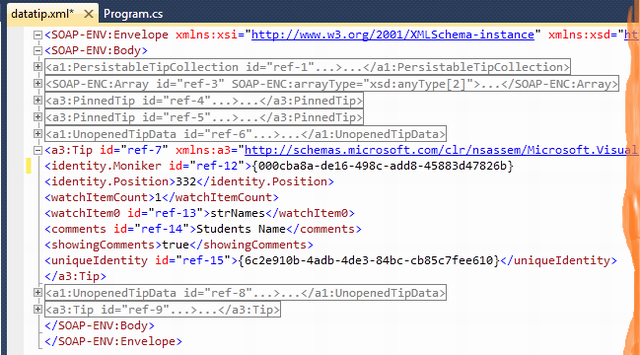
You can further explore the XML file if you want to know more details about it. 
Change Value Using Data Tips
DataTips is also used to changed the value while debugging. This means it can be used like a watch window. From the list of Pinned objects, you can change their value to see the impact on the program.

Clear Data Tips
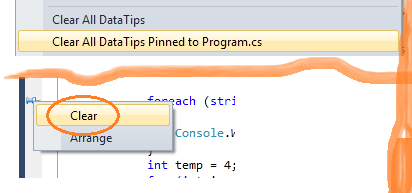
You can clear the data Tips by selecting "Clear Data Tips" from Debug menu. There are two options:
- Clear All Data Tips
- Clear All Data Tips Pinned To [ File Name.Cs ]
So if you want to clear all the Data Tips from all over your project / solution, just select the first option. But if you want to delete the pinned data tips from a particular file, then you need to open that particular file, there you have the second option to select. You can even delete particular pinned data tips by just right clicking on it and clicking "Clear".
Watch Windows
You can say it is an investigation window. After breakpoint has been hit, the next thing you want to do is to investigate the current object and variables values. When you mouse hover on the variable, it shows the information as a data tip which you can expand, pin, import which I have already explained. There are various types of watch windows like Autos, Local, etc. Let's have a look into their details.
Locals
It automatically displays the list of variables within the scope of current methods. If your debugger currently hits a particular breakpoint and if you open the "Autos" window, it will show you the current scope object variable along with the value.
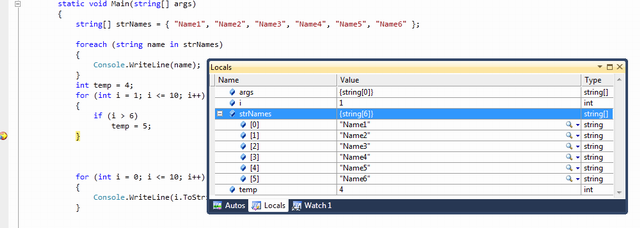
Autos
These variables are automatically detect by the VS debugger during the debugging. Visual Studio determines which objects or variables are important for the current code statement and based on that, it lists down the"Autos" variable. Shortcut key for the Autos Variable is "Ctrl + D + A".
Watch
Watch windows are used for adding variables as per requirement. It displays variables that you have added. You can add as many variables as you want into the watch window. To add variables in the watch window, you need to "Right Click" on variable and then select "Add To Watch".
You can also use Drag and Drop to add variables in watch windows. If you want to delete any variable from watch window, just right click on that variable and select "Delete Watch". From the debug window, you can also edit the variable value at run time.
There are 4 different watch windows available which you can use parallelly.
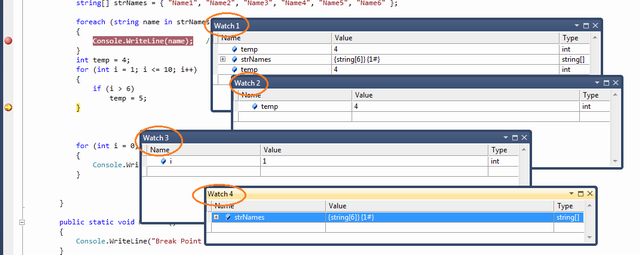
If any of the row variables of the above window holds the object instance, you can have a "+" symbol with the variable to explore the properties and member of that object variable.
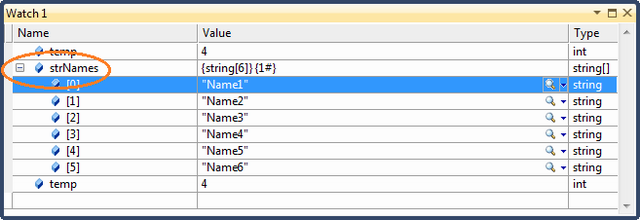
Creating Object ID
Visual Studio Debugger has another great functionality where you can create an object ID for any particular instance of object. This is very much helpful when you want to monitor any object at any point of time even if it goes out of scope. To create Object Id, from watch window you need to right click on a particular object variable and then need to click on "Make Object ID".
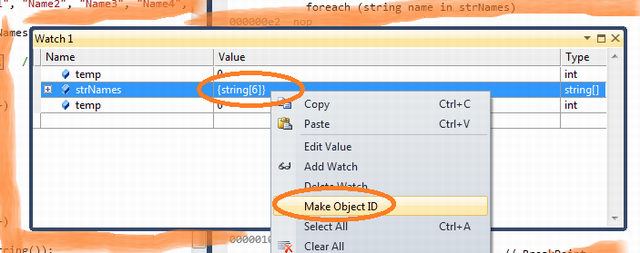
After adding Object Id with a particular object variable, Visual Studio adds a numeric number with "#" with that object to indicate that one Object ID has been created.

Immediate Window
Immediate window is very much common and a favorite with all developers. It's very much helpful in debug mode of the application if you want to change the variable values or execute some statement without impacting your current debugging steps. You can open the Immediate window from menu Debug > Window > Immediate Window {Ctrl + D, I / Alt + Ctrl - I }. Immediate window has a set of commands which can be executed any time during debugging. It also supports Intellisense. During Debug mode, you can execute any command or execute any code statement from here.
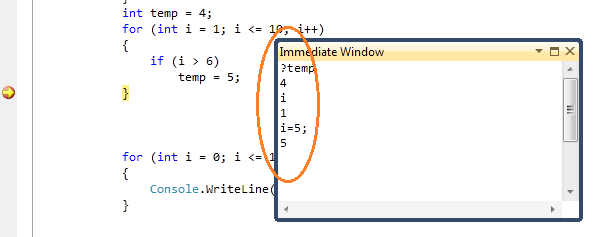
These are very much common features for all the developers, so I am not going into details of each and every command of Immediate window.
Call Stack
These features also improve the productivity during debugging. If you have multiple method calling or nested calling all over your application and during debugging, you want to check from where this method has invoked,"Call Stack" comes into the picture. The Call Stack Window shows that current method call nesting. 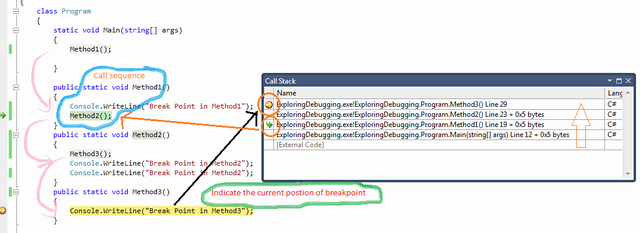
In Call Stack window if you clicked on any of the rows, it will point you to the actual code of line of Visual Studio Code Editor. You can also customize the call stack row view by selecting different types of columns. To customize, Right Click on the "Call Stack" window, and from the context menu, you can select or deselect the option.
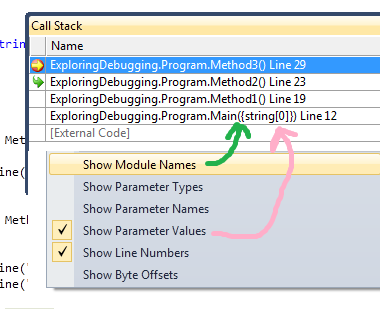
Call stack is very much important when you have multiple methods call all across the application and one particular method throwing an exception on some particular case. At that time, you can use call stack to see from where this method is getting invoked, based on that you can fix the defect.
Debugging Multithreaded Program
As of now, what I have discussed is all about fundamentals of debugging, knowing debugging tools and their uses. Now let's have a look into the multithreaded scenarios. Here you will see how to work with multithreaded program debugging, where is your current thread, what is the thread execution sequence, what is the state of thread. Before continuing with the demo, let's consider you have the following piece of code which you want to debug.
class ThreadTest

   {

       static void Main()

       {

           Thread t = new Thread(new ThreadStart(Go));

           t.Name = "Thread 1";

           Thread t1 = new Thread(new ThreadStart(Go));

           t1.Name = "Thread 2";

           t.Start();

           t1.Start();

           Go();

       }

       static void Go()

       {

           Console.WriteLine("hello!");

       }

   }
In the sample code, you have three different threads - Main Thread, Thread 1, Thread 2. I have given a thread name to make you understand better. Now set a breakpoint inside "Go()" and run the application. When debugger hits the breakpoint, Press Ctrl+D,T or Navigate through Debug > Window > Threads. Threads window will appeared on the screen.
Exploring Threads Window
After selecting the thread window from debug menu, the following screen will come:
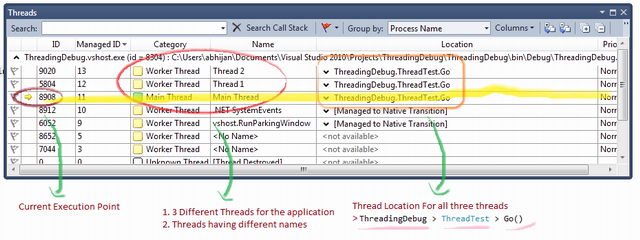
By default thread window having ID, Managed ID, Category, Name, Location and Priority column. At the start, execution pauses at "Main Thread". "Yellow Arrow" indicates the current executable thread. Category column indicates the category of threads, like main thread or worker thread. If you check the thread location, it is nothing but Namespace > Class > Method name. In the diagram, it is showing that the Main Thread will be executed next. Now to explore the next step by just pressing "F5" and see what are the changes in thread window.

So after pressing F5, it jumped to the next step to thread 1. you can also check the current location for Main Thread. It says "Sleep/ Wait / Join" , means waiting for something to complete. Similarly the next step will move you to thread 2. From the Thread window, you can understand how easy it is to monitor your threads using this debugger tool.
There is another great feature available within the thread window. You can expand/collapse the Thread Location and can see what is next. For example, if you expand the location for "Main Thread", it will look like the diagram given below:

Flag Just My Code
The sample code which I have explained for the thread debugging is very simple. What will happen if you have a huge code block with multiple number of threads. Then it will be very difficult for you to identify which thread is part of your code or which ones are not related. Thread window gives you very easy features to set the "Flag" for all the threads which are part of your code. For that, you need to just flag your thread by option "Flag Just My Code".

Break Point Filter - Multithread Debugging
While discussing about breakpoint filter in breakpoint section, I said that breakpoint filter is very much helpful for Multithreaded debugging mode. Now this is the time to explore it. In our current example, we have three threads Main Thread, Thread1 and Thread 2. Now what if you want breakpoint to hit only for "Thread 2". What will you do ? Here is the use of breakpoint filter. Right click on the breakpoint, select "Filter" from the context menu. Now in breakpoint filter window, you need to fill the filter criteria. As per your requirement, you need to specify "ThreadName="Thread 2" .
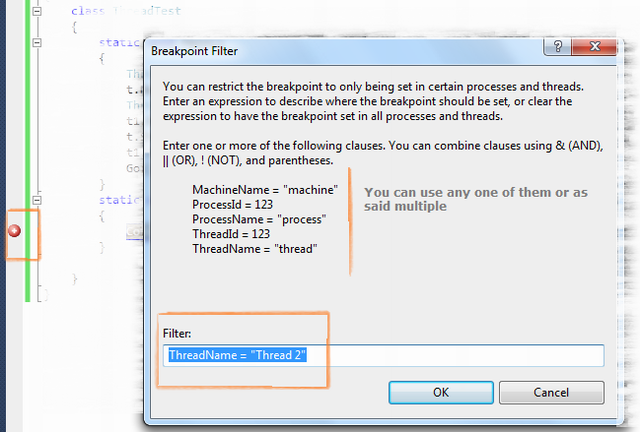
Here ThreadName was one of the criteria by which you can filter, but you can filter on multiple clauses likeThreadID, ProcessName, ProcessID, etc. After setting the breakpoint filter, run the application and open the "Threads" window.
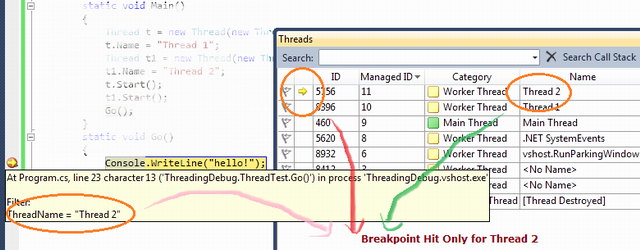
You will find your program execution has only paused during the execution of "Thread 2" .
This is all about the debugging with multithreaded application. Hope you have learned something from it. Let's start with another most important topic "Parallel Debugging".
Debugging Parallel Program
This is another great feature added to Visual Studio 2010 to debug parallel program. Parallel programming is the new feature coming with .NET 4.0. If you want to learn more about parallel programming, please checkhere.
Now Debugging the parallel program is also a big topic. Here I will give you a basic overview to know about the debugging of parallel program. To discuss about it, let's consider you have the following piece of code:
using System;

using System.Collections.Generic;

using System.Linq;

using System.Text;

using System.Threading;

using System.Threading.Tasks;

namespace ParalleTaskDebugging

{

    class Program

    {

        static void Main(string[] args)

        {

            var task_a = Task.Factory.StartNew(() => DoSomeWork(10000));

            var task_b = Task.Factory.StartNew(() => DoSomeWork(5000));

            var task_c = Task.Factory.StartNew(() => DoSomeWork(1000));

            Task.WaitAll(task_a, task_b, task_c);

        }

        static void DoSomeWork(int time)

        {

               Thread.Sleep(time);

        }

    }

}
To understand the parallel program debugging, we need to be aware about two window options:
- Parallel Tasks
- Parallel Stacks
Parallel Task and Parallel Stacks
Before continuing with parallel tasks and parallel stacks, you have to know about Threads Window which I have already covered. In the given code, you have three different tasks which are doing something and after sometime, all the tasks are put on hold. This is done intentionally to check the status of each task. To test, put a breakpoint on DoSomeWork() method and run the application. You will see your program execution paused on the breakpoint. After the program break, you can go to Debug > Window > Open Parallel Tasks andParallel Stacks window. I asked to open both at the same time only because you can visualize what is going on.

Parallel Task window will show you what are the different tasks that have been created for the program and what is their current status. On the other hand, Parallel Stacks will show you the graphical view of all thread creation, containing tasks, how they are related. If you click on the thread from the Parallel Stacks, it will show you the code line related with the thread (as shown in the picture with a Green Arrow). To move ahead, press F5. Let's see what comes next.
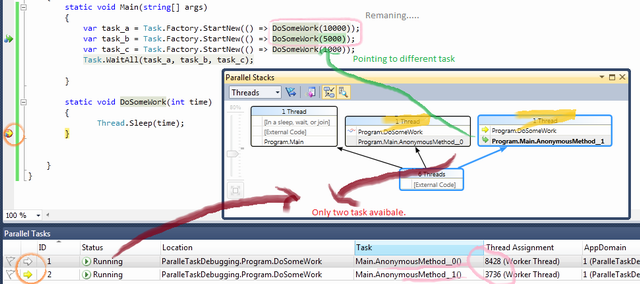
In the above diagram, you can find one of the tasks has been executed and the other two are remaining. Current execution point is set to AsyncMethod_1, so if you continue, this method will execute first and next time the others. When you are working with parallel programming, there are many scenarios which will come like Deadlock, Dependency problem, etc. These topics is very interesting and long to discuss. Please check further study section of the article to know more details.
Debugging with IntelliTrace - Overview
This is another great feature of Visual Studio 2010 IDE. IntelliTrace Debugging is sometimes called as historical Debugging. IntelliTrace operates in the background, records what you are doing during debugging. When you want the information of previous event or some particular event, you can easily get it from intelliTrace information, a past state of your application. In this mode, you can navigate to various events, steps that are recorded. In this section, I will give you a basic overview of how to use IntelliTrace.
Here I am using one sample program by which I will show you what IntelliTrace does. Below is the sample code block:
class Program

    {

        static void Main(string[] args)

        {

            Console.WriteLine("IntelliTrackerTest");

            CallTestMethod(5);

        }

        public static void CallTestMethod(int TestValue)

        {

            Console.WriteLine("In CallTestMethod : " + TestValue.ToString());

            Console.WriteLine("Last Statement....");

        }

    }
Run the program and Open IntelliTrace window from Debug menu, you will find the below screen added in the right hand side of Visual Studio.
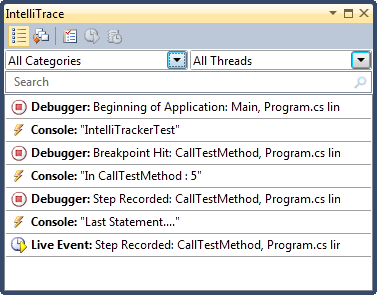
Mapping with IntelliTrace
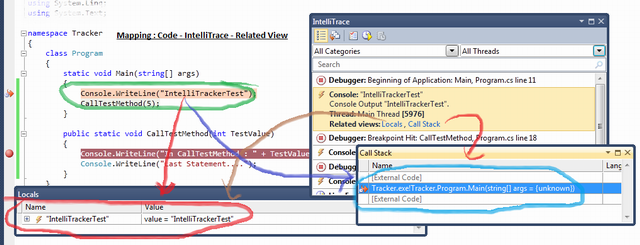
Did you find any relationship with your code and with the IntelliTracker List view? I guess you should. If not, let me explain about it. Let's have a look into the below picture:

From the picture, I am sure you have got the idea what IntelliTrace is doing. Yes, exactly itsrecords/capture what your code is doing. If you call a method, it will capture. If code fired an event, it will trap. Yes at a single statement, I will capture each and everything.
Now from the IntelliTrace window, you can navigate your code with any part and see what’s happened internally. If you can get the call stack, Local variables information are recorded. To navigate, just click any of the events that you want to explore, that block will automatically expand.

When you will select any block, it will expand automatically and that line will be highlighted. As per the given picture, I have highlighted the first console section and you can see the corresponding code block has also been highlight. You can now easily map them. In the expanded block (Light Orange), there are two Related View Sections Locals and Stack Call. I have already explained Locals and Stack Calls. But can you imagine what is the use of Locals and Call Stack over here. Yes, you guessed it correctly, it will show you the Locals and Call Stack status for that time period when the selected block has been executed. What a nice feature this is.
Filter IntelliTrace Data
If you have a lot of recorded information in the intellitrace window, you can easily filter them out. You can filter data based on the Categories or Thread. As for example suppose you want to see only the data that is related with Console Related, you just need to check the "Console" From categories list.

Note: By default, Visual Studio stored IntelliTrace information in "\Microsoft Visual Studio\10.0\TraceDebugging" Location in a iTrace file. You may change the location.
Debugging with IntelliTrace is itself a big topic. So it is very much difficult for me to cover them up within this article. I just give you the basic overview so that you can at least explore it by yourself now. Please check the further study section to know more about it.
Useful Shortcut Key For VS Debugging
| Shortcut Keys | Descriptions |
| Ctrl-Alt-V, A | Displays the Auto window |
| Ctrl-Alt-B | Displays the Breakpoints dialog |
| Ctrl-Alt-C | Displays the Call Stack |
| Ctrl-Shift-F9 | Clears all of the breakpoints in the project |
| Ctrl-F9 | Enables or disables the breakpoint on the current line of code |
| Ctrl-Alt-E | Displays the Exceptions dialog |
| Ctrl-Alt-I | Displays the Immediate window |
| Ctrl-Alt-V, L | Displays the Locals window |
| Ctrl-Alt-Q | Displays the Quick Watch dialog |
| Ctrl-Shift-F5 | Terminates the current debugging session, rebuilds if necessary, and starts a new debugging session. |
| Ctrl-F10 | Starts or resumes execution of your code and then halts execution when it reaches the selected statement. |
| Ctrl-Shift-F10 | Sets the execution point to the line of code you choose |
| Alt-NUM * | Highlights the next statement |
| F5 | If not currently debugging, this runs the startup project or projects and attaches the debugger. |
| Ctrl-F5 | Runs the code without invoking the debugger |
| F11 | Step Into |
| Shift-F11 | Executes the remaining lines out from procedure |
| F10 | Executes the next line of code but does not step into any function calls |
| Shift-F5 | Available in break and run modes, this terminates the debugging session |
| Ctrl-Alt-H | Displays the Threads window to view all of the threads for the current process |
| F9 | Sets or removes a breakpoint at the current line |
| Ctrl-Alt-W, 1 | Displays the Watch 1 window to view the values of variables or watch expressions |
| Ctrl-Alt-P | Displays the Processes dialog, which allows you to attach or detach the debugger to one or more running processes |
| Ctrl-D,V | IntelliTrace Event |
I am stopping here. Hope you have enjoyed the full article. Please share your feedback and suggestions.
Further Study
- Debugging Task-Based Parallel Applications in Visual Studio 2010 By Daniel Moth and Stephen Toub
- Debugging With IntelliTrace
Summary
This article covers basic fundamentals of debugging procedure. It describes how to debug an application using VS IDE. I have explained almost all important tools and their uses. For Parallel program debugging, I have covered only basics. In further study section, there is a great article on Parallel debugging procedure. If you are interested, please go through the link. My main objective was to cover almost all utilities that are available in Visual Studio debugging. Hope you have learned something new from this article.
Please share your valuable feedback and suggestions to improve this.
History
- 6th May, 2010: Initial post
License
This article, along with any associated source code and files, is licensed under The Code Project Open License (CPOL)
from: http://www.codeproject.com/Articles/79508/Mastering-Debugging-in-Visual-Studio-2010-A-Beginn
Visual Studio 2010初学者的调试指南:Mastering Debugging in Visual Studio 2010 - A Beginner's Guide的更多相关文章
- Visual Studio 2010无法启动调试
现象:Visual Studio 2010点击调试或者按F5.Visual Studio 2010没有什么反应,但又不报错. 而点击运行不调试(Ctrl+F5)却没有问题. 解决的方法:打开项目属性, ...
- VS2010调试 --指南 Reference from : http://blog.csdn.net/kingzone_2008/article/details/8133048
1 导言 在软件开发周期中,测试和修正缺陷(defect,defect与bug的区别:Bug是缺陷的一种表现形式,而一个缺陷是可以引起多种Bug的) 的时间远多于写代码的时间.通常,debug是指发现 ...
- 《Visual C++ 2010入门教程》系列一:关于Visual Studio、VC和C++的那些事
原文:http://www.cnblogs.com/Mrt-02/archive/2011/07/24/2115606.html 作者:董波 日期:2010.6.15 写在前面 在我还在上学的时候,我 ...
- 2.[WP Developer体验Andriod开发]Andriod Studio结合Visual Studio Emulator for Android调试Android App
0. 工欲善其事必先利其器 上一篇博客对比了一下Android和WinPhnoe的布局容器,后续篇章重点放在Android的开发上了. 说到开发就绕不开调试程序,调试Android App我们有2种选 ...
- Visual Studio 2017 通过SSH 调试Linux 上.NET Core
Visual Studio 2017 通过SSH 调试Linux 上.NET Core 应用程序. 本文环境 开发环境:Win10 x64 Visual Studio 2017 部署环境:Ubuntu ...
- 2.[Andriod]Andriod Studio结合Visual Studio Emulator for Android调试Android App
0. 工欲善其事必先利其器 上一篇博客对比了一下Android和WinPhnoe的布局容器,后续篇章重点放在Android的开发上了. 说到开发就绕不开调试程序,调试Android App我们有2种选 ...
- VS2015--win32project配置的一些想法之在 Visual Studio 2015 中进行调试的同一时候分析性能
出处: https://msdn.microsoft.com/zh-cn/magazine/dn973013(en-us).aspx 很多开发商花了绝大多数时间获取应用程序才干正常发挥作用.更少的时间 ...
- SharePoint 2010 开发人员学习指南
kaneboy 翻译,一切内容版权归 Microsoft.1. SharePoint 开发起步教程 这是一个为准备进入到 SharePoint 开发领域的 .NET 开发人员所准备的免费在线学习课程. ...
- visual Studio 2017 扩展开发(一)《向Visual Studio菜单栏新增一个菜单》
最近有接触到关于visual studio 2017 扩展的开发,特此记录,也是为了督促自己去深入了解其原理. 开始开发Visual Studio 扩展,在这里我安装了visual studio 20 ...
随机推荐
- 【BZOJ】1975: [Sdoi2010]魔法猪学院
题意 \(n(2 \le n \le 5000)\)个点,找尽量多的不同\(1\)到\(n\)的路径,每一次的花费就是路径的全值和,要求在费用不超过\(E\)的情况下路径最多. 分析 裸的最段路. 题 ...
- 【BZOJ1003】1003: [ZJOI2006]物流运输trans SPFA+DP
Description 物流公司要把一批货物从码头A运到码头B.由于货物量比较大,需要n天才能运完.货物运输过程中一般要转停好几个码头.物流公司通常会设计一条固定的运输路线,以便对整个运输过程实施严格 ...
- Android在智能终端领域的关键技术专题讲座(成都站)
Android系统引领了终端智能化的浪潮,在民用.公 共及工业等诸多领域得到了广泛的应用,涉及手持终端.电视.汽车导航.工业控制等,在云计算.设备智能化等方面表现卓越.Android也凭借着自身的优 ...
- docker 练习
echo 'DOCKER_OPTS="-b=bridge0"' >> /etc/default/docker sudo docker run -i -t centos ...
- 向linux内核中添加外部中断驱动模块
本文主要介绍外部中断驱动模块的编写,包括:1.linux模块的框架及混杂设备的注册.卸载.操作函数集.2.中断的申请及释放.3.等待队列的使用.4.工作队列的使用.5.定时器的使用.6.向linux内 ...
- 使用forever管理nodejs应用
1. forever介绍 forever是一个简单的命令式nodejs的守护进程,能够启动,停止,重启App应用.forever完全基于命令行操作,在forever进程之下,创建node的子进程,通过 ...
- 【hihoCoder】1049.后序遍历
问题:http://hihocoder.com/problemset/problem/1049?sid=767510 已知一棵二叉树的前序遍历及中序遍历结果,求后序遍历结果 思路: 前序:根-左子树- ...
- django1.9 创建数据表
1.在setting.py 中注册app: 2.编写models.py 文件创建表结构: (生成的表默认是: app名称_定义的表面 ) 3.执行命令: python manage.py check ...
- 使用 GCC 调试程序
系统 Ubuntu 调试示例: #include <stdio.h> int func(int n) { ,i; ;i<n;i++) { sum+=i; } return sum; ...
- 牛人整理分享的面试知识:操作系统、计算机网络、设计模式、Linux编程,数据结构总结 转载
基础篇:操作系统.计算机网络.设计模式 一:操作系统 1. 进程的有哪几种状态,状态转换图,及导致转换的事件. 2. 进程与线程的区别. 3. 进程通信的几种方式. 4. 线程同步几种方式.(一定要会 ...
