H5实现图表和地图
H5实现图表和地图的代码如下:
 <!DOCTYPE html>

 <html>

     <head>

         <title>图表和地图</title>

         <meta name="viewport" content="width=device-width, initial-scale=1.0, maximum-scale=1.0, minimum-scale=1.0, user-scalable=no" />

         <style type="text/css">

             html,body{

                 width:100%;

                 height:100%;

             }

             *{

                 margin:0px;

                 padding:0px;

             }

             body, button, input, select, textarea {

                 font: 12px/16px Verdana, Helvetica, Arial, sans-serif;

             }

             p{

                 width:603px;

                 padding-top:3px;

                 overflow:hidden;

             }

             .btn{

                 width:142px;

             }

             #container{

                 width:100%;

                 height:300px;

             }

         </style>

     </head>

     <body>

         <div id="main" style="width: 100%;height:400px;"></div>

         <div id="container"style="margin-bottom: 50px"></div>

         <script type="text/javascript" src="asset/js/jquery-2.2.4.js"></script>

         <script type="text/javascript" src="asset/js/echarts.min.js"></script>

         <script charset="utf-8" src="https://map.qq.com/api/js?v=2.exp&key=IZJBZ-PAUKF-YQOJ6-JM4TR-T3RT5-N6BM5"></script>

         <script charset="utf-8" src="https://map.qq.com/api/js?v=2.exp&key=IZJBZ-PAUKF-YQOJ6-JM4TR-T3RT5-N6BM5&libraries=drawing,geometry,place,convertor,visualization"></script>

         <script type="text/javascript">

         // 基于准备好的dom,初始化echarts实例

         var myChart = echarts.init(document.getElementById('main'));

         // 指定图表的配置项和数据

         myChart.setOption({

                 xAxis: {

                   type: 'category',

                   data: [1,2,3,4,5],

                   axisLabel:{

                     textStyle:{

                       fontSize:8

                     }

                   }

                 },

                 yAxis: {

                   type: 'value',

                   axisLabel:{

                     formatter:'{value}℃',

                     textStyle:{

                       fontSize:8

                     }

                   }

                 },

                 series: [

                   {

                     data: [20,30,50,60,30],

                     type: 'line',

                     smooth: true,

                     symbol: 'none',//去掉小圆点

                     itemStyle: {

                       normal: {

                         color: '#537FE2',

                         lineStyle: {

                           color: '#537FE2'

                         }

                       }

                     }

                   },

                   {

                     data: [10,10,10,10,10],

                     type: 'line',

                     smooth: false,

                     symbol: 'none',//去掉小圆点

                     itemStyle:{

                       normal:{

                         lineStyle:{

                           width:2,

                           type:'dotted',  //'dotted'虚线 'solid'实线

                           color:'#2BB4DF'

                         }

                       }

                     }

                   },

                   {

                     data: [60,60,60,60,60],

                     type: 'line',

                     smooth: false,

                     symbol: 'none',//去掉小圆点

                     itemStyle:{

                       normal:{

                         lineStyle:{

                           width:2,

                           type:'dotted',  //'dotted'虚线 'solid'实线

                           color:'#2BB4DF'

                         }

                       }

                     }

                   },

                 ],

               })

       </script>

       <script>

         window.onload = function(){

         //直接加载地图

         //初始化地图函数  自定义函数名init

         function init() {

             //定义map变量 调用 qq.maps.Map() 构造函数   获取地图显示容器

             var map = new qq.maps.Map(document.getElementById("container"), {

                 center: new qq.maps.LatLng(39.910,116.399),  // 地图的中心地理坐标。

                 zoom:14//地图的中心地理坐标。

             });

             var polyline = new qq.maps.Polyline({

                 path: [

                     new qq.maps.LatLng(39.915, 116.399),

                     new qq.maps.LatLng(39.920, 116.389),

                     new qq.maps.LatLng(39.930, 116.399)

                 ],

                 strokeColor: '#000000',

                 strokeWeight: 2,

                 map

             });

             var marker = new qq.maps.Marker({

                 position: new qq.maps.LatLng(39.920,116.380),

                 map: map,

             });

                var anchor = new qq.maps.Point(0, 39),

                   size = new qq.maps.Size(42, 68),

                   origin = new qq.maps.Point(0, 0),

                   markerIcon = new qq.maps.MarkerImage(

               "https://3gimg.qq.com/lightmap/api_v2/2/4/99/theme/default/imgs/marker.png",

               size,

               origin,

               anchor

             );

             marker.setIcon(markerIcon);

         }

         //调用初始化函数地图

         init();

         }

         </script>

     </body>

 </html>
手机端效果图如下:
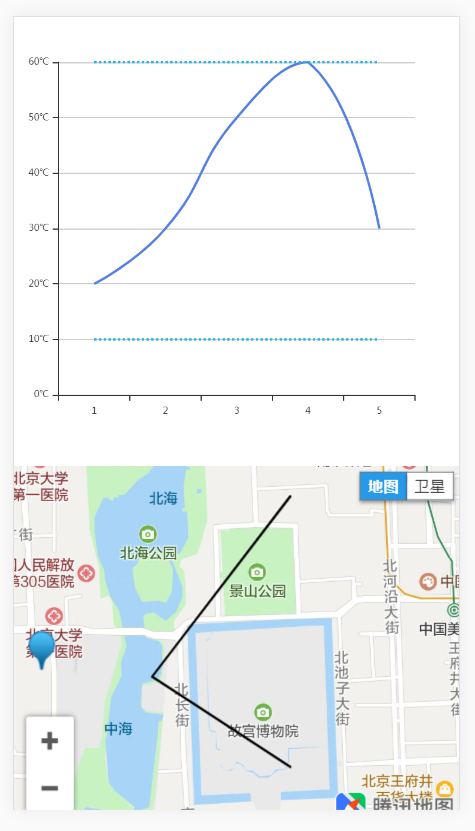
我们对以上代码进行分析,
图表使用了echarts,引入了echarts.min.js。
地图用的是腾讯地图,引用了线上的两个库。
 <script charset="utf-8" src="https://map.qq.com/api/js?v=2.exp&key=IZJBZ-PAUKF-YQOJ6-JM4TR-T3RT5-N6BM5"></script>

 <script charset="utf-8" src="https://map.qq.com/api/js?v=2.exp&key=IZJBZ-PAUKF-YQOJ6-JM4TR-T3RT5-N6BM5&libraries=drawing,geometry,place,convertor,visualization"></script>
图表是折线图,设置好x轴(xAxis)的数据,
 xAxis: {

   type: 'category',

   data: [1,2,3,4,5],

   axisLabel:{

     textStyle:{

       fontSize:8

     }

   }

 },
在formatter里设置y轴的单位,
 yAxis: {

   type: 'value',

   axisLabel:{

     formatter:'{value}℃',

     textStyle:{

       fontSize:8

     }

   }

 },
然后设置y轴(yAxis)的数据。
 series: [

   {

     data: [20,30,50,60,30],

     type: 'line',

     smooth: true,

     symbol: 'none',//去掉小圆点

     itemStyle: {

       normal: {

         color: '#537FE2',

         lineStyle: {

           color: '#537FE2'

         }

       }

     }

   },

   {

     data: [10,10,10,10,10],

     type: 'line',

     smooth: false,

     symbol: 'none',//去掉小圆点

     itemStyle:{

       normal:{

         lineStyle:{

           width:2,

           type:'dotted',  //'dotted'虚线 'solid'实线

           color:'#2BB4DF'

         }

       }

     }

   },

   {

     data: [60,60,60,60,60],

     type: 'line',

     smooth: false,

     symbol: 'none',//去掉小圆点

     itemStyle:{

       normal:{

         lineStyle:{

           width:2,

           type:'dotted',  //'dotted'虚线 'solid'实线

           color:'#2BB4DF'

         }

       }

     }

   },

 ],
可以画出多条折线,并设置颜色、虚实线、是否加上小圆点等状态。
地图则可以设置中心坐标,
 //定义map变量 调用 qq.maps.Map() 构造函数   获取地图显示容器

 var map = new qq.maps.Map(document.getElementById("container"), {

     center: new qq.maps.LatLng(39.910,116.399),  // 地图的中心地理坐标。

     zoom:14//地图的中心地理坐标。

 });
并根据多个点的坐标画出路径线(polyline),
 var polyline = new qq.maps.Polyline({

     path: [

         new qq.maps.LatLng(39.915, 116.399),

         new qq.maps.LatLng(39.920, 116.389),

         new qq.maps.LatLng(39.930, 116.399)

     ],

     strokeColor: '#000000',

     strokeWeight: 2,

     map

 });
然后可以设置标记(marker)的位置和更换标记的图标。
 var marker = new qq.maps.Marker({

     position: new qq.maps.LatLng(39.920,116.380),

     map: map,

 });

      var anchor = new qq.maps.Point(0, 39),

       size = new qq.maps.Size(42, 68),

       origin = new qq.maps.Point(0, 0),

       markerIcon = new qq.maps.MarkerImage(

   "https://3gimg.qq.com/lightmap/api_v2/2/4/99/theme/default/imgs/marker.png",

   size,

   origin,

   anchor

 );

 marker.setIcon(markerIcon);
代码示例地址:https://github.com/LuoYiHao/chart-and-map。
H5实现图表和地图的更多相关文章
- AGS API for JavaScript 图表上地图
原文:AGS API for JavaScript 图表上地图 图1 图2 图3 -------------------------------------华丽丽的分割线--------------- ...
- uniapp H5引入腾讯地图
在网上搜索了许多关于uniapp引入腾讯地图的方法都以失败告终,我开发的应用主要使用于H5,小程序与H5是不同的sdk,就不在这说了,况且小程序有手把手教学,可参考腾讯地图官网https://lbs. ...
- H5微信通过百度地图API实现导航方式二
要有服务器才行哦 <!DOCTYPE html><html><head> <meta http-equiv="Content-Type&quo ...
- H5微信通过百度地图API实现导航方式一
根据业务需求修改百度API,实现微信中的导航功能.因为源码中SearchInfoWindow_min.js有点小问题(部分小城市公交线路少,查不到路线时没有提示),所以这里在源码的基础上改了一点点.可 ...
- 微信H5页面嵌入百度地图---解决手机的webKit定位,ios系统对非https网站不提供支持问题
<script type="text/javascript" src="http://api.map.baidu.com/api?v=2.0&ak=yGQt ...
- H5调用腾讯地图
获取当前定位的经纬度并在容器内显示当前位置 (安卓上的位置有点偏差) 在vue的index.html中需要引用 template <div id="container" st ...
- H5页面,百度地图点击事件
需求:用户点击地图的时候获取地址街道,编码等详细信息. 然后看百度API文档,看到了click事件,关键时候还是需要看文档的. 实现 这样子虽然在浏览器的手机模拟器下是没有问题的 但是放在机器上测试的 ...
- h5跳转高德地图
<a href="https://uri.amap.com/marker?position=经度,纬度&name=所在的位置名称">高德地图</a>
- h5画图表
折线: <!DOCTYPE html><html lang="en"><head> <meta charset="UTF-8&q ...
随机推荐
- Spring boot 官网学习笔记 - 开发第一个Spring boot web应用程序(使用mvn执行、使用jar执行)
Creating the POM <?xml version="1.0" encoding="UTF-8"?> <project xmlns= ...
- Hibernate教程 ---简单易懂
1 web内容回顾 (1)javaee三层结构 (2)mvc思想 2 hibernate概述 3 hibernate入门案例 4 hibernate配置文件 5 hibernate的api使用 Hib ...
- .net core 3.0 Signalr - 09 待改进&交流
## 个人心得 写博客真的比写代码累,膜拜那些坚持写博客的大佬! 有时候零散的片段比较多,没写之前感觉有千千万万要写的东西,实际写的时候发现, 好像这个没啥说的,然后就帖了个图,或者一笔带过了 ## ...
- One layer SoftMax Classifier, "Handwriting recognition"
import lib needed¶ In [1]: from PIL import Image import numpy as np import matplotlib.pyplot as ...
- 针对永久不过期的key 批量设置过期时间
问题需求: redis内存暴增,后来发现有很多设置永久不过期. 解决:查找出来之后针对前缀批量设置过期时间 (过期时间与开发沟通 保证服务不受影响) 来源于网上杨一的代码 正好解决了我遇到的问题 在这 ...
- Go语言入门教程(十一)
原创: IT干货栈 Hello,各位小伙伴大家好,我是小栈君,昨天讲了关于go语言的函数的定义和自定函数的部分种类,我们今天接着上期所讲的内容继续进行分享. 一.函数之无参有返回值 有返回值的函数,必 ...
- Windows搭建SVN服务器
安装 1.下载地址:https://www.visualsvn.com/files/VisualSVN-Server-4.0.3-x64.msi 2.开始安装: 3.安装配置: 4.Next直到完成 ...
- e课表项目第二次冲刺周期第一天
昨天干了什么? 昨天与我们小组的成员商量了一个重大的决定,由于我们第一次冲刺周期的成果,就是我们决定我们要转型发展. 今天干了什么? 查阅相关的资料,我们正式决定要做一款学习的课程表APP,把简易作为 ...
- 合并果子(STL优先队列)
STL优先队列:priority_queue 定义:priority_queue<int>q; 从小到大:priority_queue<int,vector<int>,g ...
- Vue-CLI 项目在pycharm中配置
Vue-CLI Vue-CLI 项目在pycharm中配置 第一步 pycharm索引到vue项目的根目录,打开 第二步 安装vue.js插件来高亮 .vue 文件代码(见插图) 第三步 第四步 配置 ...