PhpStorm/Xdebug安装使用
安装环境:XAMPP;phpStorm版本10; windows 7 64bit。
XAMPP、phpStorm 都直接安装在了D盘根目录,9999m目录建在D:\xampp\htocts下,即目录工程文件夹路径为D:\xampp\htocts\9999m。在phpStorm>File>open,找到9999m,点击确定,加载9999m到了phpStorm(安装环境路径根据需要自行更改,后面的配置内容也类似)。
1. 开始服务器端配置:安装好XAMPP,停止apache服务(注意,如果直接退出XAMPP,是不会停止apache的)。
2. 在安装目录下找到php.ini,类似于D:\xampp\php\php.ini,并打开。
3. 找到被注释掉的项目(去掉前面的?)并按如下设置:
[XDebug]
==============原代码
xdebug.profiler_append = 0
xdebug.profiler_enable = 1
xdebug.profiler_enable_trigger = 0
xdebug.profiler_output_dir ="D:\phpStudy\tmp\xdebug"
xdebug.trace_output_dir ="D:\phpStudy\tmp\xdebug"
xdebug.profiler_output_name = "cache.out.%t-%s"
xdebug.remote_enable = 1
xdebug.remote_handler = "dbgp"
xdebug.remote_host = "127.0.0.1"
;zend_extension="D:\phpStudy\php53n\ext\xdebug.dll"
==============改后
xdebug.profiler_append = 0
xdebug.profiler_enable = 1
xdebug.profiler_enable_trigger = 0
xdebug.profiler_output_dir ="D:\phpStudy\tmp\xdebug"
xdebug.trace_output_dir ="D:\phpStudy\tmp\xdebug"
xdebug.profiler_output_name = "cache.out.%t-%s"
xdebug.remote_enable = 1
xdebug.remote_handler = "dbgp"
xdebug.remote_host = "127.0.0.1"
zend_extension="D:\phpStudy\php53n\ext\xdebug.dll"
xdebug.idekey= PHPSTROM
====================转载的
zend_extension = "D:\xampp\php\ext\php_xdebug.dll"
xdebug.profiler_append = 0
xdebug.profiler_enable = 1
xdebug.profiler_enable_trigger = 0
xdebug.profiler_output_dir = "D:\xampp\tmp"
xdebug.profiler_output_name = "cachegrind.out.%t-%s"
xdebug.remote_enable = on
xdebug.remote_handler = "dbgp"
xdebug.remote_host = "127.0.0.1"
xdebug.trace_output_dir = "D:\xampp\tmp"
xdebug.idekey= PHPSTROM
最初的设置是这样的:图2
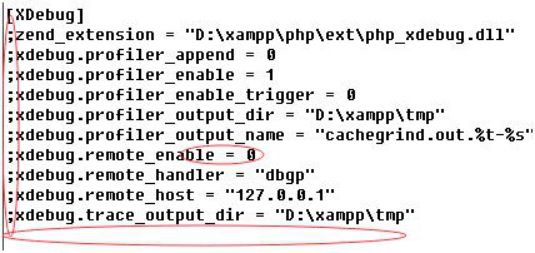
;的意思是被注释掉了,所以要先去掉;号;
然后开启xdebug.remote_enable = on;
还要增加xdebug.idekey= PHPSTROM。
其中remote_host 是指调试客户端的地址,即IDE所在的IP,同理remote_port 是客户端的端口,这两项在远程调试的情况下注意修改,远程的时候最终改为:
[XDebug]
zend_extension = "D:\xampp\php\ext\php_xdebug.dll"
xdebug.profiler_append = 0
xdebug.profiler_enable = 1
xdebug.profiler_enable_trigger = 0
xdebug.profiler_output_dir = "D:\xampp\tmp"
xdebug.profiler_output_name = "cachegrind.out.%t-%s"
xdebug.remote_enable = 1
xdebug.remote_handler = "dbgp"
xdebug.remote_mode = "req"
xdebug.remote_port = 9000
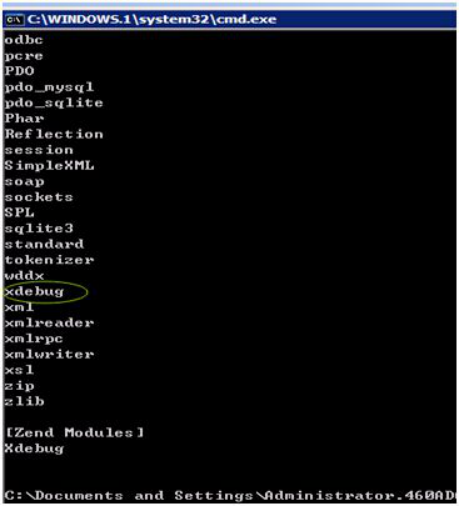
4. 保存文件,重新启动apache检查是否成功开启了xdebug服务。
一种方法为在CMD里输入D:\xampp\php\php.exe -m 看到XDebug,说明成功开启XDebug。
另一种方法为浏览器打开localhost,找到phpinfo()点击打开配置情况,查找xdebug项,找到了说明xdebug配置成功。

至此,服务器端配置完毕。
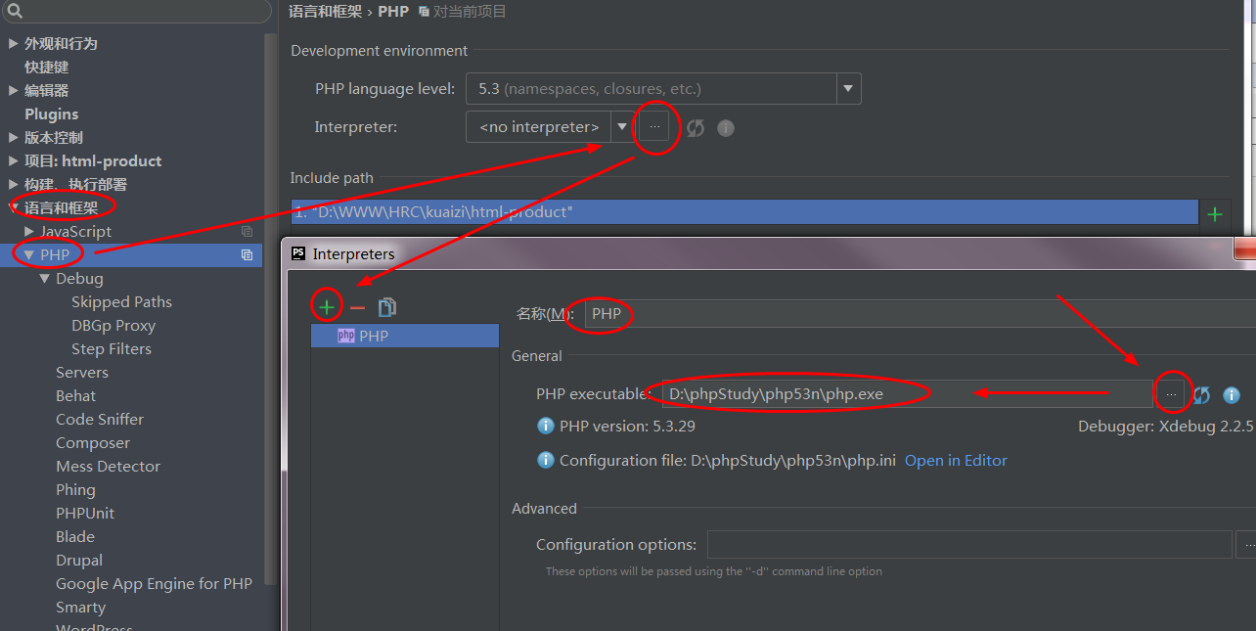
5. 下面是客户端调试。打开phpStorm,进入File>Settings>PHP(文件-设置-语言和框架-php),这里要interpreter浏览,填D:\xampp\php\php.exe,自动识别版本。
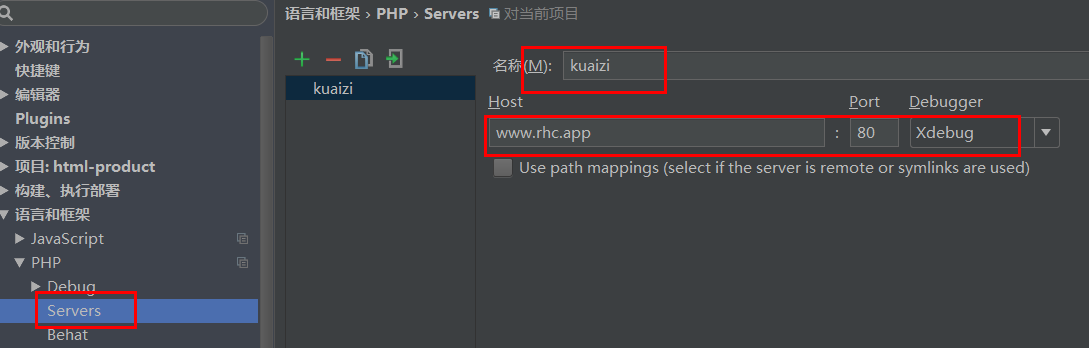
6. 进入File>Settings>PHP>Servers,这里要填写服务器端的相关信息,name填localhost,
,host填localhost,port填80,debugger选XDebug。图7 是自定义的虚拟域名。
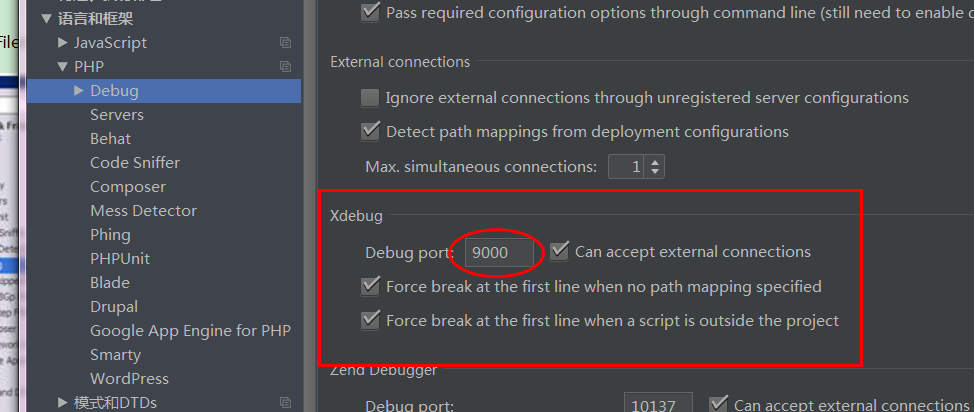
7. 进入File>Settings>PHP>Debug,看到XDebug选项卡,port填9000,其他默认。图8
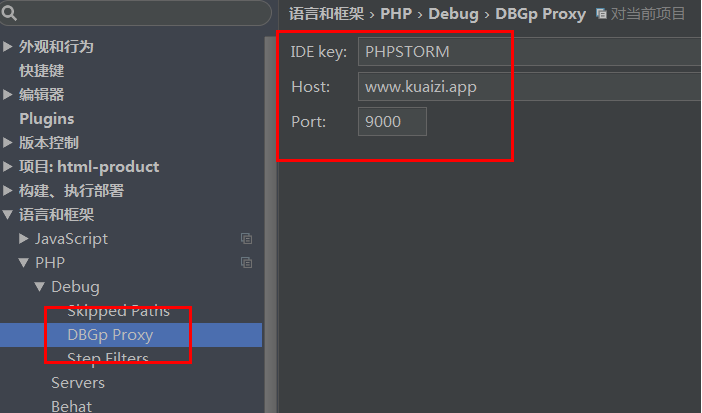
8. 进入File>Settings>PHP>Debug>DBGp Proxy,IDE key 填 PHPSTORM,host 填localhost,port填9000,点OK退出设置。图9
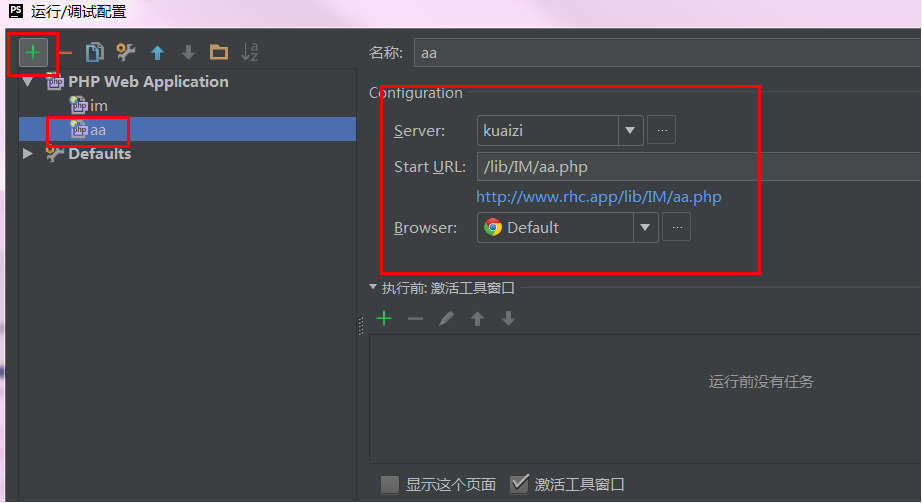
9. 进入Run> Debug configurations,点+号,Server选填localhost,start url 是在http://localhost的基础上再加上去,如加上 9999m,就形成http://localhost/9999m.
以图中蓝色地址为参考, Browse 填chrome,点OK退出设置。图10
点OK退出设置之后,phpstorm运行按钮旁边自动填充localhost,且运行按钮由灰色被激活成为绿色。如果start url填的是http://localhost,没有填写9999m,则当点击phpstorm运行按钮,浏览器进入默认地址http://localhost,没办法直接访问http://localhost/9999m。
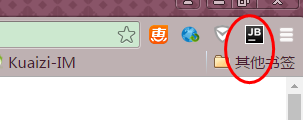
10. chrome浏览器链接配置。找到对应的插件,chrome的为phpstrom IDE Support chrome.crx,自己下载然后拖动文件到chrome设置>扩展程序。
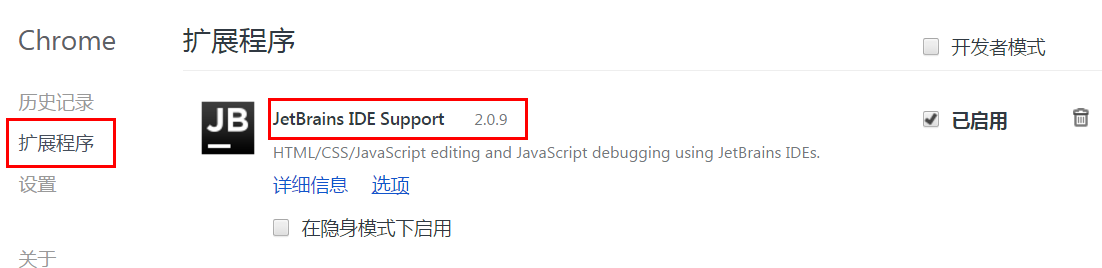
Chrome右上角增加了JB图标即为成功安装插件。
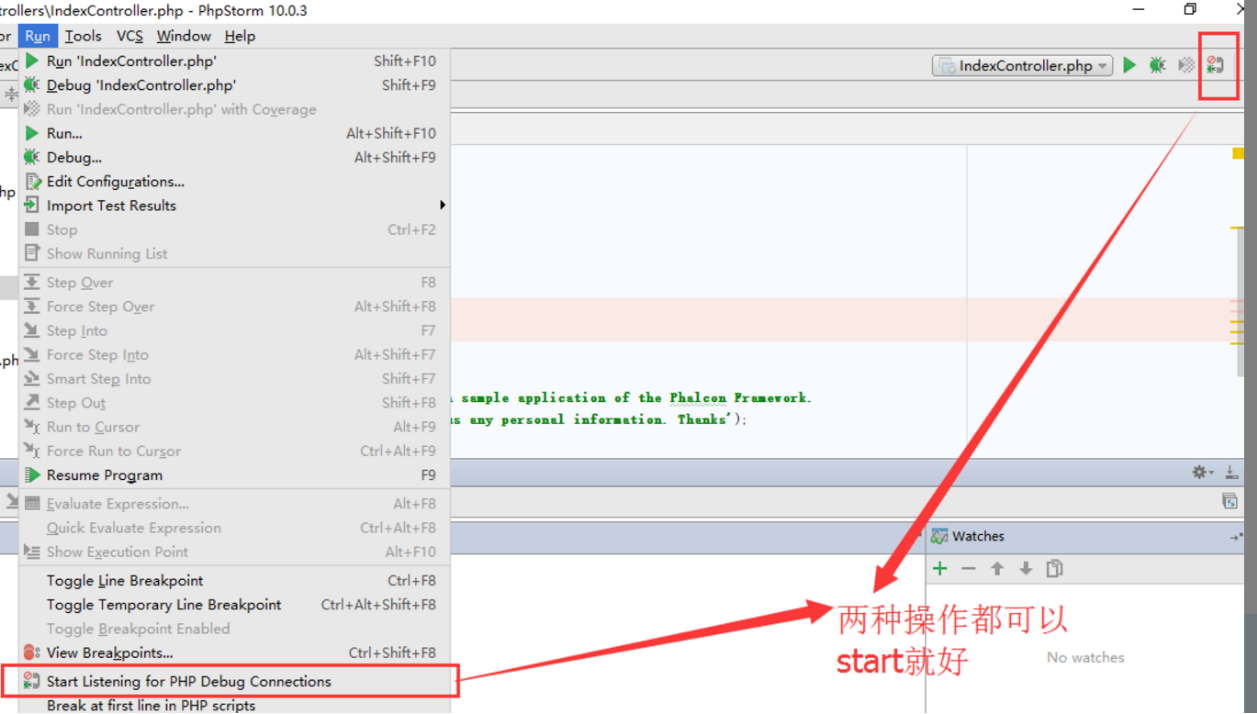
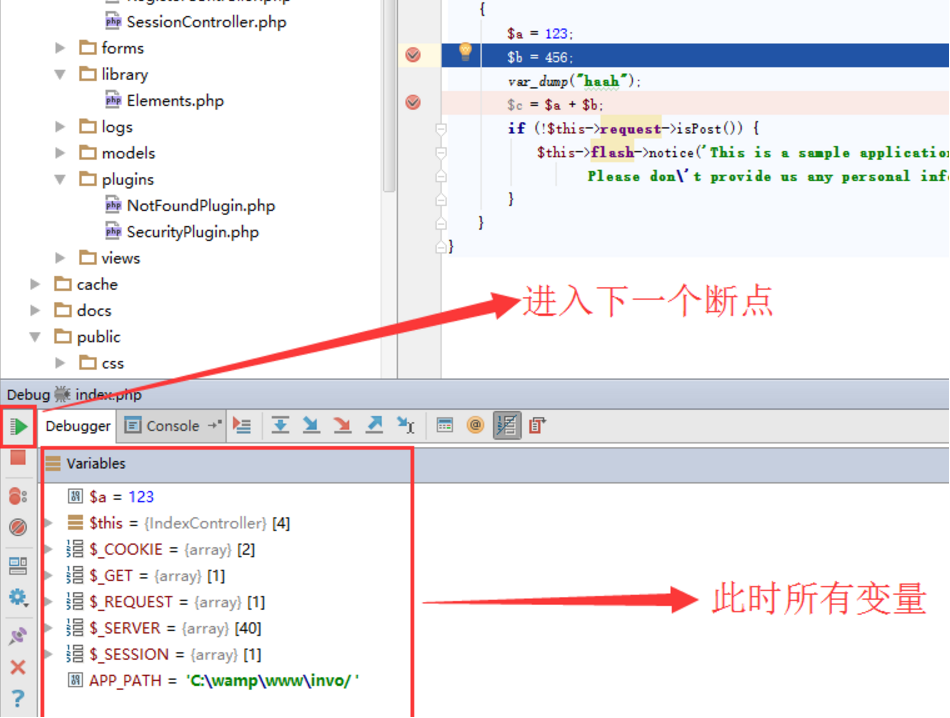
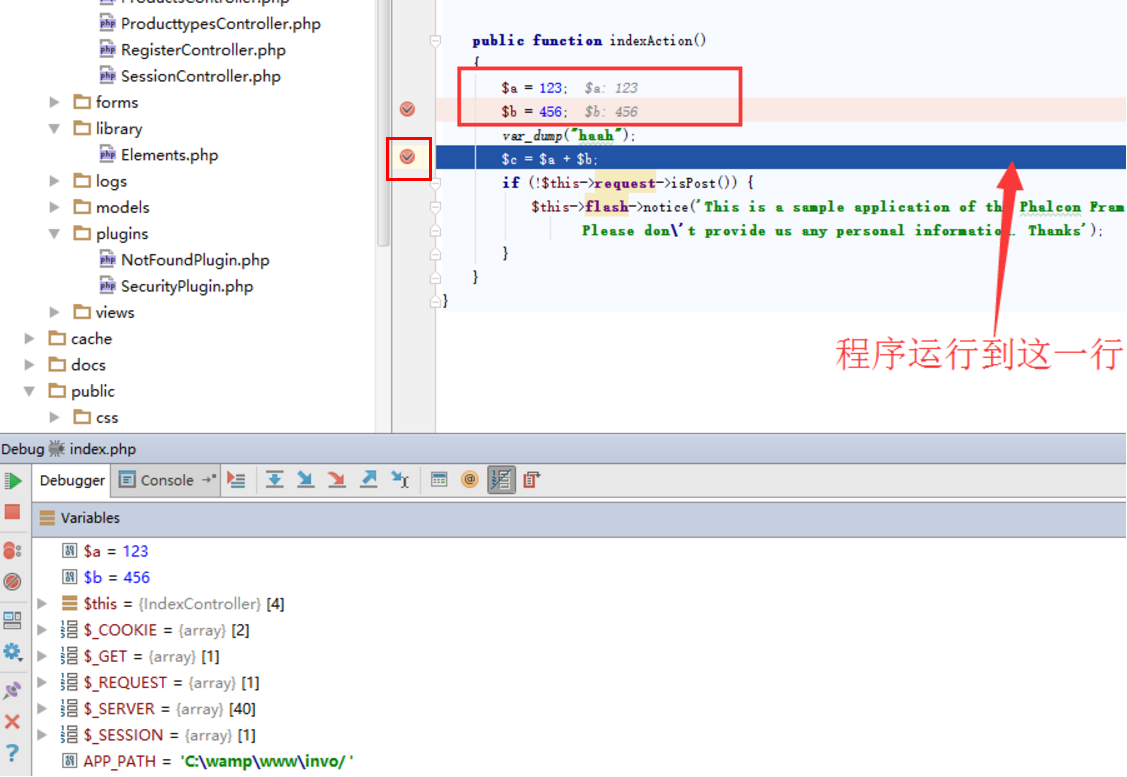
11. 在phpStorm里打开监听,就是一个电话一样的按钮,点击变为绿色,在程序代码点前点击,设置程序段点,点击绿色的debug爬虫按钮,chrome浏览器打开xdebug页,phpStorm出现debug窗口,并获取到variables值,即为看到下面的debug信息,说明成功配置。图13
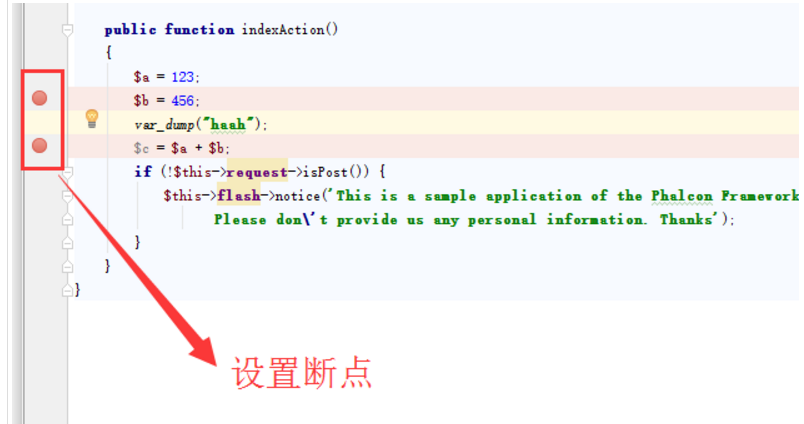
12 断点调试
通过点击红框中的位置设置和取消断点
大功告成!!!
参考文献:http://blog.sina.com.cn/zhyl4669
原文地址: http://www.cnblogs.com/xujian2016/p/5548921.html
PhpStorm/Xdebug安装使用的更多相关文章
- phpstorm+xdebug安装配置
这个问题也困惑了我好久 烦死了 今天看了qing师傅的博客 跟着安装 运行环境: phpStorm 2018 PHP 5.45 nts VC9 Xdebug 2.4.1 0x01 PHP安装xdebu ...
- PHPStorm+Xdebug断点远程调试PHP xdebug安装
一.xdebug安装 wget http://www.xdebug.org/files/xdebug-2.2.3.tgz #下载Xdebug tar xzf xdebug-2.2.3.tgz cd x ...
- php安装xdebug扩展,PHPStorm+XDebug单步调试
(一)php安装xdebug扩展,PHPStorm+XDebug单步调试 (二)PHPStorm配置XDebug (三)PHPStorm使用XDebug调试 (四)PhpStorm+Xdebug配置单 ...
- XAMPP PHPSTORM XDEBUG 配合使用
1.xdebug 配置 安装完xampp 进入 php.ini [XDebug]zend_extension = "C:\xampp\php\ext\php_xdebug.dll" ...
- 关于phpstorm中安装配置xdeug
最近从网上找了好多phpstorm中配置安装xdebug的信息,但是貌似都失败了 ...我也不知道是为什么... 突然有一天 不知道怎么整的就配置成功了 现在可以分享一下了 正好我用的软件的版本 ...
- centos7+nginx 1.9.0+php-fpm+phpstorm+xdebug+vmware开发环境搭建
1.php-fpm yum install php-fpm 默认配置在本地9000端口监听 service php-fpm restart启动 2.nginx 1.9.0 需先安装gcc zlib o ...
- PHPStorm+XDebug进行调试图文教程以及解析wamp的php.ini设置不生效的原因
这篇文章主要为大家详细介绍了PHPStorm+XDebug进行调试图文教程,内容很丰富,具有一定的参考价值,感兴趣的小伙伴们可以参考一下 笔者的开发环境如下:Windows8.1+Apache+P ...
- PhpStorm, XDebug, and DBGp Proxy
phpstorm 利用 xdebug.dbgp-proxy配置远程调试 1.单客户机远程调试 a.安装xdebug库文件(windows:php_xdebug.dll;linux:php_xdebug ...
- 使用 PHPStorm + Xdebug 实现断点调试(二)
一.配置 Xdebug 配置 Xdebug 相关参数,在 php.ini 文件中新增如下配置,如果没安装的,请参考<PHP 安装 Xdebug扩展>: [xdebug] xdebug.re ...
随机推荐
- Linux学习之CentOS(二十二)--单用户模式下修改Root用户的密码
在上一篇随笔里面详细讲解了Linux系统的启动过程 (Linux学习之CentOS(二十一)--Linux系统启动详解),我们知道Linux系统的启动级别一共有6种级别,通过 /etc/inittab ...
- 关于elasticsearch和kibana的时区和日期问题
elasticsearch原生支持date类型,json格式通过字符来表示date类型.所以在用json提交日期至elasticsearch的时候,es会隐式转换,把es认为是date类型的字符串直接 ...
- 【转载】如何用IntelliJ IDEA 14 创建Web项目
首先要理解一个概念:在IntelliJ IDEA中"new Project"相当于eclipse中的工作空间(Workspace),而"new Module"相 ...
- ruby 基础知识(一)
突然今天发现一大神的博客:http://www.cnblogs.com/jackluo/archive/2013/01/22/2871655.html 相信初学者会受益颇多 ruby 参考文档 ...
- Javascript设计模式学习二(单例)
定义:保证一个类仅有一个实例,并提供一个访问它的全局访问点 普通的单例模式: 使用一个变量来标记当前是否已经为某个类创建过对象,如果是的话,在下一次获取该类的实例时,直接返回之前创建的对象.比如:使用 ...
- win7下IIS的安装和配置 图文教程
转自 http://www.jb51.net/article/29787.htm 最近工作需要IIS,自己的电脑又是Windows7系统,找了下安装的方法,已经安装成功.在博客里记录一下,给需要的 ...
- 高程三:Array
一:Array数组 1.Array.isArray(参数) 检测是否是数组,*不兼容IE8,兼容IE9及以上.Chrome.Firefox等,要兼容IE8,可以用 Object.prototype.t ...
- Javascript权威指南学习笔记
第二章:词法结构 ;function a(){alert(2)};//前面的分号保证正确地语句解析 第三章:类型.值和变量 基本概念: 1.数据类型---能够表示并操作的值的类型叫做数据类型. 2.变 ...
- PXE+Kickstart+DHCP+TFTP实现无人值守安装操作系统
PXE+Kickstart+DHCP+TFTP实现无人值守安装操作系统 PXE + Kickstart PXE的工作流程及配置文件 Kickstart的配置文件 Linux安装大致可以分为2个阶段 第 ...
- Node.js配合node-http-proxy解决本地开发ajax跨域问题
情景: 前后端分离,本地前端开发调用接口会有跨域问题,一般有以下3种解决方法: 1. 后端接口打包到本地运行(缺点:每次后端更新都要去测试服下一个更新包,还要在本地搭建java运行环境,麻烦) 2. ...