2-3 Numpy+Matplotlib可视化(一)
(1)pyplot基础绘图
# -*-coding:utf-8-*-
# !/usr/bin/env python
# Author:@vilicute import numpy as np
import matplotlib.pyplot as plt t = np.arange(-5*np.pi, 5*np.pi, 0.01)
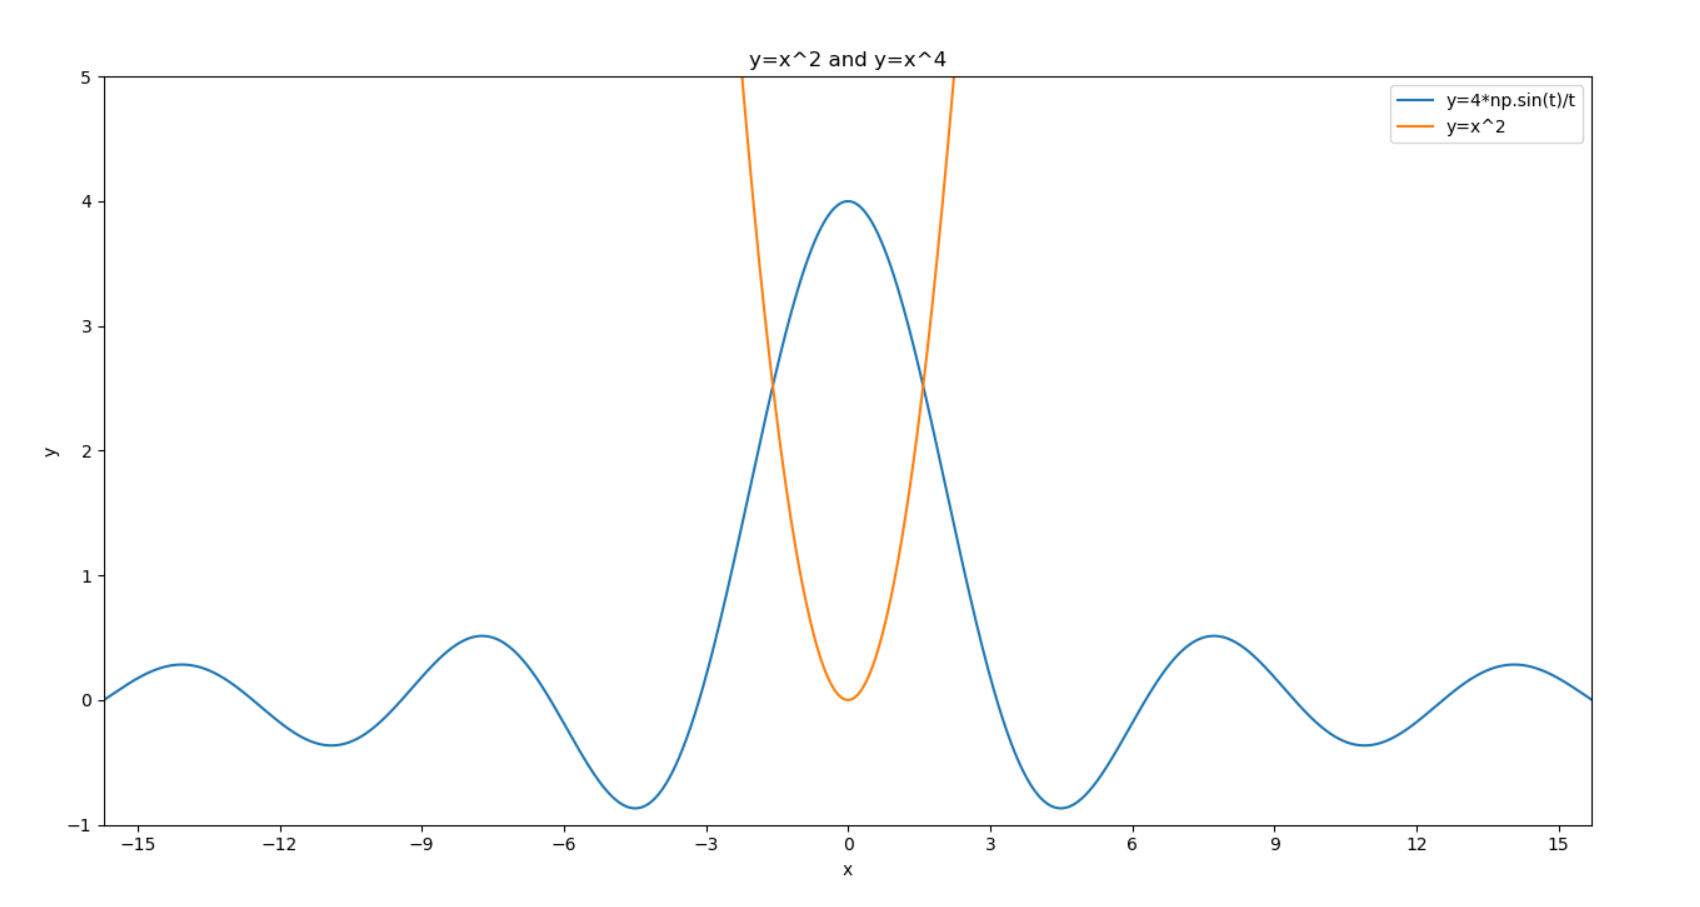
plt.title('y=x^2 and y=x^4') # 添加标题
plt.xlabel('x') # x轴名称
plt.ylabel('y') # y轴名称
plt.xlim((-5*np.pi, 5*np.pi)) # x轴范围
plt.ylim((-1, 5)) # y轴范围
plt.xticks([-15, -12, -9, -6, -3, 0, 3, 6, 9, 12, 15]) # x轴刻度
plt.yticks([-1, 0, 1, 2 , 3, 4, 5]) # y轴刻度
plt.plot(t, 4*np.sin(t)/t)
plt.plot(t, t**2)
plt.legend(['y=4*np.sin(t)/t', 'y=x^2']) # 标注说明
plt.show()
(2)多图绘制
 # -*-coding:utf-8-*-

 # !/usr/bin/env python

 # Author:@vilicute

 import numpy as np

 import matplotlib.pyplot as plt

 t = np.arange(0, 2*np.pi, 0.01)

 pl = plt.figure(figsize=(8, 6), dpi=80)  # 确定画布大小

 ax1 = pl.add_subplot(2, 1, 1)  # 创建一个2行1列子图,第一个图

 plt.title('y=x^2 and y=x^4')  # 添加标题

 plt.xlabel('x')  # x轴名称

 plt.ylabel('y')  # y轴名称

 plt.xlim((0, 1))  # x轴范围

 plt.ylim((0, 1))  # y轴范围

 plt.xticks([0, 0.2, 0.4, 0.6, 0.8, 1.0])  # x轴刻度

 plt.yticks([0, 0.2, 0.4, 0.6, 0.8, 1.0])  # y轴刻度

 plt.plot(t, t**2)

 plt.plot(t, t**4)

 plt.legend(['y=x^2', 'y=x^4'])  # 标注说明

 ax2 = pl.add_subplot(2, 1, 2)  # 第二个图

 plt.title('sin(x) and cos(x)')

 plt.xlabel('x')

 plt.ylabel('y')

 plt.xlim((0, np.pi*2))

 plt.ylim((-1, 1))

 plt.xticks([0, np.pi/2, np.pi, 3*np.pi/2, np.pi*2])

 plt.yticks([-1, -0.5, 0, 0.5, 1.0])

 plt.plot(t, np.sin(t))

 plt.plot(t, np.cos(t))

 plt.legend(['sin(x)', 'cos(x)'])

 plt.show()

2-3 Numpy+Matplotlib可视化(一)的更多相关文章
- LogisticRegression in MLLib (PySpark + numpy+matplotlib可视化)
参考'LogisticRegression in MLLib' (http://www.cnblogs.com/luweiseu/p/7809521.html) 通过pySpark MLlib训练lo ...
- 2-4 Numpy+Matplotlib可视化(二)
自定义绘图 # -*-coding:utf-8-*- # !/usr/bin/env python # Author:@vilicute import numpy as np import matpl ...
- 【学习总结】GirlsInAI ML-diary day-21-初识 Numpy, Matplotlib, Seanborn [柱状图、折线图、箱图]
[学习总结]GirlsInAI ML-diary 总 原博github链接-day21 初识 Numpy, Matplotlib, Seanborn [柱状图.折线图.箱图] 一.Titanic练习赛 ...
- 国外大神制作的一个很棒的matplotlib 可视化教程
国外大神制作的一个很棒的matplotlib 可视化教程 参考:https://www.machinelearningplus.com/plots/top-50-matplotlib-visualiz ...
- 在mac安装numpy matplotlib scipy
p.p1 { margin: 0.0px 0.0px 0.0px 0.0px; font: 11.0px Menlo; color: #000000; background-color: #fffff ...
- Ubuntu-Python2.7安装 scipy,numpy,matplotlib 和pip
一. scipy,numpy,matplotlib sudo apt-get install python-scipy sudo apt-get install python-numpy sudo a ...
- NumPy Matplotlib库
NumPy - Matplotlib Matplotlib 是 Python 的绘图库. 它可与 NumPy 一起使用,提供了一种有效的 MatLab 开源替代方案. 它也可以和图形工具包一起使用,如 ...
- 21、numpy—Matplotlib
NumPy Matplotlib Matplotlib 是 Python 的绘图库. 它可与 NumPy 一起使用,提供了一种有效的 MatLab 开源替代方案. 它也可以和图形工具包一起使用,如 P ...
- SciKit-Learn 使用matplotlib可视化数据
章节 SciKit-Learn 加载数据集 SciKit-Learn 数据集基本信息 SciKit-Learn 使用matplotlib可视化数据 SciKit-Learn 可视化数据:主成分分析(P ...
随机推荐
- 怎么解决VirtualBox无法安装增强工具
点击「设备」-「安装增强功能」,然后就弹出下面这个东西,百度和 bing 了很久,终于解决啦~ Unable to insert the virtual optical disk D:\Program ...
- MySQL5.6 community从下载到安装
一, 官网下载: https://www.mysql.com/downloads/ 二, 安装过程 1, 双击打开 安装 这里是进行数据库配置: 端口默认为3306 这里我们更改为1207 ...
- linux-c getopt()参数处理函数
转自:https://www.cnblogs.com/qingergege/p/5914218.html 最近在弄Linux C编程,本科的时候没好好学啊,希望学弟学妹们引以为鉴. 好了,虽然啰嗦了点 ...
- javascript执行上下文和变量对象
执行上下文(execution context): 执行上下文就是当前 JavaScript 代码被解析和执行时所在环境的抽象概念. js语言是一段一段的顺序执行,这个“段”其实就是我们说的这个执行上 ...
- router-link动态赋值
A:router路由配置 export default new Router({ routes: [ { path: '/home', name: 'Home', component: Home, c ...
- 关于set的unordered特性
关于set排序无序的问题,原因是set使用哈希表做内存索引. 详细介绍可见: https://stackoverflow.com/questions/12165200/order-of-unorder ...
- 快速傅里叶变换(FFT)学习
首先,在写这篇博客之前,我还没有完全学会FFT. 先把会的部分打好,加深一下记忆(也可以说是做笔记吧). 初三了,还不会FFT,要退役喽-- 多项式乘法 点开这篇博客之前,你就应该知道,FFT是用来求 ...
- QInotifyFileSystemWatcherEngine::addPaths: inotify_add_watch failed: 设备上没有空间
解决办法: 添加最大监控文件数量 临时解决:(重启之后恢复) 命令设置:sudo sysctl fs.inotify.max_user_watches=524288 生效: sudo sysctl - ...
- Ionic 不随系统字体而变化
1.添加插件phonegap-plugin-mobile-accessibility cordova plugin add https://github.com/phonegap/phonegap-m ...
- 原生JS实现动态时钟(优化)
<!doctype html> <html> <head> <meta charset="utf-8"> <title> ...