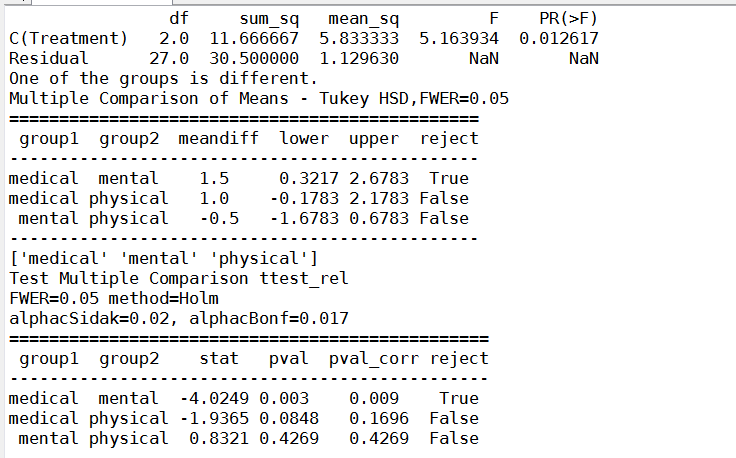
多重检验_LSD方法不准确性
python机器学习-乳腺癌细胞挖掘(博主亲自录制视频)
https://study.163.com/course/introduction.htm?courseId=1005269003&utm_campaign=commission&utm_source=cp-400000000398149&utm_medium=share

机器学习,统计项目联系:QQ231469242
#mental
group1=[2,2,3,4,4,5,3,4,4,4]
#physical
group2=[4,4,3,5,4,1,1,2,3,3]
#medical
group3=[1,2,2,2,3,2,3,1,3,1]
多重检验结果和贾俊平的LSD结果不一样,经过T配对试验,多重检验和T配对试验一致,LSD对小样本可能不准确
# -*- coding: utf-8 -*-

# Import standard packages

import numpy as np

import matplotlib.pyplot as plt

from scipy import stats

import pandas as pd

import os

# additional packages

import sys

sys.path.append(os.path.join('..', '..', 'Utilities'))

try:

# Import formatting commands if directory "Utilities" is available

    from ISP_mystyle import showData

except ImportError:

# Ensure correct performance otherwise

    def showData(*options):

        plt.show()

        return

# Other required packages

from statsmodels.stats.multicomp import (pairwise_tukeyhsd,

                                         MultiComparison)

from statsmodels.formula.api import ols

from statsmodels.stats.anova import anova_lm

from statsmodels.stats.libqsturng import psturng

def setData():

    ''' Set up the data, as a structured array. '''

    # The first and last field are 32-bit intergers; the second field is an

    # 8-byte string. Note that here we can also give names to the individual

    # fields!

    data = np.rec.array([

    (  1,   'mental',  2 ),

    (  2,   'mental',  2 ),

    (  3,   'mental',  3 ),

    (  4,   'mental',  4 ),

    (  5,   'mental',  4 ),

    (  6,   'mental',  5 ),

    (  7,   'mental',  3 ),

    (  8,   'mental',  4 ),

    (  9,   'mental',  4 ),

    ( 10,   'mental',  4 ),

    ( 11, 'physical',  4 ),

    ( 12, 'physical',  4 ),

    ( 13, 'physical',  3 ),

    ( 14, 'physical',  5 ),

    ( 15, 'physical',  4 ),

    ( 16, 'physical',  1 ),

    ( 17, 'physical',  1 ),

    ( 18, 'physical',  2 ),

    ( 19, 'physical',  3 ),

    ( 20, 'physical',  3 ),

    ( 21,  'medical',  1 ),

    ( 22,  'medical',  2 ),

    ( 23,  'medical',  2 ),

    ( 24,  'medical',  2 ),

    ( 25,  'medical',  3 ),

    ( 26,  'medical',  2 ),

    ( 27,  'medical',  3 ),

    ( 28,  'medical',  1 ),

    ( 29,  'medical',  3 ),

    ( 30,  'medical',  1 )], dtype=[('idx', '<i4'),

                                    ('Treatment', '|S8'),

                                    ('StressReduction', '<i4')])

    return data

def doAnova(data):

    '''one-way ANOVA'''

    df = pd.DataFrame(data)

    model = ols('StressReduction ~ C(Treatment)',df).fit()

    anovaResults =  anova_lm(model)

    print(anovaResults)

    if anovaResults['PR(>F)'][0] < 0.05:

        print('One of the groups is different.')

def doTukey(data, multiComp):

    '''Do a pairwise comparison, and show the confidence intervals'''

    print((multiComp.tukeyhsd().summary()))

    # Calculate the p-values:

    res2 = pairwise_tukeyhsd(data['StressReduction'], data['Treatment'])

    df = pd.DataFrame(data)

    numData = len(df)

    numTreatments = len(df.Treatment.unique())

    dof = numData - numTreatments

    # Show the group names

    print((multiComp.groupsunique))

    # Generate a print -------------------

    # Get the data

    xvals = np.arange(3)

    res2 = pairwise_tukeyhsd(data['StressReduction'], data['Treatment'])

    errors = np.ravel(np.diff(res2.confint)/2)

    # Plot them

    plt.plot(xvals, res2.meandiffs, 'o')

    plt.errorbar(xvals, res2.meandiffs, yerr=errors, fmt='o')

    # Put on labels

    pair_labels = multiComp.groupsunique[np.column_stack(res2._multicomp.pairindices)]

    plt.xticks(xvals, pair_labels)

    # Format the plot

    xlim = -0.5, 2.5

    plt.hlines(0, *xlim)

    plt.xlim(*xlim)

    plt.title('Multiple Comparison of Means - Tukey HSD, FWER=0.05' +

              '\n Pairwise Mean Differences')

    # Save to outfile, and show the data

    outFile = 'multComp.png'

    showData(outFile)

def Holm_Bonferroni(multiComp):

    ''' Instead of the Tukey's test, we can do pairwise t-test '''

    # First, with the "Holm" correction

    rtp = multiComp.allpairtest(stats.ttest_rel, method='Holm')

    print((rtp[0]))

    # and then with the Bonferroni correction

    print((multiComp.allpairtest(stats.ttest_rel, method='b')[0]))

    # Any value, for testing the program for correct execution

    checkVal = rtp[1][0][0,0]

    return checkVal

def main():

    # Get the data

    data = setData()

    # Do a one-way ANOVA

    doAnova(data)

    #Then, do the multiple testing

    multiComp = MultiComparison(data['StressReduction'], data['Treatment'])

    doTukey(data, multiComp)    # Tukey's HSD test

    checkVal = Holm_Bonferroni(multiComp)  # Alternatives to Tukey's HSD test

    return checkVal     # this is only for regression testing of the program

if __name__ == '__main__':

    main()
多重检验结果和贾俊平的LSD结果不一样,经过T配对试验,多重检验和T配对试验一致,LSD对小样本可能不准确

# -*- coding: utf-8 -*-

import scipy,math

from scipy.stats import f

import numpy as np

import matplotlib.pyplot as plt

import scipy.stats as stats

# additional packages

from statsmodels.stats.diagnostic import lillifors

#多重比较

from statsmodels.sandbox.stats.multicomp import multipletests

#用于排列组合

import itertools

#独立T检验

from scipy.stats import ttest_ind

#配对T检验

from scipy.stats import ttest_rel

#mental

group1=[2,2,3,4,4,5,3,4,4,4]

#physical

group2=[4,4,3,5,4,1,1,2,3,3]

#medical

group3=[1,2,2,2,3,2,3,1,3,1]

list_groups=[group1,group2,group3]

list_total=group1+group2+group3

a=0.05

#one within group error,also know as random error

def SE(group):

    se=0

    mean1=np.mean(group)

    for i in group:

        error=i-mean1

        se+=error**2

    return se

'''

>>> SE(group1)

22.0

>>> SE(group2)

18.0

>>> SE(group3)

14.0

'''

#sum of squares within group error,also know as random error

def SSE(list_groups):

    sse=0

    for group in list_groups:

        se=SE(group)

        sse+=se

    return sse

#误差总平方和

def SST(list_total):

    sst=0

    mean1=np.mean(list_total)

    for i in list_total:

        error=i-mean1

        sst+=error**2

    return sst

#SSA,between-group sum of squares 组间平方和,公式1:ssa=sst-sse

def SSA(list_groups,list_total):

    sse=SSE(list_groups)

    sst=SST(list_total)

    ssa=sst-sse

    return ssa

#SSA,between-group sum of squares 组间平方和

def SSA1(list_groups,list_total):

    mean_total=np.mean(list_total)

    ssa=0

    for group in list_groups:

        group_mean=np.mean(group)

        distance=(mean_total-group_mean)**2

        ssa+=distance

    ssa=ssa*5

    return ssa

#处理效应均方

def MSA(list_groups,list_total):

    ssa=SSA(list_groups,list_total)

    msa=ssa/(len(list_groups)-1)*1.0

    return msa

# 误差均方

def MSE(list_groups,list_total):

    sse=SSE(list_groups)

    mse=sse/(len(list_total)-1*len(list_groups))*1.0

    return mse

#F score

def F(list_groups,list_total):

    msa=MSA(list_groups,list_total)

    mse=MSE(list_groups,list_total)

    ratio=msa/mse*1.0

    return ratio

'''

>>> F(list_groups,list_total)

22.592592592592595

'''

#LSD检验有问题,需要核对,不如配对T检验准确

#LSD(least significant difference)最小显著差异

def LSD(list_groups,list_total,sample1,sample2):

    mean1=np.mean(sample1)

    mean2=np.mean(sample2)

    distance=abs(mean1-mean2)

    print"distance:",distance

    #t检验的自由度

    df=len(list_total)-1*len(list_groups)

    mse=MSE(list_groups,list_total)

    print"MSE:",mse

    t_value=stats.t(df).isf(a/2)

    print"t value:",t_value

    lsd=t_value*math.sqrt(mse*(1.0/len(sample1)+1.0/len(sample2)))

    print "LSD:",lsd

    if distance<lsd:

        print"no significant difference between:",sample1,sample2

    else:

        print"there is significant difference between:",sample1,sample2

#正态分布测试

def check_normality(testData):

    #20<样本数<50用normal test算法检验正态分布性

    if 20<len(testData) <50:

       p_value= stats.normaltest(testData)[1]

       if p_value<0.05:

           print"use normaltest"

           print "data are not normal distributed"

           return  False

       else:

           print"use normaltest"

           print "data are normal distributed"

           return True

    #样本数小于50用Shapiro-Wilk算法检验正态分布性

    if len(testData) <50:

       p_value= stats.shapiro(testData)[1]

       if p_value<0.05:

           print "use shapiro:"

           print "data are not normal distributed"

           return  False

       else:

           print "use shapiro:"

           print "data are normal distributed"

           return True

    if 300>=len(testData) >=50:

       p_value= lillifors(testData)[1]

       if p_value<0.05:

           print "use lillifors:"

           print "data are not normal distributed"

           return  False

       else:

           print "use lillifors:"

           print "data are normal distributed"

           return True

    if len(testData) >300:

       p_value= stats.kstest(testData,'norm')[1]

       if p_value<0.05:

           print "use kstest:"

           print "data are not normal distributed"

           return  False

       else:

           print "use kstest:"

           print "data are normal distributed"

           return True

#对所有样本组进行正态性检验

def NormalTest(list_groups):

    for group in list_groups:

        #正态性检验

        status=check_normality(group1)

        if status==False :

            return False

#排列组合函数

def Combination(list_groups):

    combination= []

    for i in range(1,len(list_groups)+1):

        iter = itertools.combinations(list_groups,i)

        combination.append(list(iter))

    #需要排除第一个和最后一个

    return combination[1:-1][0]

'''

Out[57]:

[[([2, 3, 7, 2, 6], [10, 8, 7, 5, 10]),

  ([2, 3, 7, 2, 6], [10, 13, 14, 13, 15]),

  ([10, 8, 7, 5, 10], [10, 13, 14, 13, 15])]]

'''

#多重比较

def Multiple_test(list_groups):

    combination=Combination(list_groups)

    for pair in combination:

        LSD(list_groups,list_total,pair[0],pair[1])

#discriptive statistcs

print "discriptive statistcs----------------------------------------------"

print "group1 mean",np.mean(group1)

print "group2 mean",np.mean(group2)

print "group3 mean",np.mean(group3)

#对所有样本组进行正态性检验

print"M=Normality test:-----------------------------------"

NormalTest(list_groups)

#方差齐性检测

print"levene test:-----------------------------------"

leveneResult=scipy.stats.levene(group1,group2,group3)

leveneScore=leveneResult[0]

p_levene=leveneResult[1]

if p_levene<0.05:

   print"levene test is not fit,be attention!"

else:

   print"levene test is ok"

'''

H0成立,三组数据方差无显著差异

Out[9]: LeveneResult(statistic=0.24561403508771934, pvalue=0.7860617221429711)

'''

print "result--------------------------------------------------"

f_score=F(list_groups,list_total)

print"F score:",f_score

#sf 为生存函数survival function

#组数自由度

df1=len(list_groups)-1

#所有样本的自由度

df2=len(list_total)-1*len(list_groups)

probability=f.sf(f_score,df1,df2)

print"p value:",probability

'''

Out[28]: 8.5385924542746692e-05

'''

if probability<0.05:

    print"there is significance,H1 win"

else:

   print"there is no significance,H0 win"

#多重比较

print"multiple test----------------------------------------------"

print"Multiple test",Multiple_test

Multiple_test(list_groups)
贾俊平书里的例子,综合多重检验和LSD方法结果一致
#居民区
group1=[265,310,220,290,350,300,445,480,500,430,428,530]
#商业区
group2=[410,305,450,380,310,390,590,480,510,470,415,390]
#写字楼
group3=[180,290,330,220,170,256,290,283,260,246,275,320]

# -*- coding: utf-8 -*-

# Import standard packages

import numpy as np

import matplotlib.pyplot as plt

from scipy import stats

import pandas as pd

import os

# additional packages

import sys

sys.path.append(os.path.join('..', '..', 'Utilities'))

try:

# Import formatting commands if directory "Utilities" is available

    from ISP_mystyle import showData

except ImportError:

# Ensure correct performance otherwise

    def showData(*options):

        plt.show()

        return

# Other required packages

from statsmodels.stats.multicomp import (pairwise_tukeyhsd,

                                         MultiComparison)

from statsmodels.formula.api import ols

from statsmodels.stats.anova import anova_lm

from statsmodels.stats.libqsturng import psturng

def setData():

    ''' Set up the data, as a structured array. '''

    # The first and last field are 32-bit intergers; the second field is an

    # 8-byte string. Note that here we can also give names to the individual

    # fields!

    data = np.rec.array([

    (  1,   'resident', 265 ),

    (  2,   'resident', 310 ),

    (  3,   'resident', 220 ),

    (  4,   'resident', 290 ),

    (  5,   'resident', 350 ),

    (  6,   'resident', 300 ),

    (  7,   'resident', 445 ),

    (  8,   'resident', 480 ),

    (  9,   'resident', 500 ),

    ( 10,   'resident', 430),

    ( 11,   'resident', 428),

    ( 12,   'resident', 530 ),

    ( 13, 'commercial', 410 ),

    ( 14, 'commercial', 305 ),

    ( 15, 'commercial', 450 ),

    ( 16, 'commercial', 380 ),

    ( 17, 'commercial', 310 ),

    ( 18, 'commercial', 390 ),

    ( 19, 'commercial', 590 ),

    ( 20, 'commercial', 480 ),

    ( 21, 'commercial', 510 ),

    ( 22, 'commercial', 470 ),

    ( 23, 'commercial', 415 ),

    ( 24, 'commercial', 390 ),

    ( 25, 'officeBuilding', 180 ),

    ( 26, 'officeBuilding', 290 ),

    ( 27, 'officeBuilding', 330 ),

    ( 28, 'officeBuilding', 220 ),

    ( 29, 'officeBuilding', 170),

    ( 30, 'officeBuilding', 256),

    ( 31, 'officeBuilding', 290 ),

    ( 32, 'officeBuilding', 283 ),

    ( 33, 'officeBuilding', 260),

    ( 34, 'officeBuilding', 246),

    ( 35, 'officeBuilding', 275),

    ( 36, 'officeBuilding', 320),

     ], dtype=[('idx', '<i4'),

                                    ('Treatment', '|S8'),

                                    ('StressReduction', '<i4')])

    return data

def doAnova(data):

    '''one-way ANOVA'''

    df = pd.DataFrame(data)

    model = ols('StressReduction ~ C(Treatment)',df).fit()

    anovaResults =  anova_lm(model)

    print(anovaResults)

    if anovaResults['PR(>F)'][0] < 0.05:

        print('One of the groups is different.')

def doTukey(data, multiComp):

    '''Do a pairwise comparison, and show the confidence intervals'''

    print((multiComp.tukeyhsd().summary()))

    # Calculate the p-values:

    res2 = pairwise_tukeyhsd(data['StressReduction'], data['Treatment'])

    df = pd.DataFrame(data)

    numData = len(df)

    numTreatments = len(df.Treatment.unique())

    dof = numData - numTreatments

    # Show the group names

    print((multiComp.groupsunique))

    # Generate a print -------------------

    # Get the data

    xvals = np.arange(3)

    res2 = pairwise_tukeyhsd(data['StressReduction'], data['Treatment'])

    errors = np.ravel(np.diff(res2.confint)/2)

    # Plot them

    plt.plot(xvals, res2.meandiffs, 'o')

    plt.errorbar(xvals, res2.meandiffs, yerr=errors, fmt='o')

    # Put on labels

    pair_labels = multiComp.groupsunique[np.column_stack(res2._multicomp.pairindices)]

    plt.xticks(xvals, pair_labels)

    # Format the plot

    xlim = -0.5, 2.5

    plt.hlines(0, *xlim)

    plt.xlim(*xlim)

    plt.title('Multiple Comparison of Means - Tukey HSD, FWER=0.05' +

              '\n Pairwise Mean Differences')

    # Save to outfile, and show the data

    outFile = 'multComp.png'

    showData(outFile)

def Holm_Bonferroni(multiComp):

    ''' Instead of the Tukey's test, we can do pairwise t-test '''

    # First, with the "Holm" correction

    rtp = multiComp.allpairtest(stats.ttest_rel, method='Holm')

    print((rtp[0]))

    # and then with the Bonferroni correction

    print((multiComp.allpairtest(stats.ttest_rel, method='b')[0]))

    # Any value, for testing the program for correct execution

    checkVal = rtp[1][0][0,0]

    return checkVal

def main():

    # Get the data

    data = setData()

    # Do a one-way ANOVA

    doAnova(data)

    #Then, do the multiple testing

    multiComp = MultiComparison(data['StressReduction'], data['Treatment'])

    doTukey(data, multiComp)    # Tukey's HSD test

    checkVal = Holm_Bonferroni(multiComp)  # Alternatives to Tukey's HSD test

    return checkVal     # this is only for regression testing of the program

if __name__ == '__main__':

    main()
贾俊平书里的例子,综合多重检验和LSD方法结果一致
#居民区
group1=[265,310,220,290,350,300,445,480,500,430,428,530]
#商业区
group2=[410,305,450,380,310,390,590,480,510,470,415,390]
#写字楼
group3=[180,290,330,220,170,256,290,283,260,246,275,320]

# -*- coding: utf-8 -*-

import scipy,math

from scipy.stats import f

import numpy as np

import matplotlib.pyplot as plt

import scipy.stats as stats

# additional packages

from statsmodels.stats.diagnostic import lillifors

#多重比较

from statsmodels.sandbox.stats.multicomp import multipletests

#用于排列组合

import itertools

#独立T检验

from scipy.stats import ttest_ind

#配对T检验

from scipy.stats import ttest_rel

#居民区

group1=[265,310,220,290,350,300,445,480,500,430,428,530]

#商业区

group2=[410,305,450,380,310,390,590,480,510,470,415,390]

#写字楼

group3=[180,290,330,220,170,256,290,283,260,246,275,320]

list_groups=[group1,group2,group3]

list_total=group1+group2+group3

a=0.05

#one within group error,also know as random error

def SE(group):

    se=0

    mean1=np.mean(group)

    for i in group:

        error=i-mean1

        se+=error**2

    return se

'''

>>> SE(group1)

22.0

>>> SE(group2)

18.0

>>> SE(group3)

14.0

'''

#sum of squares within group error,also know as random error

def SSE(list_groups):

    sse=0

    for group in list_groups:

        se=SE(group)

        sse+=se

    return sse

#误差总平方和

def SST(list_total):

    sst=0

    mean1=np.mean(list_total)

    for i in list_total:

        error=i-mean1

        sst+=error**2

    return sst

#SSA,between-group sum of squares 组间平方和,公式1:ssa=sst-sse

def SSA(list_groups,list_total):

    sse=SSE(list_groups)

    sst=SST(list_total)

    ssa=sst-sse

    return ssa

#SSA,between-group sum of squares 组间平方和

def SSA1(list_groups,list_total):

    mean_total=np.mean(list_total)

    ssa=0

    for group in list_groups:

        group_mean=np.mean(group)

        distance=(mean_total-group_mean)**2

        ssa+=distance

    ssa=ssa*5

    return ssa

#处理效应均方

def MSA(list_groups,list_total):

    ssa=SSA(list_groups,list_total)

    msa=ssa/(len(list_groups)-1)*1.0

    return msa

# 误差均方

def MSE(list_groups,list_total):

    sse=SSE(list_groups)

    mse=sse/(len(list_total)-1*len(list_groups))*1.0

    return mse

#F score

def F(list_groups,list_total):

    msa=MSA(list_groups,list_total)

    mse=MSE(list_groups,list_total)

    ratio=msa/mse*1.0

    return ratio

'''

>>> F(list_groups,list_total)

22.592592592592595

'''

#LSD检验有问题,需要核对,不如配对T检验准确

#LSD(least significant difference)最小显著差异

def LSD(list_groups,list_total,sample1,sample2):

    mean1=np.mean(sample1)

    mean2=np.mean(sample2)

    distance=abs(mean1-mean2)

    print"distance:",distance

    #t检验的自由度

    df=len(list_total)-1*len(list_groups)

    mse=MSE(list_groups,list_total)

    print"MSE:",mse

    t_value=stats.t(df).isf(a/2)

    print"t value:",t_value

    lsd=t_value*math.sqrt(mse*(1.0/len(sample1)+1.0/len(sample2)))

    print "LSD:",lsd

    if distance<lsd:

        print"no significant difference between:",sample1,sample2

    else:

        print"there is significant difference between:",sample1,sample2

#正态分布测试

def check_normality(testData):

    #20<样本数<50用normal test算法检验正态分布性

    if 20<len(testData) <50:

       p_value= stats.normaltest(testData)[1]

       if p_value<0.05:

           print"use normaltest"

           print "data are not normal distributed"

           return  False

       else:

           print"use normaltest"

           print "data are normal distributed"

           return True

    #样本数小于50用Shapiro-Wilk算法检验正态分布性

    if len(testData) <50:

       p_value= stats.shapiro(testData)[1]

       if p_value<0.05:

           print "use shapiro:"

           print "data are not normal distributed"

           return  False

       else:

           print "use shapiro:"

           print "data are normal distributed"

           return True

    if 300>=len(testData) >=50:

       p_value= lillifors(testData)[1]

       if p_value<0.05:

           print "use lillifors:"

           print "data are not normal distributed"

           return  False

       else:

           print "use lillifors:"

           print "data are normal distributed"

           return True

    if len(testData) >300:

       p_value= stats.kstest(testData,'norm')[1]

       if p_value<0.05:

           print "use kstest:"

           print "data are not normal distributed"

           return  False

       else:

           print "use kstest:"

           print "data are normal distributed"

           return True

#对所有样本组进行正态性检验

def NormalTest(list_groups):

    for group in list_groups:

        #正态性检验

        status=check_normality(group1)

        if status==False :

            return False

#排列组合函数

def Combination(list_groups):

    combination= []

    for i in range(1,len(list_groups)+1):

        iter = itertools.combinations(list_groups,i)

        combination.append(list(iter))

    #需要排除第一个和最后一个

    return combination[1:-1][0]

'''

Out[57]:

[[([2, 3, 7, 2, 6], [10, 8, 7, 5, 10]),

  ([2, 3, 7, 2, 6], [10, 13, 14, 13, 15]),

  ([10, 8, 7, 5, 10], [10, 13, 14, 13, 15])]]

'''

#多重比较

def Multiple_test(list_groups):

    combination=Combination(list_groups)

    for pair in combination:

        LSD(list_groups,list_total,pair[0],pair[1])

#discriptive statistcs

print "discriptive statistcs----------------------------------------------"

print "group1 mean",np.mean(group1)

print "group2 mean",np.mean(group2)

print "group3 mean",np.mean(group3)

#对所有样本组进行正态性检验

print"M=Normality test:-----------------------------------"

NormalTest(list_groups)

#方差齐性检测

print"levene test:-----------------------------------"

leveneResult=scipy.stats.levene(group1,group2,group3)

leveneScore=leveneResult[0]

p_levene=leveneResult[1]

if p_levene<0.05:

   print"levene test is not fit,be attention!"

else:

   print"levene test is ok"

'''

H0成立,三组数据方差无显著差异

Out[9]: LeveneResult(statistic=0.24561403508771934, pvalue=0.7860617221429711)

'''

print "result--------------------------------------------------"

f_score=F(list_groups,list_total)

print"F score:",f_score

#sf 为生存函数survival function

#组数自由度

df1=len(list_groups)-1

#所有样本的自由度

df2=len(list_total)-1*len(list_groups)

probability=f.sf(f_score,df1,df2)

print"p value:",probability

'''

Out[28]: 8.5385924542746692e-05

'''

if probability<0.05:

    print"there is significance,H1 win"

else:

   print"there is no significance,H0 win"

#多重比较

print"multiple test----------------------------------------------"

print"Multiple test",Multiple_test

Multiple_test(list_groups)
python风控评分卡建模和风控常识(博客主亲自录制视频教程)

多重检验_LSD方法不准确性的更多相关文章
- 除了GPS外的4种获得用户地理位置数据的方法
纯粹的GPS解决方案以及它所生成的经纬度标签是地理位置数据的公认标准.但是至少还有4种方法可以获得地理位置数据: 1.手机信号塔数据:当移动设备的GPS芯片不能接收到GPS信号时,移动设备就需要与它所 ...
- T检验与F检验的区别_f检验和t检验的关系
1,T检验和F检验的由来 一般而言,为了确定从样本(sample)统计结果推论至总体时所犯错的概率,我们会利用统计学家所开发的一些统计方法,进行统计检定. 通过把所得到的统计检定值,与统计学家建立了一 ...
- 手势估计- Hand Pose Estimation
http://blog.csdn.net/myarrow/article/details/51933651 1. 目前进展 1.1 相关资料 1)HANDS CVPR 2016 2 ...
- 通俗理解T检验和F检验
来源: http://blog.sina.com.cn/s/blog_4ee13c2c01016div.html 1,T检验和F检验的由来 一般而言,为了确定从样本(sample)统计结果推论至总 ...
- ML—随机森林·1
Introduction to Random forest(Simplified) With increase in computational power, we can now choose al ...
- 通俗理解T检验与F检验的区别【转】
转自:http://blog.sina.com.cn/s/blog_4ee13c2c01016div.html1,T检验和F检验的由来一般而言,为了确定从样本(sample)统计结果推论至总体时所犯错 ...
- 比较任意两个JSON串是否相等(比较对象是否相等)JAVA版
废话少说,直接入题. 在面向对象语言中,经常会比较两个对象是否相等,而比较的大多是实体类实例,也就是封装数据的那些类实例,或者是Map.List互相嵌套成的复杂数据结构. 比较对象是否相等,常见的思路 ...
- Web指纹识别目的Discuz识别+粗糙的版本演绎
这个识别程序是本学期在我的职业培训项目.它是做一类似至Zoomeye怪东西,然后使用ES集成,为了让搜索引擎寻找.因此,我们必须首先去网上识别相应的能力Web包裹,如果用户输入的关键词:Discuz ...
- 统计学常用概念:T检验、F检验、卡方检验、P值、自由度
1,T检验和F检验的由来 一般而言,为了确定从样本(sample)统计结果推论至总体时所犯错的概率,我们会利用统计学家所开发的一些统计方法,进行统计检定. 通过把所得到的统计检定值,与统计学家建立了一 ...
随机推荐
- Java:重写equals()和hashCode()
Java:重写equals()和hashCode() 1.何时需要重写equals() 当一个类有自己特有的“逻辑相等”概念(不同于对象身份的概念). 2.设计equals() [1]使用instan ...
- lambda(匿名函数)---基于python
在学习python的过程中,lambda的语法时常会使人感到困惑,lambda是什么,为什么要使用lambda,是不是必须使用lambda? 下面就上面的问题进行一下解答. 1.lambda是什么? ...
- 在PHP中,是以分好结束一条语句的吗
在PHP中,是以分号结束一条语句的,这个和C语言类似. 但是,有一条例外,对于PHP结束tag之前的语句,是可以不写分号的: <?php if ($a == $b) { echo "R ...
- plsql 永久注册码
注册码:Product Code:4t46t6vydkvsxekkvf3fjnpzy5wbuhphqzserial Number:601769 password:xs374ca 可用
- 获取emacs安装的elpa包名称
| grep "./" | sed 's/\.\///g' | sed 's/-[0-9].*$//' | sort -u
- week1 四则运算
四则运算满足简单加减乘除,以及包含括号的复杂四则运算. 代码描述: 1.采用random随机数产生要参与计算的数字,以及运算符号 2.采用Scanner获取控制台输入的结果,与计算出来的结果进行比对, ...
- SharePoint 2016 Document Center Send To Connection
General Application setting->configure send to connection then i had to choose web application&qu ...
- PHP与类有关的几个魔术方法
与类有关的其他魔术方法 序列化与反序列化技术 含义: 序列化: 就是将一个变量所代表的“内存”数据,转换为“字符串”形式并持久保存在硬盘上的一种做法. 反序列化: 就是将序列化之后保存在硬盘上的“字符 ...
- CF816E-Karen and Supermarket
题目 Description 今天Karen要去买东西. 一共有 \(n\) 件物品,每件物品的价格为\(c_i\),同时每件物品都有一张优惠券,可以对这件物品减价 \(d_i\) . 使用第 \(i ...
- 【bzoj4425】[Nwerc2015]Assigning Workstations分配工作站 贪心+堆
题目描述 佩内洛普是新建立的超级计算机的管理员中的一员. 她的工作是分配工作站给到这里来运行他们的计算研究任务的研究人员. 佩内洛普非常懒惰,不喜欢为到达的研究者们解锁机器. 她可以从在她的办公桌远程 ...