Python第三方库之openpyxl(6)
Python第三方库之openpyxl(6)
折线图
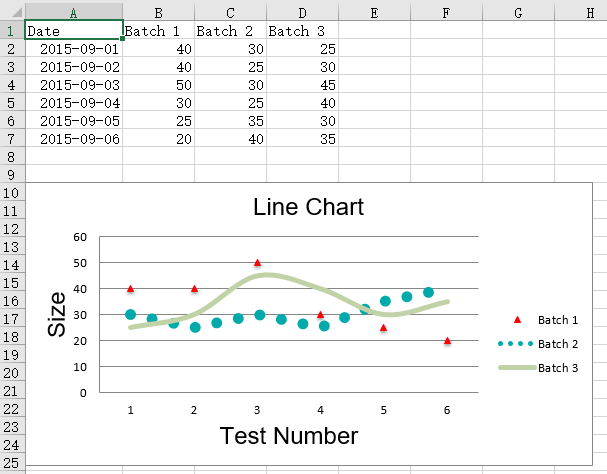
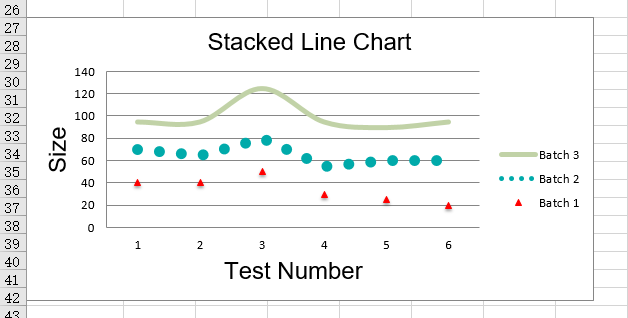
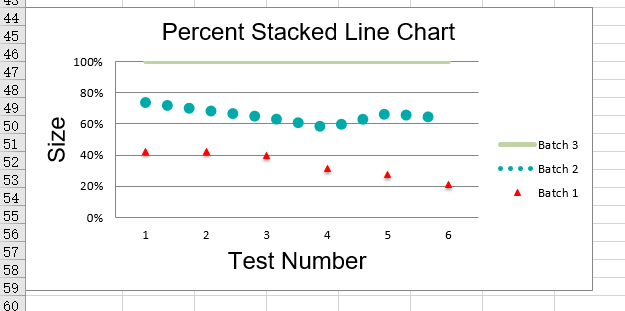
折线图允许在固定轴上绘制数据,它们类似于散列图,主要的区别在于,在折线图中,每个数据序列都是根据相同的值绘制的,不同的轴可以用于辅助轴,与条形图类似,有三种类型的折线图:standard、stacked 和percentStacked
2D折线图
from datetime import date

from openpyxl import Workbook

from openpyxl.chart import (

    LineChart,

    Reference,

)

from openpyxl.chart.axis import DateAxis

wb = Workbook()

ws = wb.active

rows = [

    ['Date', 'Batch 1', 'Batch 2', 'Batch 3'],

    [date(2015,9, 1), 40, 30, 25],

    [date(2015,9, 2), 40, 25, 30],

    [date(2015,9, 3), 50, 30, 45],

    [date(2015,9, 4), 30, 25, 40],

    [date(2015,9, 5), 25, 35, 30],

    [date(2015,9, 6), 20, 40, 35],

]

for row in rows:

    ws.append(row)

c1 = LineChart()

c1.title = "Line Chart"

c1.style = 13

c1.y_axis.title = 'Size'

c1.x_axis.title = 'Test Number'

data = Reference(ws, min_col=2, min_row=1, max_col=4, max_row=7)

c1.add_data(data, titles_from_data=True)

# Style the lines

s1 = c1.series[0]

s1.marker.symbol = "triangle"

s1.marker.graphicalProperties.solidFill = "FF0000" # Marker filling

s1.marker.graphicalProperties.line.solidFill = "FF0000" # Marker outline

s1.graphicalProperties.line.noFill = True

s2 = c1.series[1]

s2.graphicalProperties.line.solidFill = "00AAAA"

s2.graphicalProperties.line.dashStyle = "sysDot"

s2.graphicalProperties.line.width = 100050 # width in EMUs

s2 = c1.series[2]

s2.smooth = True # Make the line smooth

ws.add_chart(c1, "A10")

from copy import deepcopy

stacked = deepcopy(c1)

stacked.grouping = "stacked"

stacked.title = "Stacked Line Chart"

ws.add_chart(stacked, "A27")

percent_stacked = deepcopy(c1)

percent_stacked.grouping = "percentStacked"

percent_stacked.title = "Percent Stacked Line Chart"

ws.add_chart(percent_stacked, "A44")

# Chart with date axis

c2 = LineChart()

c2.title = "Date Axis"

c2.style = 12

c2.y_axis.title = "Size"

c2.y_axis.crossAx = 500

c2.x_axis = DateAxis(crossAx=100)

c2.x_axis.number_format = 'd-mmm'

c2.x_axis.majorTimeUnit = "days"

c2.x_axis.title = "Date"

c2.add_data(data, titles_from_data=True)

dates = Reference(ws, min_col=1, min_row=2, max_row=7)

c2.set_categories(dates)

ws.add_chart(c2, "A61")

wb.save("line.xlsx")
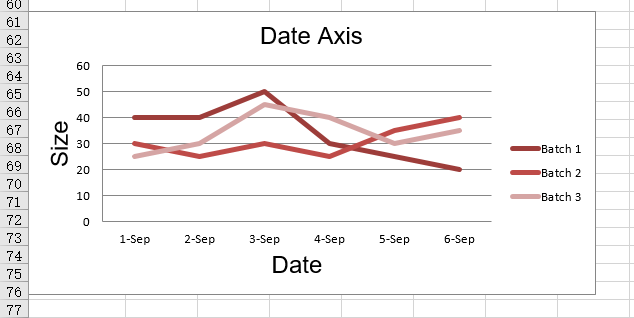
运行结果
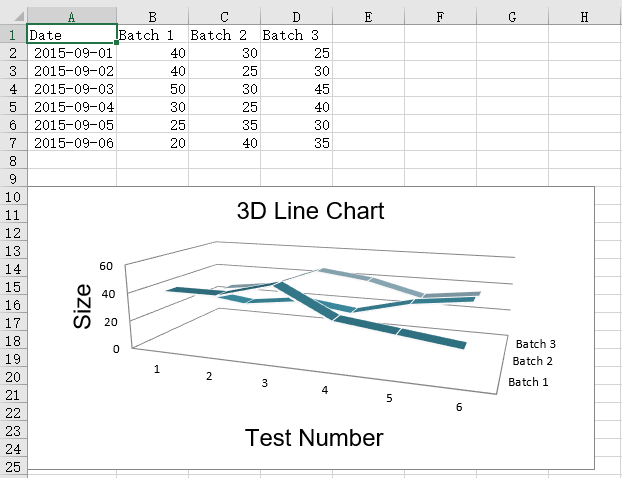
3D折线图
在三维图中,第三个轴和这个系列的图例是一样的
from datetime import date

from openpyxl import Workbook

from openpyxl.chart import (

    LineChart3D,

    Reference,

)

from openpyxl.chart.axis import DateAxis

wb = Workbook()

ws = wb.active

rows = [

    ['Date', 'Batch 1', 'Batch 2', 'Batch 3'],

    [date(2015,9, 1), 40, 30, 25],

    [date(2015,9, 2), 40, 25, 30],

    [date(2015,9, 3), 50, 30, 45],

    [date(2015,9, 4), 30, 25, 40],

    [date(2015,9, 5), 25, 35, 30],

    [date(2015,9, 6), 20, 40, 35],

]

for row in rows:

    ws.append(row)

c1 = LineChart3D()

c1.title = "3D Line Chart"

c1.legend = None

c1.style = 15

c1.y_axis.title = 'Size'

c1.x_axis.title = 'Test Number'

data = Reference(ws, min_col=2, min_row=1, max_col=4, max_row=7)

c1.add_data(data, titles_from_data=True)

ws.add_chart(c1, "A10")

wb.save("line3D.xlsx")
运行结果
Python第三方库之openpyxl(6)的更多相关文章
- Python第三方库之openpyxl(3)
Python第三方库之openpyxl(3) 区域图 区域图类似于折线图,绘图线下面的区域会被填充,通过将分组设置为“standard”.“stacked”或“percentStacked”,可以获得 ...
- Python第三方库之openpyxl(12)
Python第三方库之openpyxl(12) 地面天气图 在工作表上的列或行中安排的数据可以在一个表中绘制.当您想要在两组数据之间找到最佳组合时,一个表面图表是有用的.正如在地形图中一样,颜色和图案 ...
- Python第三方库之openpyxl(11)
Python第三方库之openpyxl(11) Stock Charts(股票图) 在工作表上按特定顺序排列的列或行中的数据可以在股票图表中绘制.正如其名称所暗示的,股票图表通常被用来说明股价的波动. ...
- Python第三方库之openpyxl(10)
Python第三方库之openpyxl(10) 雷达图 在工作表上的列或行中排列的数据可以在雷达图中绘制.雷达图比较多个数据系列的总值.它实际上是一个圆形x轴上的面积图的投影.有两种类型的雷达图:st ...
- Python第三方库之openpyxl(9)
Python第三方库之openpyxl(9) 油炸圈饼图 甜甜圈图表与饼图相似,只是他们用的是环而不是圆.他们还可以将几个系列的数据绘制成同心环 from openpyxl import Workbo ...
- Python第三方库之openpyxl(8)
Python第三方库之openpyxl(8) 饼图 饼图将数据绘制成一个圆片,每个片代表整体的百分比.切片是按顺时针方向绘制的,0在圆的顶部.饼图只能取一组数据.该图表的标题将默认为该系列的标题. 2 ...
- Python第三方库之openpyxl(7)
Python第三方库之openpyxl(7) 散点图 散点或xy图表类似于一些折线图.主要的区别在于,一个系列的值被绘制在另一个值上.当值未排序时,这是有用的. from openpyxl impor ...
- Python第三方库之openpyxl(5)
Python第三方库之openpyxl(5) 气泡图 气泡图类似于散点图,但使用第三个维度来确定气泡的大小,图表可以包括多个项目 from openpyxl import Workbook from ...
- Python第三方库之openpyxl(4)
Python第三方库之openpyxl(4) 2D柱状图 在柱状图中,值被绘制成水平条或竖列. 垂直.水平和堆叠柱状图. 注意:以下设置影响不同的图表类型 1.在垂直和水平条形图之间切换,分别设置为c ...
随机推荐
- 一次Socket通信联想到的Zookeeper源码实现
最近做一个短信平台,要接入短信网关平台,网关平台使用C,短信平台属于公司内部对外应用,使用Java开发,两边通信采用TCP/IP协议
- Docker快速构建Redis集群(cluster)
Docker快速构建Redis集群(cluster) 以所有redis实例运行在同一台宿主机上为例子 搭建步骤 redis集群目录清单 . ├── Dockerfile ├── make_master ...
- mui开发中获取单选按钮、复选框的值
js获取单选按钮的值 function getVals(){ var res = getRadioRes('rds'); if(res == null){mui.toast('请选择'); retur ...
- GreenDao3.2的使用
原文:http://blog.csdn.net/qq_30379689/article/details/54410838 GreenDao3.2的使用,爱不释手 本篇文章包括以下内容: 前言 Gree ...
- sql 函数 coalesce
SQL函数 coalesce 功能: 返回参数中第一个非null的值. 语法: coalesce(参数1,参数2,参数3,...);返回第一个非null的值. 一般情况下会与Nullif()函数一起使 ...
- 快学UiAutomator创建第一个实例
工具准备 一.准备好java环境(JDK)和安卓环境(SDK.ADT)jdk1.6+ \eclipse\SDK \ADT详情百度,安装java环境 二.打开eclipse 三.创建步骤: 右键新建== ...
- JAVA中IP和整数相互转化(含有掩码的计算)
import java.net.InetAddress;/** * 用于IP和整数之间的相互转换 * @author Andy.Wang * */public class IPv4Util { ...
- spark 省份次数统计实例
//统计access.log文件里面IP地址对应的省份,并把结果存入到mysql package access1 import java.sql.DriverManager import org.ap ...
- MySQL查询当天数据以及大量查询时提升速度
select * from 表名 where to_days(字段名) = to_days(now()) 一.数据库设计方面1.对查询进行优化,应尽量避免全表扫描,首先应考虑在 where 及 ord ...
- ueditor1.4.3.all.js报错
.replace( /<[^>/]+>/g, '' ) 转义符问题! 修改为: .replace( /<[^>\/]+>/g, '' )
