kubernetes监控-prometheus(十六)
监控方案
|
cAdvisor+Heapster+InfluxDB+Grafana |
Y |
简单 |
容器监控 |
|
cAdvisor/exporter+Prometheus+Grafana |
Y |
扩展性好 |
容器,应用,主机全方面监控 |
Prometheus+Grafana是监控告警解决方案里的后起之秀
通过各种exporter采集不同维度的监控指标,并通过Prometheus支持的数据格式暴露出来,Prometheus定期pull数据并用Grafana展示,异常情况使用AlertManager告警。
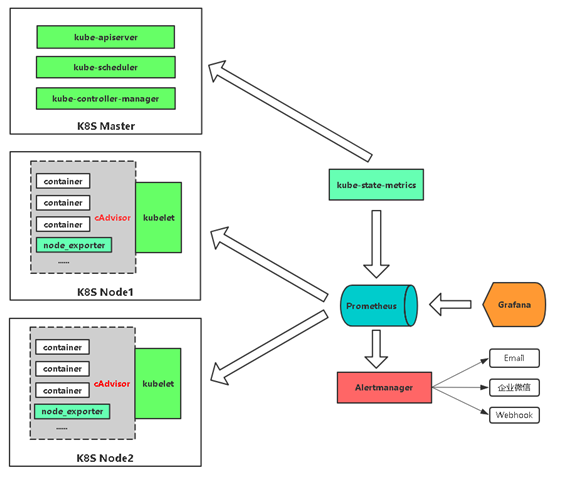
通过cadvisor采集容器、Pod相关的性能指标数据,并通过暴露的/metrics接口用prometheus抓取
通过prometheus-node-exporter采集主机的性能指标数据,并通过暴露的/metrics接口用prometheus抓取
应用侧自己采集容器中进程主动暴露的指标数据(暴露指标的功能由应用自己实现,并添加平台侧约定的annotation,平台侧负责根据annotation实现通过Prometheus的抓取)
通过kube-state-metrics采集k8s资源对象的状态指标数据,并通过暴露的/metrics接口用prometheus抓取
通过etcd、kubelet、kube-apiserver、kube-controller-manager、kube-scheduler自身暴露的/metrics获取节点上与k8s集群相关的一些特征指标数据。
实现思路
|
监控指标 |
具体实现 |
举例 |
|
Pod性能 |
cAdvisor |
容器CPU,内存利用率 |
|
Node性能 |
node-exporter |
节点CPU,内存利用率 |
|
K8S资源对象 |
kube-state-metrics |
Pod/Deployment/Service |
k8s中部署prometheus
官网:https://prometheus.io
下载yaml文件:https://github.com/kubernetes/kubernetes/tree/master/cluster/addons/prometheus
修改yaml文件
#使用nfs存储

[root@localhost prometheus]# kubectl get storageclass

NAME                  PROVISIONER      AGE

managed-nfs-storage   fuseim.pri/ifs   9d

[root@localhost prometheus]# sed -i s/standard/managed-nfs-storage/ prometheus-statefulset.yaml

#修改service使用NOdePort
[root@localhost prometheus]# vim prometheus-service.yaml
。。。。
spec:
  type: NodePort
  ports:
    - name: http
      port: 9090
      protocol: TCP
      targetPort: 9090
  selector:
    k8s-app: prometheus
启动prometheus
[root@localhost prometheus]# kubectl apply -f prometheus-rbac.yaml

serviceaccount/prometheus created

clusterrole.rbac.authorization.k8s.io/prometheus created

clusterrolebinding.rbac.authorization.k8s.io/prometheus created

[root@localhost prometheus]# kubectl apply -f prometheus-configmap.yaml

configmap/prometheus-config created

[root@localhost prometheus]# kubectl apply -f prometheus-statefulset.yaml

statefulset.apps/prometheus created

[root@localhost prometheus]# vim prometheus-service.yaml

[root@localhost prometheus]# kubectl apply -f prometheus-service.yaml

service/prometheus created
查看
[root@localhost prometheus]# kubectl get pod,svc -n kube-system

NAME                                        READY   STATUS    RESTARTS   AGE

pod/coredns-5b8c57999b-z9jh8                /     Running             16d

pod/kubernetes-dashboard-644c96f9c6-bvw8w   /     Running             16d

pod/prometheus-                            /     Running             2m40s

NAME                           TYPE        CLUSTER-IP   EXTERNAL-IP   PORT(S)          AGE

service/kube-dns               ClusterIP   10.0.0.2     <none>        /UDP,/TCP    16d

service/kubernetes-dashboard   NodePort    10.0.0.84    <none>        :/TCP    16d

service/prometheus             NodePort    10.0.0.89    <none>        :/TCP   39s

[root@localhost prometheus]# kubectl get pv,pvc -n kube-system

NAME                                                                                                 CAPACITY   ACCESS MODES   RECLAIM POLICY   STATUS   CLAIM                                      STORAGECLASS          REASON   AGE

persistentvolume/kube-system-prometheus-data-prometheus--pvc-0e92f36c-8d9e-11e9-b018-525400828c1f   16Gi       RWO            Delete           Bound    kube-system/prometheus-data-prometheus-   managed-nfs-storage            25m

NAME                                                 STATUS   VOLUME                                                                              CAPACITY   ACCESS MODES   STORAGECLASS          AGE

persistentvolumeclaim/prometheus-data-prometheus-   Bound    kube-system-prometheus-data-prometheus--pvc-0e92f36c-8d9e-11e9-b018-525400828c1f   16Gi       RWO            managed-nfs-storage   25m
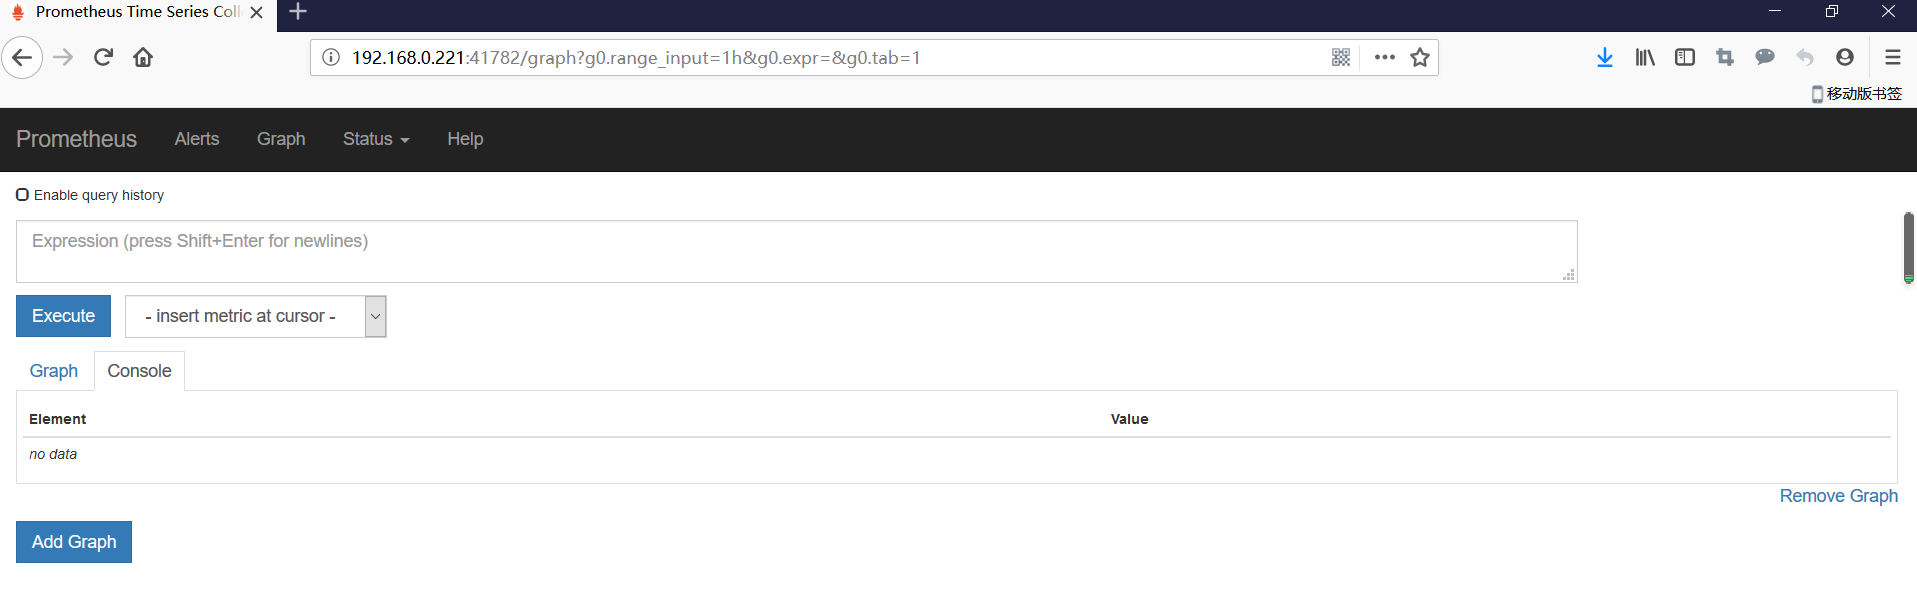
访问
部署grafana
[root@localhost prometheus]# cat grafana.yaml

apiVersion: apps/v1

kind: StatefulSet

metadata:

  name: grafana

  namespace: kube-system

spec:

  serviceName: "grafana"

  replicas: 1

  selector:

    matchLabels:

      app: grafana

  template:

    metadata:

      labels:

        app: grafana

    spec:

      containers:

        - name: grafana

          image: grafana/grafana

          resources:

            limits:

              cpu: 100m

              memory: 256Mi

            requests:

              cpu: 100m

              memory: 256Mi

          volumeMounts:

            - name: grafana-data

              mountPath: /var/lib/grafana

              subPath: grafana

      securityContext:

        fsGroup: 472

        runAsUser: 472

  volumeClaimTemplates:

  - metadata:

      name: grafana-data

    spec:

      storageClassName: managed-nfs-storage

      accessModes:

        - ReadWriteOnce

      resources:

        requests:

          storage: "1Gi"

---

apiVersion: v1

kind: Service

metadata:

  name: grafana

  namespace: kube-system

spec:

  type: NodePort

  ports:

  - port: 80

    targetPort: 3000

    nodePort: 30007

  selector:

    app: grafana

[root@localhost prometheus]# kubectl apply -f grafana.yaml

statefulset.apps/grafana created

service/grafana created

[root@localhost prometheus]# kubectl get pod,svc -n kube-system

NAME                                        READY   STATUS    RESTARTS   AGE

pod/coredns-5b8c57999b-z9jh8                1/1     Running   1          17d

pod/grafana-0                               1/1     Running   0          45s

pod/kubernetes-dashboard-644c96f9c6-bvw8w   1/1     Running   1          17d

pod/prometheus-0                            2/2     Running   0          25h

NAME                           TYPE        CLUSTER-IP   EXTERNAL-IP   PORT(S)          AGE

service/grafana                NodePort    10.0.0.78    <none>        80:30007/TCP     44s

service/kube-dns               ClusterIP   10.0.0.2     <none>        53/UDP,53/TCP    17d

service/kubernetes-dashboard   NodePort    10.0.0.84    <none>        443:30001/TCP    17d

service/prometheus             NodePort    10.0.0.89    <none>        9090:41782/TCP   25h
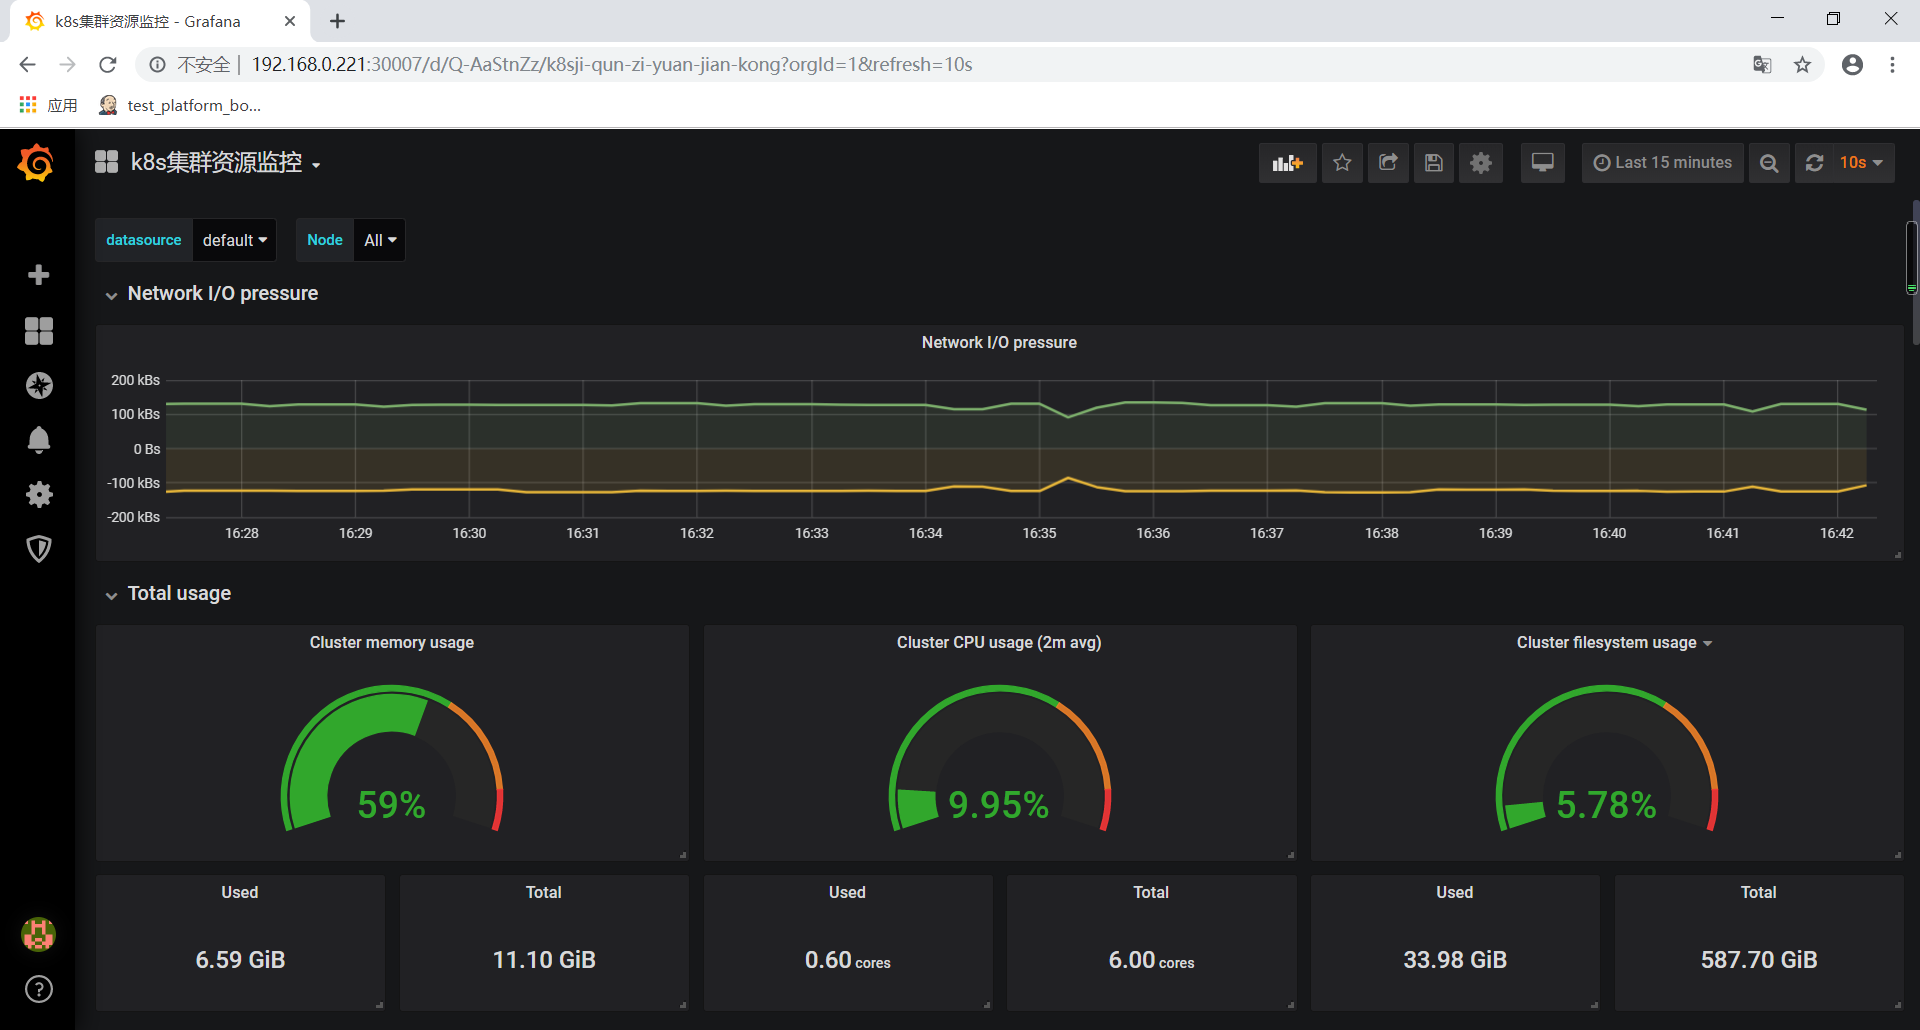
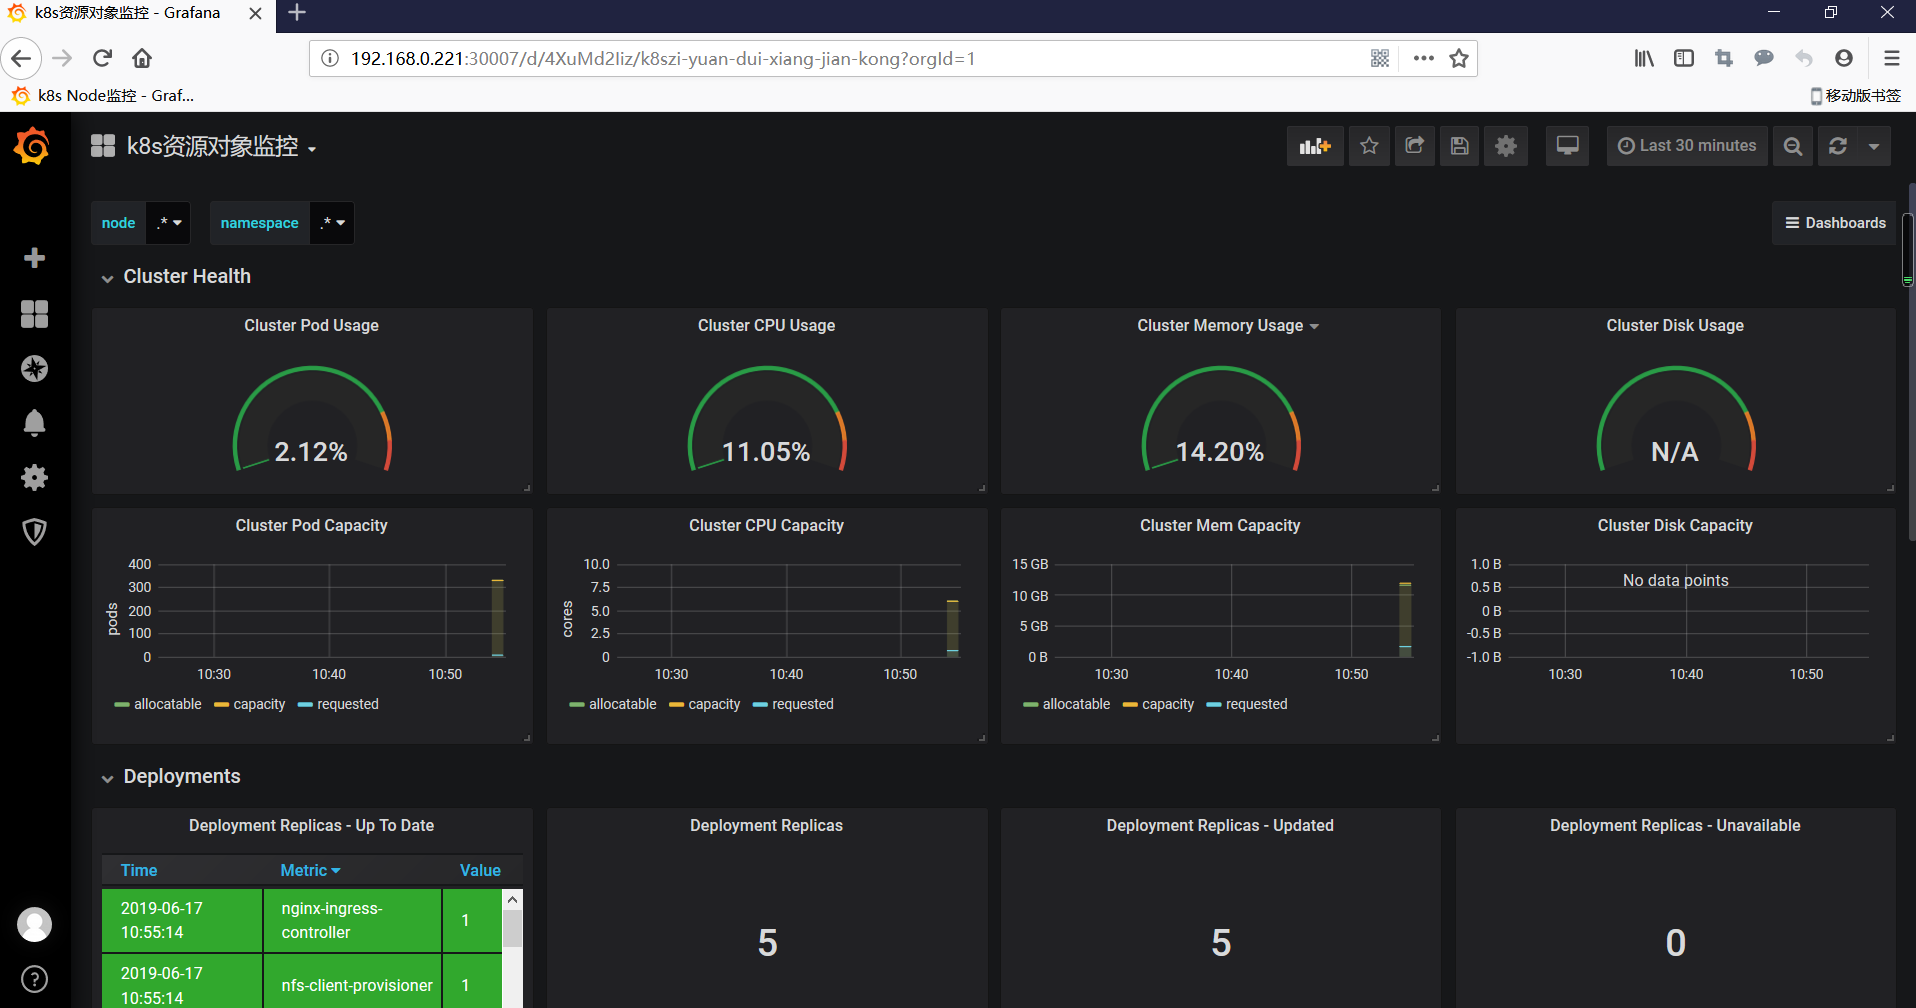
访问

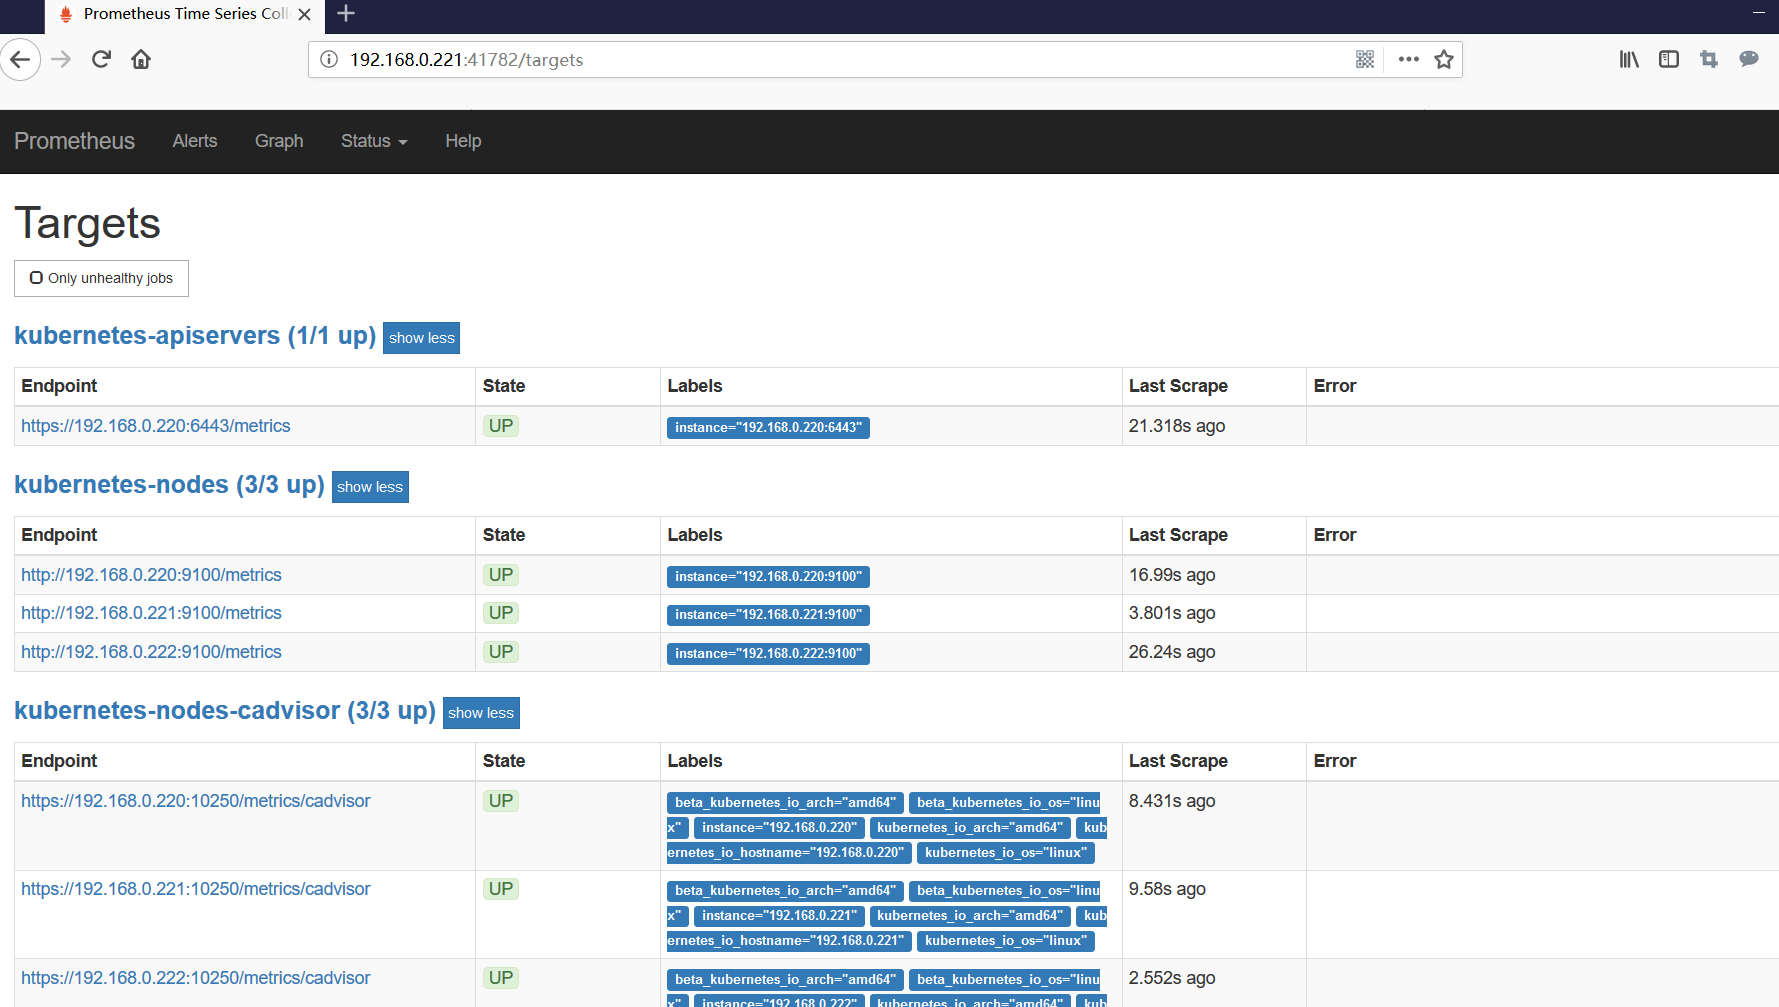
监控k8s集群中的pod
kubelet的节点使用cAdvisor提供的metrics接口获取该节点所有容器相关的性能指标数据。
暴露接口地址:
https://NodeIP:10255/metrics/cadvisor
https://NodeIP:10250/metrics/cadvisor
导入grafana模板
https://grafana.com/grafana/download
集群资源监控:3119
监控k8s集群中的node
使用文档:https://prometheus.io/docs/guides/node-exporter/
GitHub:https://github.com/prometheus/node_exporter
exporter列表:https://prometheus.io/docs/instrumenting/exporters/
所有node节点部署node_exporter
wget https://github.com/prometheus/node_exporter/releases/download/v0.17.0/node_exporter-0.17.0.linux-amd64.tar.gz

tar zxf node_exporter-0.17..linux-amd64.tar.gz

mv node_exporter-0.17..linux-amd64 /usr/local/node_exporter

cat <<EOF >/usr/lib/systemd/system/node_exporter.service

[Unit]

Description=https://prometheus.io

[Service]

Restart=on-failure

ExecStart=/usr/local/node_exporter/node_exporter --collector.systemd --collector.systemd.unit-whitelist=(docker|kubelet|kube-proxy|flanneld).service

[Install]

WantedBy=multi-user.target

EOF

systemctl daemon-reload

systemctl enable node_exporter

systemctl restart node_exporter
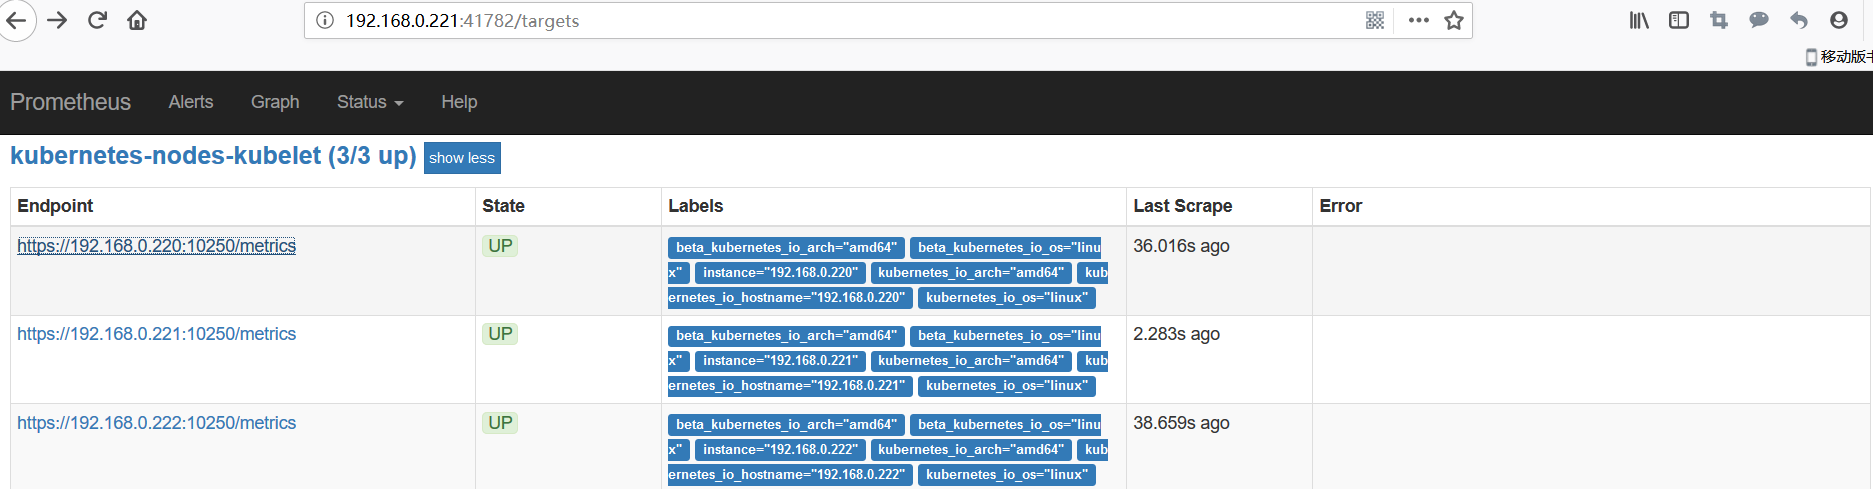
修改prometheus-configmap.yaml,并重新部署

查看prometheus是否收集到kubernetes-nodes
导入grafana模板
集群资源监控:9276

监控k8s资源对象
https://github.com/kubernetes/kube-state-metrics
kube-state-metrics是一个简单的服务,它监听Kubernetes API服务器并生成有关对象状态的指标。它不关注单个Kubernetes组件的运行状况,而是关注内部各种对象的运行状况,例如部署,节点和容器。
[root@localhost prometheus]# kubectl apply -f kube-state-metrics-rbac.yaml

serviceaccount/kube-state-metrics created

clusterrole.rbac.authorization.k8s.io/kube-state-metrics created

role.rbac.authorization.k8s.io/kube-state-metrics-resizer created

clusterrolebinding.rbac.authorization.k8s.io/kube-state-metrics created

rolebinding.rbac.authorization.k8s.io/kube-state-metrics created

[root@localhost prometheus]# vim kube-state-metrics-deployment.yaml

[root@localhost prometheus]# kubectl apply -f kube-state-metrics-deployment.yaml

deployment.apps/kube-state-metrics created

configmap/kube-state-metrics-config created

[root@localhost prometheus]# kubectl apply -f kube-state-metrics-service.yaml

service/kube-state-metrics created
导入grafana模板
集群资源监控:6417
在K8S中部署Alertmanager
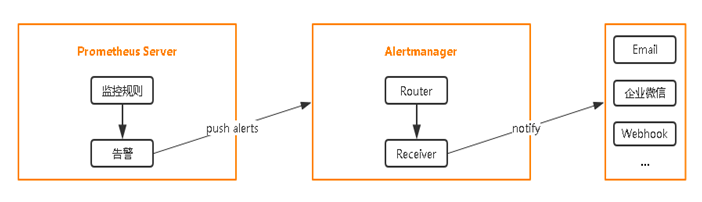
部署Alertmanager
[root@localhost prometheus]# sed -i s/standard/managed-nfs-storage/ alertmanager-pvc.yaml

[root@localhost prometheus]# kubectl apply -f  alertmanager-configmap.yaml

configmap/alertmanager-config created

[root@localhost prometheus]# kubectl apply -f  alertmanager-pvc.yaml

persistentvolumeclaim/alertmanager created

[root@localhost prometheus]# kubectl apply -f  alertmanager-deployment.yaml

deployment.apps/alertmanager created

[root@localhost prometheus]# kubectl apply -f  alertmanager-service.yaml

service/alertmanager created

[root@localhost prometheus]# kubectl get pod -n kube-system

NAME                                    READY   STATUS    RESTARTS   AGE

alertmanager-6b5bbd5bd4-lgjn8           /     Running             95s

coredns-5b8c57999b-z9jh8                /     Running             20d

grafana-                               /     Running             2d22h

kube-state-metrics-f86fd9f4f-j4rdc      /     Running             3h2m

kubernetes-dashboard-644c96f9c6-bvw8w   /     Running             20d

prometheus-                            /     Running             4d
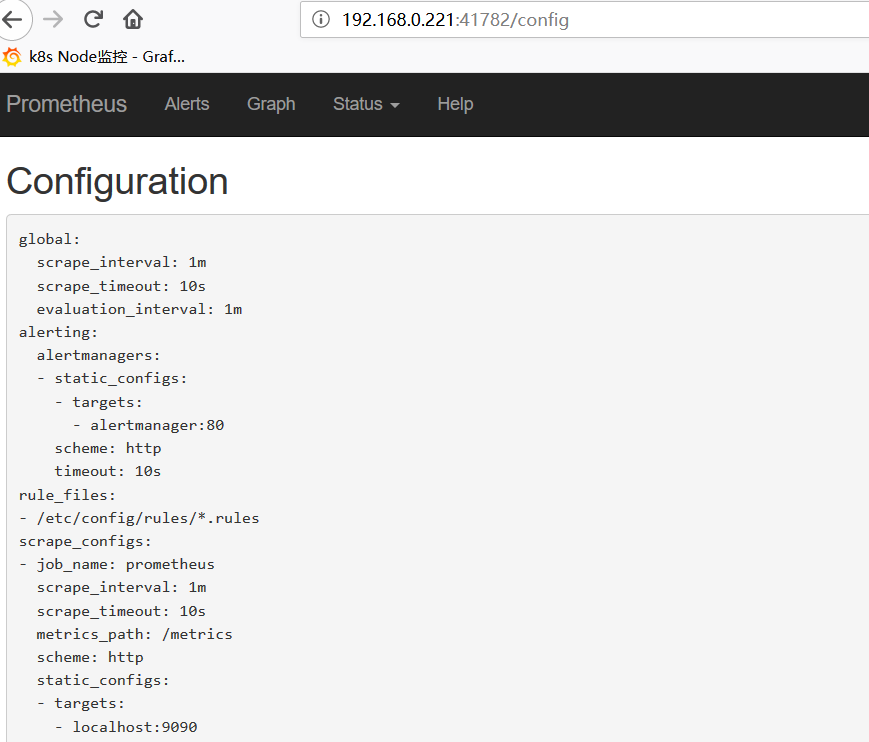
配置Prometheus与Alertmanager通信
[root@localhost prometheus]# vim prometheus-configmap.yaml

。。。。

    alerting:

      alertmanagers:

      - static_configs:

          - targets: ["alertmanager:80"]
[root@localhost prometheus]# kubectl apply -f prometheus-configmap.yaml
configmap/prometheus-config configured
配置告警
prometheus指定rules目录
configmap存储告警规则
[root@localhost prometheus]# cat prometheus-rules.yaml

apiVersion: v1

kind: ConfigMap

metadata:

  name: prometheus-rules

  namespace: kube-system

data:

  general.rules: |

    groups:

    - name: general.rules

      rules:

      - alert: InstanceDown

        expr: up ==

        for: 1m

        labels:

          severity: error

        annotations:

          summary: "Instance {{ $labels.instance }} 停止工作"

          description: "{{ $labels.instance }} job {{ $labels.job }} 已经停止5分钟以上."

  node.rules: |

    groups:

    - name: node.rules

      rules:

      - alert: NodeFilesystemUsage

        expr:  - (node_filesystem_free_bytes{fstype=~"ext4|xfs"} / node_filesystem_size_bytes{fstype=~"ext4|xfs"} * ) >

        for: 1m

        labels:

          severity: warning

        annotations:

          summary: "Instance {{ $labels.instance }} : {{ $labels.mountpoint }} 分区使用率过高"

          description: "{{ $labels.instance }}: {{ $labels.mountpoint }} 分区使用大于80% (当前值: {{ $value }})"

      - alert: NodeMemoryUsage

        expr:  - (node_memory_MemFree_bytes+node_memory_Cached_bytes+node_memory_Buffers_bytes) / node_memory_MemTotal_bytes *  >

        for: 1m

        labels:

          severity: warning

        annotations:

          summary: "Instance {{ $labels.instance }} 内存使用率过高"

          description: "{{ $labels.instance }}内存使用大于80% (当前值: {{ $value }})"

      - alert: NodeCPUUsage

        expr:  - (avg(irate(node_cpu_seconds_total{mode="idle"}[5m])) by (instance) * ) >

        for: 1m

        labels:

          severity: warning

        annotations:

          summary: "Instance {{ $labels.instance }} CPU使用率过高"

          description: "{{ $labels.instance }}CPU使用大于60% (当前值: {{ $value }})"

[root@localhost prometheus]# kubectl apply -f prometheus-rules.yaml

configmap/prometheus-rules created
configmap挂载到容器rules目录
[root@localhost prometheus]# vim prometheus-statefulset.yaml

......

          volumeMounts:

            - name: config-volume

              mountPath: /etc/config

            - name: prometheus-data

              mountPath: /data

              subPath: ""

            - name: prometheus-rules

              mountPath: /etc/config/rules

      terminationGracePeriodSeconds:

      volumes:

        - name: config-volume

          configMap:

            name: prometheus-config

        - name: prometheus-rules

          configMap:

            name: prometheus-rules

......
怎加alertmanager的告警配置
[root@localhost prometheus]# cat alertmanager-configmap.yaml

apiVersion: v1

kind: ConfigMap

metadata:

  name: alertmanager-config

  namespace: kube-system

  labels:

    kubernetes.io/cluster-service: "true"

    addonmanager.kubernetes.io/mode: EnsureExists

data:

  alertmanager.yml: |

    global:

      resolve_timeout: 5m

      smtp_smarthost: 'smtp.163.com:25'

      smtp_from: 'xxxxx@163.com'

      smtp_auth_username: 'xxxxx@163.com'

      smtp_auth_password: 'xxxxx'

    receivers:

    - name: default-receiver

      email_configs:

      - to: "xxxxx@qq.com"

    route:

      group_interval: 1m

      group_wait: 10s

      receiver: default-receiver

      repeat_interval: 1m

[root@localhost prometheus]# kubectl apply -f alertmanager-configmap.yaml

configmap/alertmanager-config configured
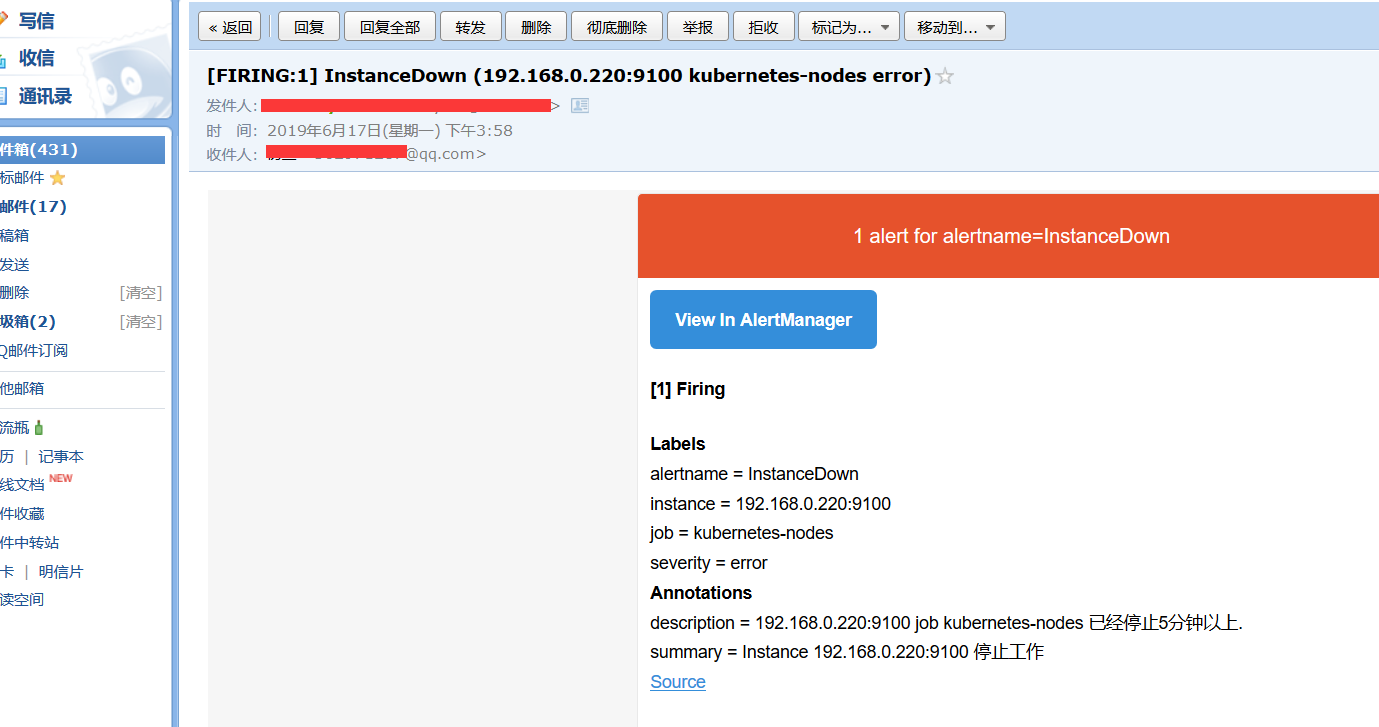
邮件告警
kubernetes监控-prometheus(十六)的更多相关文章
- kubernetes监控prometheus配置项解读
前言 文中解决两个问题: 1. kubernetes官方推荐的监控 prometheus 的配置文件, 各项是什么含义 2. 配置好面板之后, 如换去配置 grafana 面板 当然这两个问题网上都有 ...
- kubernetes监控--Prometheus
本文基于kubernetes 1.5.2版本编写 kube-state-metrics kubectl create ns monitoring kubectl create sa -n monito ...
- Kubernetes 监控--Prometheus 高可用: Thanos
前面我们已经学习了 Prometheus 的使用,了解了基本的 PromQL 语句以及结合 Grafana 来进行监控图表展示,通过 AlertManager 来进行报警,这些工具结合起来已经可以帮助 ...
- Kubernetes 监控--Prometheus
在早期的版本中 Kubernetes 提供了 heapster.influxDB.grafana 的组合来监控系统,在现在的版本中已经移除掉了 heapster,现在更加流行的监控工具是 Promet ...
- kubernetes实战(二十六):kubeadm 安装 高可用 k8s v1.16.x dashboard 2.x
1.基本配置 基本配置.内核升级.基本服务安装参考https://www.cnblogs.com/dukuan/p/10278637.html,或者参考<再也不踩坑的Kubernetes实战指南 ...
- kubernetes实战(二十八):Kubernetes一键式资源管理平台Ratel安装及使用
1. Ratel是什么? Ratel是一个Kubernetes资源平台,基于管理Kubernetes的资源开发,可以管理Kubernetes的Deployment.DaemonSet.Stateful ...
- Kubernetes 监控方案之 Prometheus Operator(十九)
目录 一.Prometheus 介绍 1.1.Prometheus 架构 1.2.Prometheus Operator 架构 二.Helm 安装部署 2.1.Helm 客户端安装 2.2.Tille ...
- Spring Boot 2.X(十六):应用监控之 Spring Boot Actuator 使用及配置
Actuator 简介 Actuator 是 Spring Boot 提供的对应用系统的自省和监控功能.通过 Actuator,可以使用数据化的指标去度量应用的运行情况,比如查看服务器的磁盘.内存.C ...
- kubernetes(k8s) Prometheus+grafana监控告警安装部署
主机数据收集 主机数据的采集是集群监控的基础:外部模块收集各个主机采集到的数据分析就能对整个集群完成监控和告警等功能.一般主机数据采集和对外提供数据使用cAdvisor 和node-exporter等 ...
随机推荐
- cordova之旅之初识
emmmm, 一直徘徊在移动端采用什么技术比较好,一直也没有找到,让我为了一个移动端而去学习一波react全家桶是不现实的操作,反观自己的技术栈,通过长时间的对比和剖析找到了入口点,不管了先会写再说吧 ...
- 洛谷P2899 [USACO08JAN]手机网络Cell Phone Network
P2899 [USACO08JAN]手机网络Cell Phone Network 题目描述 Farmer John has decided to give each of his cows a cel ...
- 4.Python的不堪一击到初学乍练(列表,元组)
Python(列表,元组) 一.列表 列表初识 列表是python的基础数据类型之一,其他编程语言也有类似的数据类型. 比如JS中的数组, java中的数组等等,它是以[ ]括起来, 每个元素用&qu ...
- PHP 扩展篇 _ 持续更新
记住这个网站:http://pecl.php.net/ PHP-Redis扩展更新时间:2019/05/06 PHP安装Redis 1:下载目前最新版的redis插件 wget http://pecl ...
- STP-11-多生成树:IEEE 802.1s
IEEE802.1s多生成树(MultipleSpanningTrees,MST)有时也称为多STP(MultipleSTP,MSTP),它定义了在使用802.1QVLAN网络中,部署多实例STP的标 ...
- [题解](双向bfs)hdu_3085_Nightmare Ⅱ
发现直接搜索比较麻烦,但是要同时两个人一起走容易想到双向bfs,比较普通, 在判断是否碰到ghost时只要比较两点的曼哈顿距离大小和step*2(即ghost扩散的距离)即可,仔细思考也是可以想到的 ...
- 【手撸一个ORM】第一步、实体约定和描述
一.约定 数据实体必须实现 IEntity 接口,该接口定义了一个int类型的Id属性,既每个实体必须有一个名称为Id的自增主键. 若数据表的主键列名称不是Id,可以通过 [MyKey("主 ...
- Django使用网站图标
默认情况下,浏览器访问一个网站的时候,同时还会向服务器请求“/favicon.ico”这个URL,目的是获取网站的图标. 若是没有配置的话,Django就会返回一个404错误,并且浏览器接收到这个40 ...
- hihoCoder 1383 : The Book List 北京网络赛
http://hihocoder.com/problemset/problem/1383?sid=950389 #1383 : The Book List 时间限制:1000ms 单点时限:1000m ...
- (转)Nginx/Apache服务连接数梳理
Nginx/Apache服务连接数梳理 原文:http://www.cnblogs.com/kevingrace/p/6211542.html 统计连接数,使用netstat命令或ss命令都可以1)统 ...