Machine Learning With Go 第4章:回归
4 回归
之前有转载过一篇文章:容量推荐引擎:基于吞吐量和利用率的预测缩放,里面用到了基本的线性回归来预测容器的资源利用情况。后面打算学一下相关的知识,译自:Machine Learning With Go
我们将探究的第一组机器学习技术通常被称为回归(regression),我们可以将回归理解为一个变量(例如销售额)的变化是如何影响到其他变量(如用户数)的。对于机器学习技术来说,这是一个很好的开端,它们是构成其他更加复杂技术的基础。
机器学习中的回归技术通常会注重评估连续值(如股票价格、温度或疾病进展等)。下一章讨论的归类(Classification)则会注重离散值,或离散的类集合(如欺诈/非欺诈、坐下/起立/跑动,或热狗/非热狗等)。正如上面提到的,回归技术会贯彻到机器学习中,并作为归类算法的一部分,但本章中,我们将会注重其基本的应用--预测连续值。
理解回归模型术语
正如前面提到的,回归本身是一个分析一个变量和另一个变量之间关系的过程,但在机器学习中还用到了一些术语来描述这些变量以及各种类型的回归和与回归有关的过程:
- 响应(response)或因变量(dependent variable):这些术语可以互用,表示基于其他一个或多个变量来预测的变量,通常使用y表示
- 解释变量(Explanatory variables)、自变量(independent variables)、特征(features)、属性(attributes)或回归系数(regressors):这些术语可以互用,表示用于预测响应的变量,通常使用x或x1 , x2表示
- 线性回归:该类型的回归会假设因变量会线性依赖自变量(即遵循直线方程)
- 非线性回归:该类型的回归会假设因变量会非线性依赖自变量(如多项式或指数)
- 多元回归(Multiple regression:):具有超过一个自变量的回归
- 拟合(Fitting)或训练(training):参数化模型的过程(如回归模型),可以用该模型来预测一个特定的因变量
- 预测:使用参数模型预测因变量的过程(如回归模型)
部分术语会在回归上下文和本书的其他上下文中使用。
线性回归
线性回归是最简单的机器学习模型之一,但不能出于某些原因而忽略该模型。正如前面提到的,它是其他模型的基础,且有一些非常重要的优势。
正如在本书中讨论的,完整性在机器学习应用中非常重要,模型越简单,解释性越强,则越容易维护其完整性。此外,如果模型简单且具有解释性,那么就可以帮助理解变量之间的推断关系,并简化开发过程中的检查工作。
Mike Lee Williams (来自Fast Forward Labs的)说过:
未来是算法,可解释模型在人类和智能机器之间建立了一种更安全、更高效、最终更具协作性的关系。
线性回归模型是可解释的,因此可以为数据科学提供一种安全且高效的选项。当需要搜索一种可以预测连续变量的模型时,如果数据和相关条件具备,则应该考虑并使用线性回归(或多元线性回归)。
线性回归概述
在线性回归中,我们会尝试使用如下线性方程,使用一个自变量x,对因变量y进行建模:
\]
这里,m为直线的斜率,b为截距。例如,我们想要通过每天访问网站的users对sales进行建模,为了使用线性回归,我们会希望通过确定m和b来让预测公司的销售额:
\]
这样,我们的训练模型就是该参数化函数。通过输入Number of Users 来预测 sales,如下:
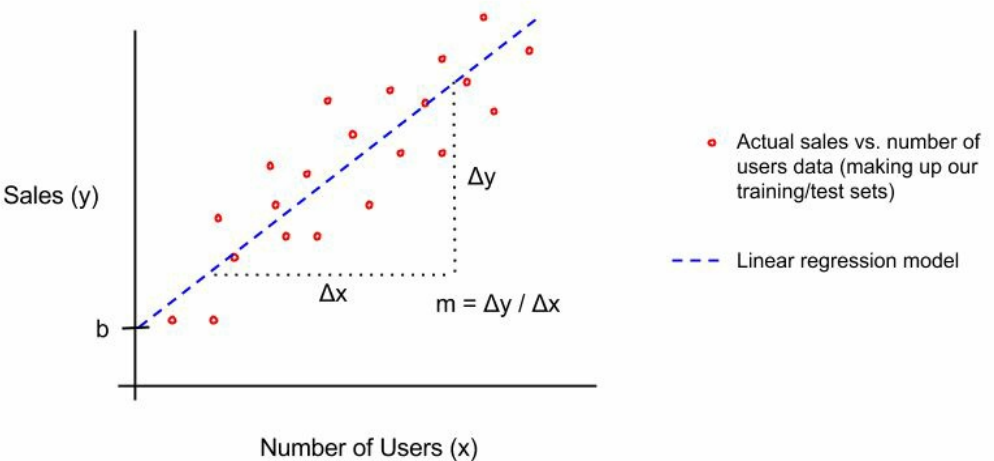
线性回归的训练或拟合需要确定m和b的值,这样得出的公式就有预测响应的能力。有多种方式来确定m和b,但最常见的是普通最小二乘法(ordinary least squares (OLS))。
为了使用OLS来确定m和b,首先为m和b选择一个值来创建第一条示例线(example line)。然后测量每个已知点(如训练集)和示例线之间的垂直距离,这些距离称为误差(errors)或残差(residuals)。下图展示了评估和验证:
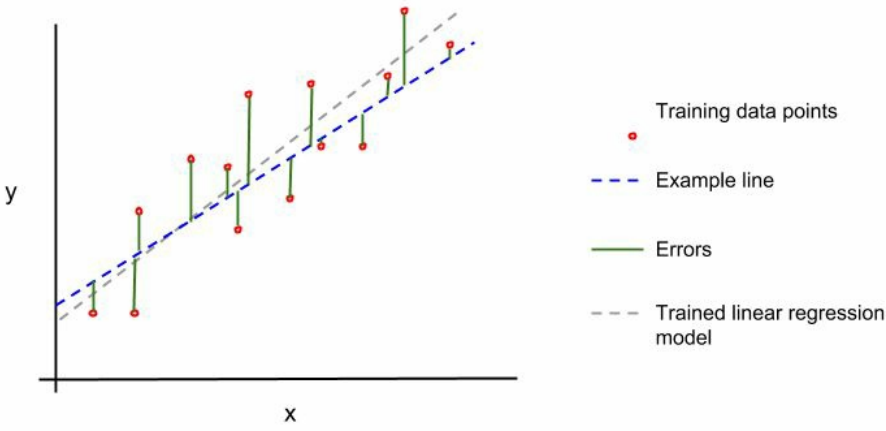
下面,我们计算这些误差平方和:
\]
通过调整m和b来最小化误差的平方和。换句话说,我们训练的线性回归直线是平方和最小的直线。
有很多种方式可以找出误差平方和最小的直线,如通过OLS可以找出并分析这条直线。但最常用的减少误差平方和的优化技术称为梯度下降法(gradient descent)。相比于分析法,这种方法更容易实现,且便于计算(如内存),也更加灵活。
可以说,线性回归和其他回归的实现都利用梯度下降来拟合或训练线性回归线。实际上,梯度下降法在机器学习中无处不在,由此可以产生更加复杂的模型技术,如深度学习。
梯度下降法
梯度下降法有很多变种,且在机器学习世界中无处不在。最重要的是,它们用于确定线性或逻辑回归等算法的最佳系数,同时也在更复杂的技术中发挥着重要作用(至少部分基于线性/逻辑回归(如神经网络))。
梯度下降法的一般思想是确定某些参数的变化方向和幅度,这些参数将使预测曲线朝着正确的方向移动,以优化某些度量(如误差)。想象站在某个地方,如果要向较低的位置移动,则需要朝向下的方向移动。这基本上就是梯度下降算法在优化参数时所做的事情。
让我们看一下所谓的随机梯度下降(SGD),这是一种增量的梯度下降,从而对这个过程有更多直觉上的了解。我们在第5章"分类"的逻辑回归实现中使用了SGD。在该示例中,我们实现了对逻辑回归参数的训练或拟合,如下所示:
// logisticRegression fits a logistic regression model

// for the given data.

func logisticRegression(features *mat64.Dense, labels []float64, numSteps int, learningRate f)

// Initialize random weights.

_, numWeights := features.Dims()

weights := make([]float64, numWeights)

s := rand.NewSource(time.Now().UnixNano())

r := rand.New(s)

for idx, _ := range weights {

  weights[idx] = r.Float64()

}

// Iteratively optimize the weights.

for i := 0; i < numSteps; i++ {

  // Initialize a variable to accumulate error for this iteration.

  var sumError float64

  // Make predictions for each label and accumulate error.

  for idx, label := range labels {

      // Get the features corresponding to this label.

      featureRow := mat64.Row(nil, idx, features)

      // Calculate the error for this iteration's weights.

      pred := logistic(featureRow[0]*weights[0] + featureRow[1]*weights[1])

      predError := label - pred

      sumError += math.Pow(predError, 2)

      // Update the feature weights.

      for j := 0; j < len(featureRow); j++ {

          weights[j] += learningRate * predError * pred * (1 - pred) * featureRow[j]

      }

  }

}

return weights

}
// Iteratively optimize the weights注释下面的循环实现了通过SGD来优化逻辑回归参数。下面选择这部分循环来看下到底发生了什么。首先,我们使用当前权重和预测值与理想值(即实际观察值)之间的差值来计算模型的输出:
// Calculate the error for this iteration's weights.

pred := logistic(featureRow[0]*weights[0] + featureRow[1]*weights[1])

predError := label - pred

sumError += math.Pow(predError, 2)
根据SGD,我们将根据如下公式来计算参数(在本例中为权weights)的更新:
\[update=leaning~rate\times~gradient~of~the~parameters
\]gradient是cost函数的数学梯度。
然后将该更新应用到参数,如下所示:
\[parameter=parameters-update
\]在我们的逻辑回归模型中,计算结果如下:
// Update the feature weights.

for j := 0; j < len(featureRow); j++ {

  weights[j] += learningRate * predError * pred * (1 - pred) * featureRow[j]

}
机器学习中广泛使用了这种类型的SGD,但在某些场景下,这种梯度下降法可能导致过拟合或陷入局部最小值/最大值(而不是寻找全局最优值)。
为了解决这些问题,可以使用一个梯度下降的变种,称为批量梯度下降(batch gradient descent)。在批量梯度下降中,可以基于所有训练数据集中的梯度来计算每个参数更新,而不针对数据集的特定观测值或行。这种方式有助于防止过度拟合,但它也可能很慢,并且存在内存问题,因为需要计算每个参数相对于整个数据集的梯度。微批量梯度下降(Mini-batch gradient descent)是另一个变种,它在试图保持批量梯度下降的某些好处的同时,更易于计算。在微批量梯度下降法中,梯度是在训练数据集的子集上计算的,而不是在整个训练数据集上计算的。
在逻辑回归的场景中,你可能看到过使用梯度上升或下降,梯度上升与梯度下降是一回事,只是cost函数的方向不同而已。更多参见: https://stats.stackexchange.com/questions/261573/using-gradient-ascent-instead-of-gradient-descent-for-logistic-regression
gonum团队已经实现了梯度下降法:
gonum.org/v1/gonum/optimize。文档地址:https://pkg.go.dev/gonum.org/v1/gonum/optimize#GradientDescent
线性回归的假设和缺点
与所有机器学习模型一样,线性回归并不能适用于所有场景,它的前提是假设你的数据之间的关系是确定的:
- 线性关系:线性回归会假设因变量线性依赖自变量(线性方程)。如果这种关系不是线性的,则线性回归可能会表项不佳
- 正态性:假设变量遵循正太分布(看起来像钟形)。本章后面会讨论这种特性以及非正态分布变量下的取舍。
- 非多重共线性:多重共线性是一个特别的术语,它意味着自变量并不是真正独立的,它们会以某种形式相互依赖
- 没有自相关性:自相关性是另一个特别的术语,意味着变量依赖自身或自身的某个版本(如存在某些可预测的时序中)。
- 同方差性:这可能是这一组术语中最特别的一个,但它相对比较简单,且并不需要经常关注。线性回归假设回归线周围的数据的方差与自变量值的方差大致相同。
从技术上讲,为了使用线性回归,需要满足上述所有假设。但最重要的是我们需要知道数据是如何分布的,以及它们是如何表现的。后续在使用线性回归的示例中会深入讨论这些假设。
作为一个数据科学家或分析师,在使用线性回归时需要注意到线性回归的不足:
- 使用特定范围的自变量来训练线性回归模型,在预测该范围外的数据时应该格外小心,因为你的线性回归直线可能并不适用(如,某些极端数值下,因变量可能并不是线性的)。
- 可能为两个并无关联的变量建立了一个线性回归模型。需要确保变量之间有逻辑上的关联性。
- 可能会因为拟合某些特定类型数据中的异常或极端值而偏离回归线,如OLS。有一些方式可以让拟合回归不受异常值的影响,或针对异常值展示出不同的行为,如正交最小二乘法(orthogonal least squares)或岭回归(ridge regression)。
线性回归的例子
为了描述线性回归,让我们创建第一个机器学习模型。下面数据为广告数据,保存格式为.csv:
$ head Advertising.csv

TV,Radio,Newspaper,Sales

230.1,37.8,69.2,22.1

44.5,39.3,45.1,10.4

17.2,45.9,69.3,9.3

151.5,41.3,58.5,18.5

180.8,10.8,58.4,12.9

8.7,48.9,75,7.2

57.5,32.8,23.5,11.8

120.2,19.6,11.6,13.2

8.6,2.1,1,4.8
该数据集包括一系列表示广告媒体属性(TV,Radio和Newspaper)以及对应的销售额(Sales),本例中我们的目标是对销售额(因变量)和广告支出(因变量)进行模型。
分析数据
为了构建模型(或流程),并确保能够对模型的结果进行检查,首先需要对数据进行分析(所有机器学习模型的第一个步骤)。我们需要了解变量是如何分布的,以及变量的范围和可变性。
为了实现该目标,我们将计算第2章矩阵、概率和统计中讨论的汇总数据。这里,我们将使用github.com/go-gota/gota/tree/master/dataframe中的内置方法,一次性计算出数据集中的所有列的汇总信息:
// Open the CSV file.

advertFile, err := os.Open("Advertising.csv")

if err != nil {

    log.Fatal(err)

}

defer advertFile.Close()

// Create a dataframe from the CSV file.

advertDF := dataframe.ReadCSV(advertFile)

// Use the Describe method to calculate summary statistics

// for all of the columns in one shot.

advertSummary := advertDF.Describe()

// Output the summary statistics to stdout.

fmt.Println(advertSummary)
编译并运行后得到如下结果:
$ go build

$ ./myprogram

[7x5] DataFrame

   column   TV         Radio     Newspaper  Sales

0: mean     147.042500 23.264000 30.554000  14.022500

1: stddev   85.854236  14.846809 21.778621  5.217457

2: min      0.700000   0.000000  0.300000   1.600000

3: 25%      73.400000  9.900000  12.600000  10.300000

4: 50%      149.700000 22.500000 25.600000  12.900000

5: 75%      218.500000 36.500000 45.100000  17.400000

6: max      296.400000 49.600000 114.000000 27.000000

   <string> <float>    <float>   <float>    <float>
上面以表格形式打印出所有的汇总数据,包括平均值、标准偏差、最小值、最大值、25%/75%百分位和中位数(或50%百分位)。
这些值为我们提供了良好的数值参考,后续会在训练线性回归模型时将看到这些数字。但缺乏直观上的理解,为此,我们需要为每列数值创建一个直方图:
// Open the advertising dataset file.

f, err := os.Open("Advertising.csv")

if err != nil {

    log.Fatal(err)

}

defer f.Close()

// Create a dataframe from the CSV file.

advertDF := dataframe.ReadCSV(f)

// Create a histogram for each of the columns in the dataset.

for _, colName := range advertDF.Names() {

    // Create a plotter.Values value and fill it with the

    // values from the respective column of the dataframe.

    plotVals := make(plotter.Values, advertDF.Nrow())

    for i, floatVal := range advertDF.Col(colName).Float() {

        plotVals[i] = floatVal

    }

    // Make a plot and set its title.

    p, err := plot.New()

    if err != nil {

        log.Fatal(err)

    }

    p.Title.Text = fmt.Sprintf("Histogram of a %s", colName)

    // Create a histogram of our values drawn

    // from the standard normal.

    h, err := plotter.NewHist(plotVals, 16)

    if err != nil {

        log.Fatal(err)

    }

    // Normalize the histogram.

    h.Normalize(1)

    // Add the histogram to the plot.

    p.Add(h)

    // Save the plot to a PNG file.

    if err := p.Save(4*vg.Inch, 4*vg.Inch, colName+"_hist.png"); err != nil {

        log.Fatal(err)

    }

}
本程序会为每个直方图创建一个.png图像:
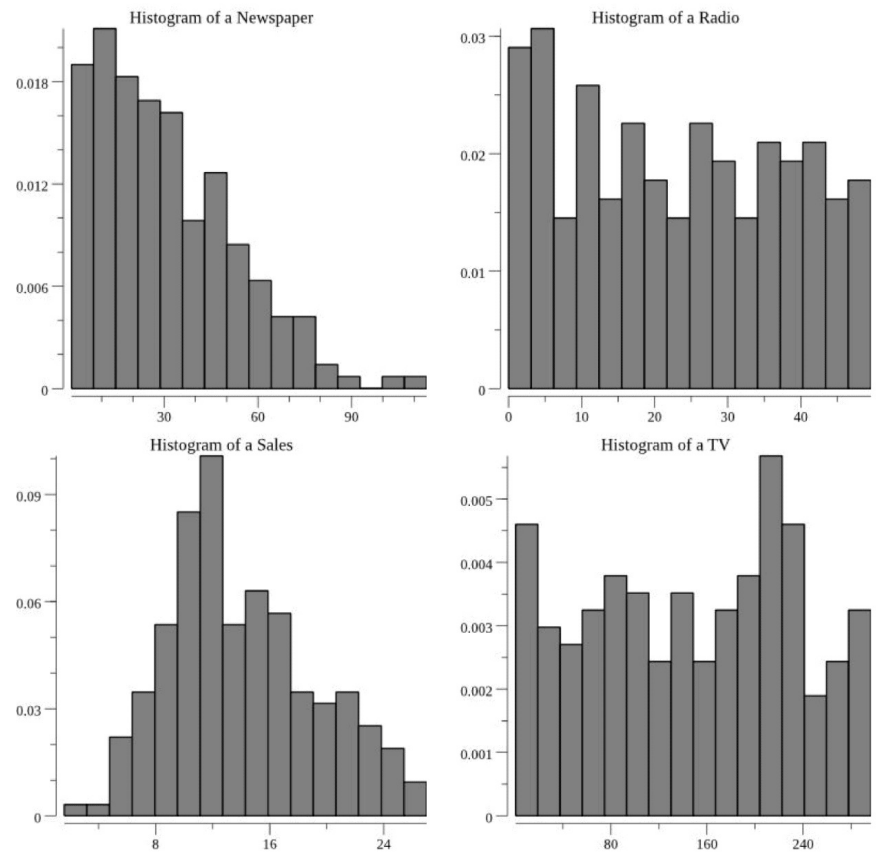
观察上图以及计算出的汇总信息,下一步考虑是否符合线性回归的假设条件。可以看到并不是所有的变量都是正态分布的(钟形的)。可以看到销售额是钟形的,而其他则不是正态的。
我们可以使用分位图(quantile-quantile (q-q) p)统计工具来确定分布与正态分布的接近程度,甚至通过统计测试来确定变量是否服从正态分布的概率。但大多数情况下,通过图表就可以得出一个大致的结论。
下一步要做出决策,但至少有一部分数据在技术上并不会拟合到我们的线性回归模型中,可以选择如下一种方式进行处理:
- 尝试转换变量,使其遵循正态分布,并在线性回归模型中使用这些转换的变量。这种方式的好处是可以在模型的假设中进行操作,缺点是可能会让模型难以理解,降低可解释性
- 使用不同的数据来解决问题
- 在线性回归假设中忽略该问题,并尝试创建该模型
可能还有其他解决问题的方式,但我的建议是首先尝试第三种选项。由于可以快速地训练线性回归模型,因此该选项并不会带来多少坏处。如果最后得出满意的模型,那么就可以避免引入更多的复杂性。如果得到的模型不尽如人意,那么此时再诉诸于其他选项。
选择自变量
现在对我们的数据有了一些直觉上的了解,并且已经了解到数据是如何拟合线性回归模型的假设的。那么现在应该选择哪个变量作为我们的自变量来预测因变量?
最简单的方法是通过直观地探索因变量和选择的所有自变量之间的相关性,特别是可以通过绘制因变量与其他每个变量的散点图(使用pkg.go.dev/gonum.org/v1/plot)来做决定:
// Open the advertising dataset file.

f, err := os.Open("Advertising.csv")

if err != nil {

    log.Fatal(err)

}

defer f.Close()

// Create a dataframe from the CSV file.

advertDF := dataframe.ReadCSV(f)

// Extract the target column.

yVals := advertDF.Col("Sales").Float()

// Create a scatter plot for each of the features in the dataset.

for _, colName := range advertDF.Names() {

    // pts will hold the values for plotting

    pts := make(plotter.XYs, advertDF.Nrow())

    // Fill pts with data.

    for i, floatVal := range advertDF.Col(colName).Float() {

        pts[i].X = floatVal

        pts[i].Y = yVals[i]

    }

    // Create the plot.

    p, err := plot.New()

    if err != nil {

        log.Fatal(err)

    }

        p.X.Label.Text = colName

    p.Y.Label.Text = "y"

    p.Add(plotter.NewGrid())

    s, err := plotter.NewScatter(pts)

    if err != nil {

        log.Fatal(err)

    }

    s.GlyphStyle.Radius = vg.Points(3)

    // Save the plot to a PNG file.

    p.Add(s)

    if err := p.Save(4*vg.Inch, 4*vg.Inch, colName+"_scatter.png"); err != nil {

        log.Fatal(err)

    }

}
如此可以创建如下散点图:
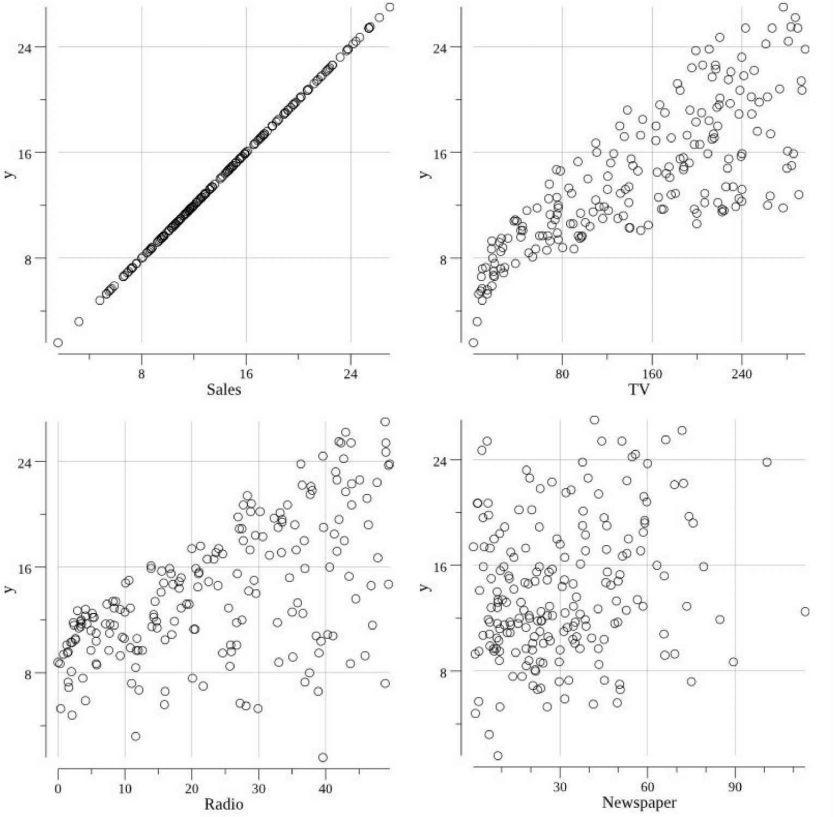
通过这些散点图,我们需要推断出哪些属性 (TV, Radio, 和/或 Newspaper)与我们的因变量(Sales)具有线性关系。是否可以在这些散点图上画一条线,以符合销售趋势和各自的属性?这种方法并不总是行得通,且对于一个特定的问题,并不一定可以将其关联到所有的属性。
上述场景中,Radio和TV与Sales呈线性关系,Newspaper可能与Sales有一定的关系,但相关性并不明显。与TV的相关性是最明显的,因此先选择TV作为线性回归模型的自变量,线性回归公式如下:
\]
这里要注意的另一件事是,变量TV可能不是严格等方差的(在线性回归的假设中讨论过)。这一点需要注意(可能值得在项目中归档的),下面将继续探究是否可以创建具有预测能力的线性回归模型。当模型表现不佳时,需要重新审视这种假设。
创建训练和测试集
为了避免过度拟合并保证模型的推广,我们需要将数据集划分为训练集和测试集即评估和验证(Evaluation and Validation)。这里我们不会聚焦某个测试集,因为只需要进行一次模型训练即可,而不会在训练和测试之间来回迭代。但如果需要多个因变量进行验证和/或需要迭代调整模型参数时,你可能希望创建一个保留集,保存到模型开发过程结束后进行验证。
我们将使用github.com/go-gota/gota/blob/master/dataframe创建训练和测试数据集,并将它们保存到各自的.csv文件中。该场景中,我们使用80/20的比例来划分训练和测试数据:
// Open the advertising dataset file.

f, err := os.Open("Advertising.csv")

if err != nil {

    log.Fatal(err)

}

defer f.Close()

// Create a dataframe from the CSV file.

// The types of the columns will be inferred.

advertDF := dataframe.ReadCSV(f)

// Calculate the number of elements in each set.

trainingNum := (4 * advertDF.Nrow()) / 5

testNum := advertDF.Nrow() / 5

if trainingNum+testNum < advertDF.Nrow() {

    trainingNum++

}

// Create the subset indices.

trainingIdx := make([]int, trainingNum)

testIdx := make([]int, testNum)

// Enumerate the training indices.

for i := 0; i < trainingNum; i++ {

    trainingIdx[i] = i

}

// Enumerate the test indices.

for i := 0; i < testNum; i++ {

    testIdx[i] = trainingNum + i

}

// Create the subset dataframes.

trainingDF := advertDF.Subset(trainingIdx)

testDF := advertDF.Subset(testIdx)

// Create a map that will be used in writing the data

// to files.

setMap := map[int]dataframe.DataFrame{

    0: trainingDF,

    1: testDF,

}

// Create the respective files.

for idx, setName := range []string{"training.csv", "test.csv"} {

    // Save the filtered dataset file.

    f, err := os.Create(setName)

    if err != nil {

        log.Fatal(err)

    }

    // Create a buffered writer.

    w := bufio.NewWriter(f)

    // Write the dataframe out as a CSV.

    if err := setMap[idx].WriteCSV(w); err != nil {

        log.Fatal(err)

    }

}
上述代码会输出如下训练和测试集:
$ wc -l *.csv

    201 Advertising.csv

    41  test.csv

    161 training.csv

    403 total
这里使用的数据并没有经过排序。但如果需要按照响应、日期或其他方式处理数据,则最好随机划分训练和测试集。如果不这么做,训练和测试集可能会包含特定范围的响应,这样响应可能会受到时间/日期等人为因素的影响。
训练模型
下面将训练(或拟合)我们的线性回归模型。这也意味着需要找到误差平方和最小的的斜率(m)和截距(b)。为了执行训练,我们会使用来自Sajari的包:github.com/sajari/regression。Sajari是一个重度依赖Go和机器学习的网站搜索公司,他们在生产中使用了github.com/sajari/regression。
为了使用github.com/sajari/regression来训练回归模型,需要初始化一个regression.Regression值,并设置一对标签,然后使用被标记的训练数据来填充regression.Regression。之后就可以简单地使用 调用Run()来对regression.Regression的值进行训练,以此生成线性回归模型。
// Open the training dataset file.

f, err := os.Open("training.csv")

    if err != nil {

    log.Fatal(err)

}

defer f.Close()

// Create a new CSV reader reading from the opened file.

reader := csv.NewReader(f)

// Read in all of the CSV records

reader.FieldsPerRecord = 4

trainingData, err := reader.ReadAll()

if err != nil {

    log.Fatal(err)

}

// In this case we are going to try and model our Sales (y)

// by the TV feature plus an intercept. As such, let's create

// the struct needed to train a model using github.com/sajari/regression.

var r regression.Regression

r.SetObserved("Sales")

r.SetVar(0, "TV")

// Loop of records in the CSV, adding the training data to the regression value.

for i, record := range trainingData {

    // Skip the header.

    if i == 0 {

        continue

    }

    // Parse the Sales regression measure, or "y".

    yVal, err := strconv.ParseFloat(record[3], 64)

    if err != nil {

        log.Fatal(err)

    }

    // Parse the TV value.

    tvVal, err := strconv.ParseFloat(record[0], 64)

    if err != nil {

        log.Fatal(err)

    }

    // Add these points to the regression value.

    r.Train(regression.DataPoint(yVal, []float64{tvVal}))

}

// Train/fit the regression model.

r.Run()

// Output the trained model parameters.

fmt.Printf("\nRegression Formula:\n%v\n\n", r.Formula)
编译执行上述代码,训练的线性回归公式会打印到标准输出:
$ go build

$ ./myprogram

Regression Formula:

Predicted = 7.07 + TV*0.05
从结果可以看到,引用的包输出的线性回归的截距为7.07,斜率为0.5。这里可以进行一些简单的检查,因为我们在散点图中看到了TV和Sales之间的相关性是上升和向右的(即正相关),这也意味着公式的斜率应该是正数。
评估训练模型
下面需要通过评估模型的表现来查看是否可以使用自变量TV来预测Sales。为此,需要加载测试集,使用训练过的模型对每个测试例进行预测,然后计算第3章"评估和验证"中讨论的某个评估指标。
为此,我们使用平均绝对误差(Mean Absolute Error (MAE))作为评估指标,这样就可以直接对比结果和Sales,而不必太担心异常值或极端值。
为了通过训练的regression.Regression 值来预测Sales,只需解析测试集的值,并针对regression.Regression 的值调用Predict()。然后,计算预测值与观测值的差值,得到差值的绝对值,然后将所有绝对值相加,得到MAE:
// Open the test dataset file.

f, err = os.Open("test.csv")

if err != nil {

    log.Fatal(err)

}

defer f.Close()

// Create a CSV reader reading from the opened file.

reader = csv.NewReader(f)

// Read in all of the CSV records

reader.FieldsPerRecord = 4

testData, err := reader.ReadAll()

if err != nil {

    log.Fatal(err)

}

// Loop over the test data predicting y and evaluating the prediction

// with the mean absolute error.

var mAE float64

for i, record := range testData {

    // Skip the header.

    if i == 0 {

    continue

    }

    // Parse the observed Sales, or "y".

    yObserved, err := strconv.ParseFloat(record[3], 64)

    if err != nil {

        log.Fatal(err)

    }

    // Parse the TV value.

    tvVal, err := strconv.ParseFloat(record[0], 64)

    if err != nil {

        log.Fatal(err)

    }

    // Predict y with our trained model.

    yPredicted, err := r.Predict([]float64{tvVal})

    // Add the to the mean absolute error.

    mAE += math.Abs(yObserved-yPredicted) / float64(len(testData))

}

// Output the MAE to standard out.

fmt.Printf("MAE = %0.2f\n\n", mAE)
编译并运行评估程序,得到如下结果:
$ go build

$ ./myprogram

Regression Formula:

Predicted = 7.07 + TV*0.05

MAE = 3.01
那么如果MAE = 3.01,我们怎么知道该值是好的还是坏的?这也是为什么拥有一个良好的数据心智模型很重要的原因。我们已经计算了销售额的平均值、范围和标准差。平均销售额为14.02,标准差为5.21。这样我们的MAE小于销售额数值的标准差,约为平均值的20%,说明我们的模型具有一定的预测能力。
恭喜,我们构建了第一个具有预测能力的机器学习模型。
为了更直观地了解模型的运行状况,可以借助图形来帮助可视化线性回归线(利用gonum.org/v1/plot)。首先,创建一个可以执行预测的函数(而需要使用 github.com/sajari/regression包,相当于桩函数),通过这种方式可以提供轻量级内存训练模型:
// predict uses our trained regression model to made a prediction.

func predict(tv float64) float64 {

    return 7.07 + tv*0.05

}
然后创建可视化的回归线:
// Open the advertising dataset file.

f, err := os.Open("Advertising.csv")

if err != nil {

    log.Fatal(err)

}

defer f.Close()

// Create a dataframe from the CSV file.

advertDF := dataframe.ReadCSV(f)

// Extract the target column.

yVals := advertDF.Col("Sales").Float()

// pts will hold the values for plotting.

pts := make(plotter.XYs, advertDF.Nrow())

// ptsPred will hold the predicted values for plotting.

ptsPred := make(plotter.XYs, advertDF.Nrow())

// Fill pts with data.

for i, floatVal := range advertDF.Col("TV").Float() {

    pts[i].X = floatVal

    pts[i].Y = yVals[i]

    ptsPred[i].X = floatVal

    ptsPred[i].Y = predict(floatVal)

}

// Create the plot.

p, err := plot.New()

if err != nil {

    log.Fatal(err)

}

p.X.Label.Text = "TV"

p.Y.Label.Text = "Sales"

p.Add(plotter.NewGrid())

// Add the scatter plot points for the observations.

s, err := plotter.NewScatter(pts)

if err != nil {

    log.Fatal(err)

}

s.GlyphStyle.Radius = vg.Points(3)

// Add the line plot points for the predictions.

l, err := plotter.NewLine(ptsPred)

if err != nil {

    log.Fatal(err)

}

l.LineStyle.Width = vg.Points(1)

l.LineStyle.Dashes = []vg.Length{vg.Points(5), vg.Points(5)}

// Save the plot to a PNG file.

p.Add(s, l)

if err := p.Save(4*vg.Inch, 4*vg.Inch, "regression_line.png"); err != nil {

    log.Fatal(err)

}
编译和运行后得到如下图:
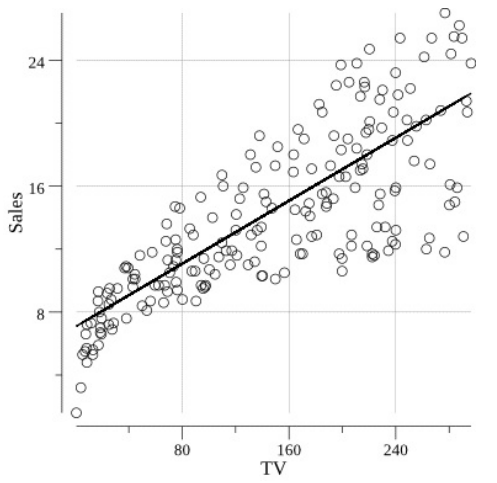
可以看到,我们训练的回归线与实际的数据趋势相匹配。
多元线性回归
线性回归并不局限于依赖单个自变量的简单线性公式。多元线性回归与前面讨论的类似,但具有多个自变量(x1,x2等)。这种场景下的直线方程如下:
\]
这里x作为自变量,m作为与自变量相关的斜率,此外还有一个截距b。
多元线性回归相对比较难以可视化和思考,因为它不再是一条可以在二维中可视化的直线。而是一条在二维、三维或多维的线性曲面。但它使用了很多在一元线性回归中用过的技术。
多元线性回归具有与一元线性回归相同的假设,但需要注意的是与之相关的陷阱:
- 过拟合:通过为模型添加越来越多的自变量,会增加模型的复杂度,并存在过拟合的风险。可以使用之前推荐的技术:正则化(regularization)来解决这种问题。 正则化在模型中创建一个惩罚项,该惩罚项是一个与模型复杂性有关的函数,有助于控制这种影响。
- 相对比例(Relative Scale):在某些场景下,如果其中某个自变量的比例与另一个自变量的比例相差几个数量级,那么较大的变量可能会抵消较小变量带来的影响,因此可能需要考虑规范化变量。
记住以上两点,下面尝试将Sales模型从一元线性回归模型扩展到多元线性回归模型。回顾一下前面章节中的散点图,可以看到Radio似乎也与Sales呈线性关系,因此可以尝试创建一个多元线性回归模型,如下:
\]
使用github.com/sajari/regression时,需要在regression.Regression中标记其他变量,并确保这些值在训练数据点中成对出现:
// Open the training dataset file.

f, err := os.Open("training.csv")

if err != nil {

    log.Fatal(err)

}

defer f.Close()

// Create a new CSV reader reading from the opened file.

reader := csv.NewReader(f)

// Read in all of the CSV records

reader.FieldsPerRecord = 4

trainingData, err := reader.ReadAll()

if err != nil {

    log.Fatal(err)

}

// In this case we are going to try and model our Sales

// by the TV and Radio features plus an intercept.

var r regression.Regression

r.SetObserved("Sales")

r.SetVar(0, "TV")

r.SetVar(1, "Radio")

// Loop over the CSV records adding the training data.

for i, record := range trainingData {

    // Skip the header.

    if i == 0 {

        continue

    }

    // Parse the Sales.

    yVal, err := strconv.ParseFloat(record[3], 64)

    if err != nil {

        log.Fatal(err)

    }

    // Parse the TV value.

    tvVal, err := strconv.ParseFloat(record[0], 64)

    if err != nil {

        log.Fatal(err)

    }

    // Parse the Radio value.

    radioVal, err := strconv.ParseFloat(record[1], 64)

    if err != nil {

        log.Fatal(err)

    }

    // Add these points to the regression value.

    r.Train(regression.DataPoint(yVal, []float64{tvVal, radioVal}))

}

// Train/fit the regression model.

r.Run()

// Output the trained model parameters.

fmt.Printf("\nRegression Formula:\n%v\n\n", r.Formula)
编译并运行,得到如下回归公式:
$ go build

$ ./myprogram

Regression Formula:

Predicted = 2.93 + TV*0.05 + Radio*0.18
可以看到,回归公式增加了一个额外的自变量项。截距值也发生了变化。
可以用与一元线性回归模型类似的方式,使用Predict()方法来测试该模型:
// Open the test dataset file.

f, err = os.Open("test.csv")

if err != nil {

    log.Fatal(err)

}

defer f.Close()

// Create a CSV reader reading from the opened file.

reader = csv.NewReader(f)

// Read in all of the CSV records

reader.FieldsPerRecord = 4

testData, err := reader.ReadAll()

if err != nil {

    log.Fatal(err)

}

// Loop over the test data predicting y and evaluating the prediction

// with the mean absolute error.

var mAE float64

for i, record := range testData {

    // Skip the header.

    if i == 0 {

        continue

    }

    // Parse the Sales.

    yObserved, err := strconv.ParseFloat(record[3], 64)

    if err != nil {

        log.Fatal(err)

    }

    // Parse the TV value.

    tvVal, err := strconv.ParseFloat(record[0], 64)

    if err != nil {

        log.Fatal(err)

    }

    // Parse the Radio value.

    radioVal, err := strconv.ParseFloat(record[1], 64)

    if err != nil {

        log.Fatal(err)

    }

    // Predict y with our trained model.

    yPredicted, err := r.Predict([]float64{tvVal, radioVal})

    // Add the to the mean absolute error.

    mAE += math.Abs(yObserved-yPredicted) / float64(len(testData))

}

// Output the MAE to standard out.

fmt.Printf("MAE = %0.2f\n\n", mAE)
运行该程序将为我们的新多元回归模型得出如下MAE:
$ go build

$ ./myprogram

Regression Formula:

Predicted = 2.93 + TV*0.05 + Radio*0.18

MAE = 1.26
新的多元回归模型提高了MAE值。现在,我们可以根据广告支出来预测Sales了。你还可以尝试将Newspaper添加到模型。
注意,模型复杂性增加的同时,也会牺牲掉简易性,并增加过拟合的风险,因此只考虑当添加的复杂性能够提升模型的表现、并带来更大的价值时。
非线性以及其他类型的回归
虽然本章节主要关注线性回归,但不会仅限于使用线性方程来执行回归。你可以使用一个或多个非线性(如幂、指数或其他变换)自变量来为因变量建模。例如,我们可以通过一系列TV项来为Sales建模:
\]
注意,增加复杂性的同时也增加了过拟合的风险。
为了实现非线性回归,不能使用github.com/sajari/regression(仅限于线性回归),但可以使用github.com/go-hep/hep/tree/main/fit 来拟合或训练特定的非线性模型。在Go社区中有很多人已经或正在开发非线性模型工具。
除了OLS外还有其他线性回归技术,可以帮助克服最小二乘线性回归中的一些假设和弱点。包括岭回归和套索回归(lasso regression)。这两种技术使用惩罚回归系数来减轻自变量的多重共线性和非正态性带来的影响。
github.com/berkmancenter/ridge中实现了Go语言的岭回归。与 github.com/sajari/regression不同,我们的自变量和因变量数据是通过gonum矩阵输入github.com/berkmancenter/ridge的。为了说明该方法,我们首先构造一个包含广告支出 (TV, Radio, 和Newspaper)的矩阵,以及包含Sales数据的矩阵。注意在github.com/berkmancenter/ridge中,如果想在模型中有一个截距,则需要为截距的输入自变量矩阵显式地添加一列,该列中的每个值仅为1.0。
// Open the training dataset file.

f, err := os.Open("training.csv")

if err != nil {

    log.Fatal(err)

}

defer f.Close()

// Create a new CSV reader reading from the opened file.

reader := csv.NewReader(f)

reader.FieldsPerRecord = 4

// Read in all of the CSV records

rawCSVData, err := reader.ReadAll()

if err != nil {

    log.Fatal(err)

}

// featureData will hold all the float values that will eventually be

// used to form our matrix of features.

featureData := make([]float64, 4*len(rawCSVData))

yData := make([]float64, len(rawCSVData))

// featureIndex and yIndex will track the current index of the matrix values.

var featureIndex int

var yIndex int

// Sequentially move the rows into a slice of floats.

for idx, record := range rawCSVData {

    // Skip the header row.

    if idx == 0 {

        continue

    }

    // Loop over the float columns.

    for i, val := range record {

        // Convert the value to a float.

        valParsed, err := strconv.ParseFloat(val, 64)

        if err != nil {

            log.Fatal(err)

        }

        if i < 3 {

        // Add an intercept to the model.

        if i == 0 {

            featureData[featureIndex] = 1

            featureIndex++

        }

        // Add the float value to the slice of feature floats.

        featureData[featureIndex] = valParsed

        featureIndex++

        }

        if i == 3 {

            // Add the float value to the slice of y floats.

            yData[yIndex] = valParsed

            yIndex++

        }

    }

}

// Form the matrices that will be input to our regression.

features := mat64.NewDense(len(rawCSVData), 4, featureData)

y := mat64.NewVector(len(rawCSVData), yData)
下面使用自变量和因变量矩阵创建一个新的ridge.RidgeRegression值,然后调用Regress() 方法来训练模型,最后打印训练的回归公式:
// Create a new RidgeRegression value, where 1.0 is the

// penalty value.

r := ridge.New(features, y, 1.0)

// Train our regression model.

r.Regress()

// Print our regression formula.

c1 := r.Coefficients.At(0, 0)

c2 := r.Coefficients.At(1, 0)

c3 := r.Coefficients.At(2, 0)

c4 := r.Coefficients.At(3, 0)

fmt.Printf("\nRegression formula:\n")

fmt.Printf("y = %0.3f + %0.3f TV + %0.3f Radio + %0.3f Newspaper\n\n", c1, c2, c3, c4)
编译并运行程序,得出如下回归公式:
$ go build

$ ./myprogram

Regression formula:

y = 3.038 + 0.047 TV + 0.177 Radio + 0.001 Newspaper
可以看到TV和Radio的系数与最小二乘回归得到的结果类似,但略微不同。另外可以看到添加了一个Newspaper项。
可以通过创建自己的预测函数来测试岭回归公式:
// predict uses our trained regression model to made a prediction based on a

// TV, Radio, and Newspaper value.

func predict(tv, radio, newspaper float64) float64 {

    return 3.038 + tv*0.047 + 0.177*radio + 0.001*newspaper

}
然后使用该predict函数和测试数据来测试岭回归公式:
// Open the test dataset file.

f, err := os.Open("test.csv")

if err != nil {

    log.Fatal(err)

}

defer f.Close()

// Create a new CSV reader reading from the opened file.

reader := csv.NewReader(f)

// Read in all of the CSV records

reader.FieldsPerRecord = 4

testData, err := reader.ReadAll()

if err != nil {

    log.Fatal(err)

}

// Loop over the holdout data predicting y and evaluating the prediction

// with the mean absolute error.

var mAE float64

for i, record := range testData {

    // Skip the header.

    if i == 0 {

        continue

    }

    // Parse the Sales.

    yObserved, err := strconv.ParseFloat(record[3], 64)

    if err != nil {

        log.Fatal(err)

    }

    // Parse the TV value.

    tvVal, err := strconv.ParseFloat(record[0], 64)

    if err != nil {

        log.Fatal(err)

    }

    // Parse the Radio value.

    radioVal, err := strconv.ParseFloat(record[1], 64)

    if err != nil {

        log.Fatal(err)

    }

    // Parse the Newspaper value.

    newspaperVal, err := strconv.ParseFloat(record[2], 64)

    if err != nil {

        log.Fatal(err)

    }

    // Predict y with our trained model.

    yPredicted := predict(tvVal, radioVal, newspaperVal)

    // Add the to the mean absolute error.

    mAE += math.Abs(yObserved-yPredicted) / float64(len(testData))

}

// Output the MAE to standard out.

fmt.Printf("\nMAE = %0.2f\n\n", mAE)
编译并运行,等到新的MAE:
$ go build

$ ./myprogram

MAE = 1.26
注意在模型中添加Newspaper并不会提高MAE,因此在这种场景下并不适合添加Newspaper项,因为此时提高了复杂度,但并没有显著影响到模型。
添加到模型中的任何复杂性或复杂度都应该有其可衡量的理由。使用一个复杂的模型,这看起来很有趣,但同时也会让人头疼。
总结
- https://github.com/go-gota/gota/tree/master/dataframe:给出了获取平均值、标准偏差、最小值、最大值的方法
- https://pkg.go.dev/gonum.org/v1/plot:绘图库
- https://github.com/sajari/regression:线性回归库,可以根据训练数据生成斜率和截距
- https://github.com/go-hep/hep/tree/main/fit:非线性回归库
- https://github.com/berkmancenter/ridge:岭回归
- 使用MAE衡量回归的可预测能力
Machine Learning With Go 第4章:回归的更多相关文章
- Machine Learning for hackers读书笔记(五)回归模型:预测网页访问量
线性回归函数 model<-lm(Weight~Height,data=?) coef(model):得到回归直线的截距 predict(model):预测 residuals(model):残 ...
- Coursera《machine learning》--(6)逻辑回归
六 逻辑回归(Logistic Regression:LR) 逻辑回归(Logistic Regression, LR)模型其实仅在线性回归的基础上,套用了一个逻辑函数,但也就是由于这个逻辑函数,使得 ...
- 【Machine Learning in Action --5】逻辑回归(LogisticRegression)从疝气病预测病马的死亡率
背景:使用Logistic回归来预测患有疝气病的马的存活问题,这里的数据包括368个样本和28个特征,疝气病是描述马胃肠痛的术语,然而,这种病并不一定源自马的胃肠问题,其他问题也可能引发疝气病,该数据 ...
- 【Machine Learning in Action --5】逻辑回归(LogisticRegression)
1.概述 Logistic regression(逻辑回归)是当前业界比较常用的机器学习方法,用于估计某种事物的可能性. 在经典之作<数学之美>中也看到了它用于广告预测,也就是根据某广告被 ...
- 【机器学习Machine Learning】资料大全
昨天总结了深度学习的资料,今天把机器学习的资料也总结一下(友情提示:有些网站需要"科学上网"^_^) 推荐几本好书: 1.Pattern Recognition and Machi ...
- 机器学习(Machine Learning)&深度学习(Deep Learning)资料【转】
转自:机器学习(Machine Learning)&深度学习(Deep Learning)资料 <Brief History of Machine Learning> 介绍:这是一 ...
- 机器学习(Machine Learning)与深度学习(Deep Learning)资料汇总
<Brief History of Machine Learning> 介绍:这是一篇介绍机器学习历史的文章,介绍很全面,从感知机.神经网络.决策树.SVM.Adaboost到随机森林.D ...
- 第二章——机器学习项目完整案例(End-to-End Machine Learning Project)
本章通过一个例子,介绍机器学习的整个流程. 2.1 使用真实数据集练手(Working with Real Data) 国外一些获取数据的网站: Popular open data repositor ...
- Coursera 机器学习 第6章(上) Advice for Applying Machine Learning 学习笔记
这章的内容对于设计分析假设性能有很大的帮助,如果运用的好,将会节省实验者大量时间. Machine Learning System Design6.1 Evaluating a Learning Al ...
随机推荐
- vuecli中配置webpack加快打包速度
webpack4中webpack 的DllPlugin插件可以将常见的库文件作为dll文件来,每次打包的时候就不用再次打包库文件了. 但是游鱼西在vuecli中已经去除这个选项,意识到带来的打包速度提 ...
- vue项目中返回之前页面数据不刷新的问题
利用vue做项目的时候会有让用户选择当前页面的某些数据,然后再跳到下一页,而下一页是根据上一页的数据来的,有时候选择了上一页的不同选项,下一页的数据可能还是之前的 这个就属于vue的数据获取问题 解决 ...
- 单位ren vw vh 和 vm
px: (像素)就是一张图片最小的一个点 em :参考物是父元素的font-size,具有继承的特点 rem: 参考物是HTML的font-size
- 设置IDEA启动时不打开上次项目
步骤 1.启动IDEA,点击File 2.点击setting,在Appearance&Behavior中找到System Setting 3.取消勾选Reopen projects on st ...
- LC-209
给定一个含有 n 个正整数的数组和一个正整数 target . 找出该数组中满足其和 ≥ target 的长度最小的 连续子数组 [numsl, numsl+1, ..., numsr-1, nums ...
- DDD(Domain-Driven Design) 领域驱动设计
DDD(Domain-Driven Design) 领域驱动设计 1. DDD(Domain-Driven Design)是什么? DDD是Eric Evans在2003年出版的<领域驱动设计: ...
- 算法题——Cantor表
题目介绍 描述 现代数学的著名证明之一是 Georg Cantor 证明了有理数是可枚举的.他是用下面这一张表来证明这一命题的: 1/1, 1/2 , 1/3, 1/4, 1/5, - 2/1, 2/ ...
- C++五子棋(六&七)——游戏结束
规则原理 如图 判断游戏结束 chessData.h //row,col 表示当前落子 bool checkWin(ChessData* game, int row, int col); 横.竖.斜( ...
- 2021蓝桥杯省赛B组(C/C++)E.路径【最短路DP】
2021蓝桥杯省赛B组题目(C/C++)E.路径 最短路径, 因为变化情况比较多, 所以开始想的是深搜, 但是太慢了, 跑不出来, 后来就想着优化一下, 有的地方到另一个地方可能会考虑很多遍, 于是考 ...
- 2021-ACM-ICPC-济南站 K Search For Mafuyu 【树的遍历与回溯,dfs, 邻接表】
PAT 题目详情 (pintia.cn) 题目 题意描述 n个房间, 有n-1个通道, kanade初始在1,Mafuyu 位置未知,求K到M的最小期望,也就是到每个地方的平均值,注意的是这里的求法, ...
