Clustering with the ArcGIS API for Flex
Clustering is an excellent technique for visualizing lotss of point data. We've all seen applications where there were so many points that simply appear as one big blob.Clustering takes the individual points and groups them into clusters and then renders the cluster as one graphic.In this post I will describe how you can use ArcGIS API for Flex to create clustering demo.
First,I add 500 random points in the map of tianditu.(There tell you how to create tianditu use ArcGIS API for Flex)
       // 往地图上添加点

            protected function addPointsToMap(cluseter:WeightedClusterer):void

            {

                var graphicsLayer:GraphicsLayer = new GraphicsLayer();

                for(var i:int = ; i < ; i++)

                {

                    // 产生随机数

                    var num: Number = Math.round(Math.random() * );

                    var num2: Number = Math.round(Math.random() * );

                    // 产生随机颜色

                    var index: Number = Math.round(Math.random() * );

                    var colors: Array = ["0xFF00FF", "0x0000FF", "0x000000", "0x008000", "0x800000"];

                    var color:Number = parseInt(colors[index]);

                    var sym:SimpleMarkerSymbol = new SimpleMarkerSymbol("circle",,color);

                    var geo:MapPoint = new MapPoint(120.13102 - num * 0.01, 30.19089 - num2 * 0.01);

                    var graphic:Graphic = new Graphic(geo,sym);

                    graphicsLayer.add(graphic);

                }

                myMap.addLayer(graphicsLayer);

            }
And then, I create the Cluster.
          // 文本格式

                var tf:TextFormat = new TextFormat("Arial",,0xE6E6E6);

                // 创建FlareSymbol

                var flareSymbol:FlareSymbol = new FlareSymbol();

                flareSymbol.backgroundAlphas = [0.7,1.0];

                flareSymbol.backgroundColor = 0x394B8C;

                flareSymbol.backgroundColors = [0x5B8C3E,0xBF2827];

                flareSymbol.borderColor= 0x666666;

                flareSymbol.flareMaxCount=;

                flareSymbol.flareSizeIncOnRollOver=;

                flareSymbol.sizes=[,];

                flareSymbol.textFormat=tf;

                flareSymbol.weights=[,];

                // 创建Clustering

                var cluseter:WeightedClusterer = new WeightedClusterer();

                cluseter.sizeInPixels = ;

                cluseter.symbol = flareSymbol;

                cluseter.center = new MapPoint(117.02263, 28.28375,new SpatialReference());
At last, add cluseter to graphic.
graphicsLayer.clusterer = cluseter;
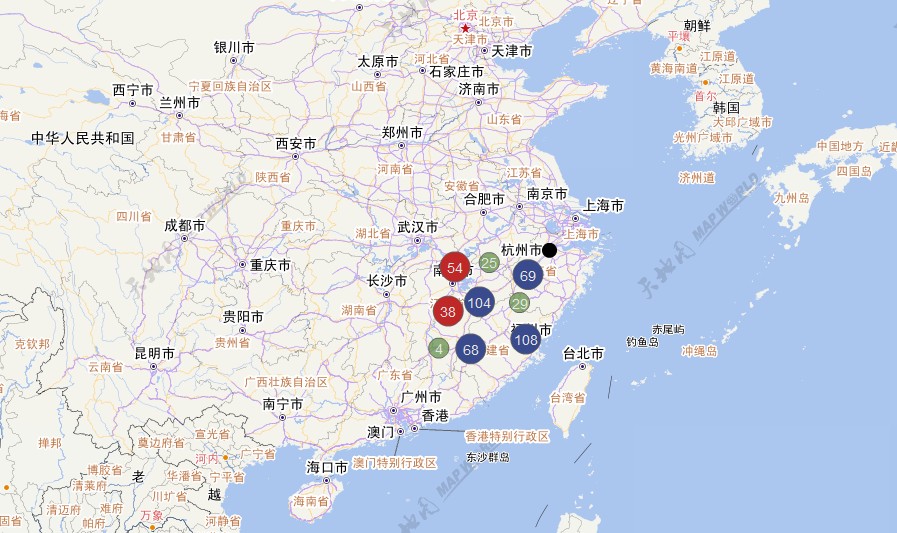
The effect is like it.
Download source here.
Clustering with the ArcGIS API for Flex的更多相关文章
- 天津政府应急系统之GIS一张图(arcgis api for flex)讲解(十)态势标绘模块
config.xml文件的配置如下: <widget label="态势标绘" icon="assets/images/impact_area_over.png&q ...
- arcgis api for flex之专题图制作(饼状图,柱状图等)
最近公司给我一个任务,就是利用arcgis api for flex实现在地图上点(业务数据)直接显示饼状图以及柱状图的专题图制作,而不是通过点击点显示气泡窗口的形式来实现,这个公司已经实现了. 经过 ...
- 天津政府应急系统之GIS一张图(arcgis api for flex)讲解(一)GIS一张图的系统开发环境以及flexviewer框架
系统的GIS功能实现是基于arcgis api for flex,首先附上系统的主界面图,接下来的是对主界面的模块功能详细讲解: 一.GIS环境软件安装 (1)arcgis desktop的安装,要是 ...
- ArcGIS API for Flex实现GraphicsLayer上画点、线、面。
目的: ArcGIS API for Flex实现GraphicsLayer上画点.线.面. 准备工作: 1.这次地图数据就用Esri提供的http://server.arcgisonline.com ...
- arcgis api for flex 开发入门(一)环境搭建
http://www.cnblogs.com/wenjl520/archive/2009/06/02/1494514.html arcgis api for flex 开发入门(一)环境搭建arcgi ...
- 天津政府应急系统之GIS一张图(arcgis api for flex)讲解(十三)台风模块
config.xml文件的配置如下: <widget label="台风" icon="assets/images/typhoon.png" config ...
- 天津政府应急系统之GIS一张图(arcgis api for flex)讲解(十一)路径导航模块
config.xml文件的配置如下: <widget label="路径导航" icon="assets/images/lujingdaohang.png" ...
- 天津政府应急系统之GIS一张图(arcgis api for flex)讲解(四)地图导航控件模块
config.xml文件的配置如下: <widget left="10" top="50" config="widgets/Navigation ...
- 天津政府应急系统之GIS一张图(arcgis api for flex)讲解(三)显示地图坐标系模块
config.xml文件的配置如下: <widget left="3" bottom="3" config="widgets/Coordinat ...
随机推荐
- 使用ViewPager实现屏幕滑动效果
oncreate中设置viewPager viewPager.setPageTransformer(true,new DepthPageTransformer());//设置页面过滤动画效果 page ...
- fck编辑器漏洞想到的--目录的执行权限
结合近来我遇到的问题,转一篇关于目录的执行权限问题.来解决fck编辑器的漏洞.漏洞就是给人家上传了文件,而且还遍历目录或者直接执行文件,,非常大大的危险. 解决方法如下. 1,首先要删除fckedit ...
- JavaScript数组方法总结
由于最近都在freecodecamp上刷代码,运用了很多JavaScript数组的方法,因此做了一份关于JavaScript教程的整理,具体内容如下: 一.普通方法 1.join() 将数组元素连接在 ...
- Day6 google Geocoding API
在看机器学习实战中K-means一章,练习中需要调用Yahoo PlaceFinder API 为地点添加经纬度,语言是python.申请到了appid但调用好像还要收费,要填写银行卡号才能用,没管那 ...
- 无锁队列以及ABA问题
队列是我们非常常用的数据结构,用来提供数据的写入和读取功能,而且通常在不同线程之间作为数据通信的桥梁.不过在将无锁队列的算法之前,需要先了解一下CAS(compare and swap)的原理.由于多 ...
- 第九课,T语言数组的定义与访问(版本5.0)
数组的定义与访问 数组是一系列数据的集合,可以存储大量数据,通过数组的下标.key,可以实现对数据的快速访问. 为什么要使用数组呢? 如果您有一个项目列表(例如汽车品牌列表),在单个变量中存储这些品牌 ...
- Linux下获得系统时间的C语言实现
Linux下获得系统时间的C语言的实现方法 #include<time.h> //C语言的头文件#include<stdio.h> //C语言的I/O int main() ...
- Android——数据库相关(课堂整理)
layout文件: <?xml version="1.0" encoding="utf-8"?> <LinearLayout xmlns:an ...
- 序列化SerialVersionUID
Java中的SerialVersionUID - Java译站http://it.deepinmind.com/java/2014/05/25/why-use-serialversionuid-ins ...
- 去除Visual Studio引号中的内容和注释中出现的波浪下划线
[描述] 使用vs2013,注释或者字符串常量中,经常会出现红色的波浪线,非常烦人. 注意,不是代码错误的那种波浪线,我觉得代码错误智能提示的波浪线还是有必要留着的,这样可以避免过多的编译来发现错误, ...