前端统计图 echarts 实现简单柱状图
前端统计图 echarts实现简单柱状图
1. 引入 ECharts
<!DOCTYPE html>

<html>

<head>

    <meta charset="utf-8">

    <!-- 引入 ECharts 文件 -->

    <script src="echarts.min.js"></script>

</head>
2. 绘制一个简单的图表
在绘图前我们需要为 ECharts 准备一个具备高宽的 DOM 容器。
<body>

    <!-- 为 ECharts 准备一个具备大小(宽高)的 DOM -->

    <div id="main" style="width: 600px;height:400px;"></div>

</body>
然后就可以通过 echarts.init 方法初始化一个 echarts 实例并通过 setOption 方法生成一个简单的柱状图,下面是完整代码。
<!DOCTYPE html>
<html>
<head>
<meta charset="utf-8">
<title>ECharts</title>
<!-- 引入 echarts.js -->
<script src="echarts.min.js"></script>
</head>
<body>
<!-- 为ECharts准备一个具备大小(宽高)的Dom -->
<div id="main" style="width: 600px;height:400px;"></div>
<script type="text/javascript">
// 基于准备好的dom,初始化echarts实例
var myChart = echarts.init(document.getElementById('main')); // 指定图表的配置项和数据
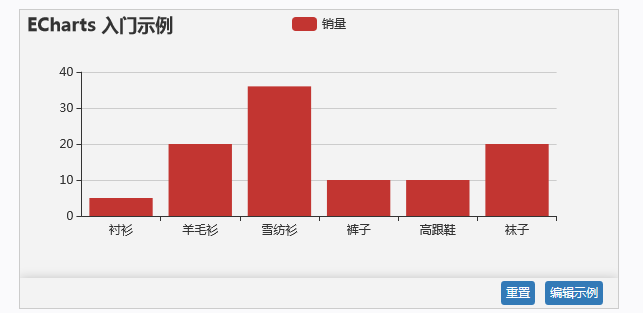
var option = {
title: {
text: 'ECharts 入门示例'
},
tooltip: {},
legend: {
data:['销量']
},
xAxis: {
data: ["衬衫","羊毛衫","雪纺衫","裤子","高跟鞋","袜子"]
},
yAxis: {},
series: [{
name: '销量',
type: 'bar',
data: [, , , , , ]
}]
}; // 使用刚指定的配置项和数据显示图表。
myChart.setOption(option);
</script>
</body>
</html>
这样你的第一个图表就诞生了!
案列:
前端代码: <!DOCTYPE html>
<html lang="zh" xmlns:th="http://www.thymeleaf.org">
<head>
<meta charset="utf-8">
<meta name="viewport" content="width=device-width, initial-scale=1.0">
<!--360浏览器优先以webkit内核解析-->
<title>高句丽介绍</title>
<link rel="shortcut icon" href="favicon.ico">
<link href="../static/css/bootstrap.min.css" th:href="@{/css/bootstrap.min.css}" rel="stylesheet"/>
<link href="../static/css/font-awesome.min.css" th:href="@{/css/font-awesome.min.css}" rel="stylesheet"/>
<link href="../static/css/main/animate.min.css" th:href="@{/css/main/animate.min.css}" rel="stylesheet"/>
<link href="../static/css/main/style.min862f.css" th:href="@{/css/main/style.min862f.css}" rel="stylesheet"/>
<style lang="css">
td {
align: center;
valign: middle;
text-align: center;
vertical-align: middle;
}
</style>
</head> <body class="gray-bg">
<div class="wrapper wrapper-content">
<div class="row">
<div class="col-sm-9">
<div class="ibox float-e-margins">
<div class="ibox-title">
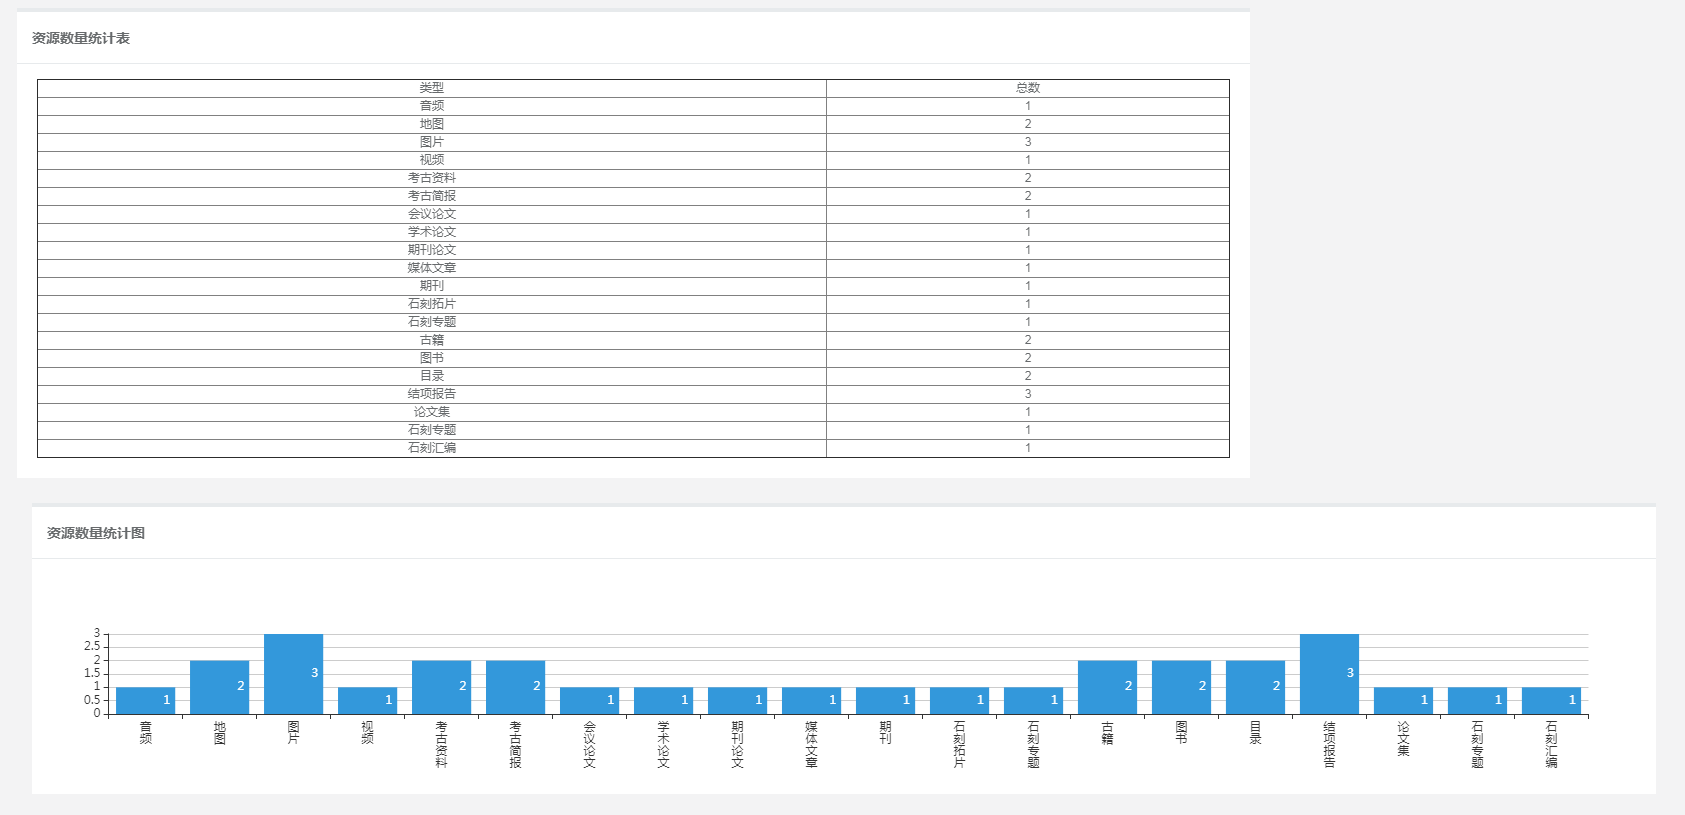
<h4>资源数量统计表</h4>
</div>
<div class="ibox-content">
<table border="" cellspacing="" style="height: 200px;width: 100%;font-size: 0.5em" >
<thead>
<tr>
<td>类型</td>
<td>总数</td>
<!-- <td>已发布</td>
<td>未发布</td>-->
</tr>
</thead>
<tbody>
<tr th:each="a : ${list}">
<td th:text="${a.type}"></td>
<td th:text="${a.total}"></td>
<!--<td th:text="${a.publish}"></td>
<td th:text="${a.notPublish}"></td>-->
</tr>
</tbody>
</table>
</div>
</div>
</div> </div> <div class="col-sm-12"> <div class="ibox float-e-margins">
<div class="ibox-title">
<h4>资源数量统计图</h4>
</div>
<div class="ibox-content">
<div id="bar" style="height: 200px;width: 100%"></div> </div>
</div>
</div>
</div>
<script th:src="@{/js/jquery.min.js}"></script>
<script th:src="@{/js/bootstrap.min.js}"></script>
<!-- echart-->
<script th:src="@{/ajax/libs/echarts/echarts.common.min.js}"></script> <script th:inline="javascript">
// 基于准备好的dom,初始化echarts实例
var myChart = echarts.init(document.getElementById('bar'));
var list = [[${list}]]; var legendDate = [];
var total = [];
//var notPublish = [];
for (var i = ; i < list.length; i++) {
legendDate.push(list[i].type)
total.push(list[i].total)
// notPublish.push(list[i].notPublish)
}
console.log(legendDate); // 指定图表的配置项和数据
option = {
color: ['#3398DB'],
tooltip: {
trigger: 'axis',
axisPointer: { // 坐标轴指示器,坐标轴触发有效
type: 'shadow' // 默认为直线,可选为:'line' | 'shadow'
}
},
legend: {
data: '总数'
},
grid: {
left: '2%',
right: '3%',
bottom: '2%',
containLabel: true
},
xAxis: [{
type: 'category',
data: legendDate,
textStyle: {
color: '#c3dbff', //更改坐标轴文字颜色
fontSize : //更改坐标轴文字大小
},
axisLabel: {//x轴文字垂直显示
interval: ,
formatter:function(value)
{
return value.split("").join("\n");
}
}
// axisTick: {
// alignWithLabel: true
// }
}],
yAxis: {
type: 'value' },
series: [
{
name: '资源总量',
type: 'bar',
stack: '总量',
label: {
normal: {
show: true,
position: 'insideRight'
}
},
data: total
}/*,
{
name: '未发布',
type: 'bar',
stack: '总量',
label: {
normal: {
show: true,
position: 'insideRight'
}
},
data: notPublish
}*/
]
}; // 使用刚指定的配置项和数据显示图表。
myChart.setOption(option);
</script>
</body>
</html>
后台代码:

package cn.cmodes.project.module.statistics;

import cn.cmodes.project.module.articleResource.service.IArticleResourceService;

import cn.cmodes.project.module.articleinformation.service.IArticleinformationService;

import cn.cmodes.project.module.bookResource.service.IBookResourceService;

import cn.cmodes.project.module.bookinformation.service.IBookinformationService;

import cn.cmodes.project.module.mediaphoto.service.IMediaphotoService;

import cn.cmodes.project.module.resource.service.IResourceService;

import org.springframework.beans.factory.annotation.Autowired;

import org.springframework.stereotype.Controller;

import org.springframework.ui.ModelMap;

import org.springframework.web.bind.annotation.GetMapping;

import org.springframework.web.bind.annotation.RequestMapping;

import java.util.ArrayList;

import java.util.HashMap;

/**

 * 统计分析

 * @author : di

 * @date : 2018-11-28 15:53

 */

@Controller

@RequestMapping("/module/statistics")

public class statisticsController {

    @Autowired

    private IBookResourceService bookResourceService;

    @Autowired

    private IArticleResourceService articleResourceService;

    @Autowired

    private IResourceService resourceService;

    @Autowired

    private IArticleinformationService iArticleinformationService;

    @Autowired

    private IBookinformationService iBookinformationService;

    @Autowired

    private IMediaphotoService iMediaphotoService;

    @GetMapping()

    public String statistics(ModelMap mmap) {

        ArrayList<Object> result = new ArrayList<>();

        HashMap<String, Object> audio = new HashMap<>();

        audio.put("type","音频");

        audio.put("total",iMediaphotoService.selectTypeTatal());

        result.add(audio);

        HashMap<String, Object> map = new HashMap<>();

        map.put("type","地图");

        map.put("total",iMediaphotoService.selectTypeTatal());

        result.add(map);

        HashMap<String, Object> picture = new HashMap<>();

        picture.put("type","图片");

        picture.put("total",iMediaphotoService.selectTypeTatal());

        result.add(picture);

        HashMap<String, Object> video = new HashMap<>();

        video.put("type","视频");

        video.put("total",iMediaphotoService.selectTypeTatal());

        result.add(video);

        HashMap<String, Object> archaeologicaldata = new HashMap<>();

        archaeologicaldata.put("type","考古资料");

        archaeologicaldata.put("total",iArticleinformationService.selectTypeTatal());

        result.add(archaeologicaldata);

        HashMap<String, Object> archaeology = new HashMap<>();

        archaeology.put("type","考古简报");

        archaeology.put("total",iArticleinformationService.selectTypeTatal());

        result.add(archaeology);

        HashMap<String, Object> conference = new HashMap<>();

        conference.put("type","会议论文");

        conference.put("total",iArticleinformationService.selectTypeTatal());

        result.add(conference);

        HashMap<String, Object> dissertation = new HashMap<>();

        dissertation.put("type","学术论文");

        dissertation.put("total",iArticleinformationService.selectTypeTatal());

        result.add(dissertation);

        HashMap<String, Object> journalarticles = new HashMap<>();

        journalarticles.put("type","期刊论文");

        journalarticles.put("total",iArticleinformationService.selectTypeTatal());

        result.add(journalarticles);

        HashMap<String, Object> mediaarticles = new HashMap<>();

        mediaarticles.put("type","媒体文章");

        mediaarticles.put("total",iArticleinformationService.selectTypeTatal());

        result.add(mediaarticles);

        HashMap<String, Object> periodical = new HashMap<>();

        periodical.put("type","期刊");

        periodical.put("total",iArticleinformationService.selectTypeTatal());

        result.add(periodical);

        HashMap<String, Object> rubbingrubbings = new HashMap<>();

        rubbingrubbings.put("type","石刻拓片");

        rubbingrubbings.put("total",iArticleinformationService.selectTypeTatal());

        result.add(rubbingrubbings);

        HashMap<String, Object> stoneinscription = new HashMap<>();

        stoneinscription.put("type","石刻专题");

        stoneinscription.put("total",iArticleinformationService.selectTypeTatal());

        result.add(stoneinscription);

        HashMap<String, Object> ancientWorks = new HashMap<>();

        ancientWorks.put("type","古籍");

        ancientWorks.put("total",iBookinformationService.selectTypeTatal());

        result.add(ancientWorks);

        HashMap<String, Object> book = new HashMap<>();

        book.put("type","图书");

        book.put("total",iBookinformationService.selectTypeTatal());

        result.add(book);

        HashMap<String, Object> catalog = new HashMap<>();

        catalog.put("type","目录");

        catalog.put("total",iBookinformationService.selectTypeTatal());

        result.add(catalog);

        HashMap<String, Object> itemreport = new HashMap<>();

        itemreport.put("type","结项报告");

        itemreport.put("total",iBookinformationService.selectTypeTatal());

        result.add(itemreport);

        HashMap<String, Object> proceedings = new HashMap<>();

        proceedings.put("type","论文集");

        proceedings.put("total",iBookinformationService.selectTypeTatal());

        result.add(proceedings);

        HashMap<String, Object> stonealbum = new HashMap<>();

        stonealbum.put("type","石刻专题");

        stonealbum.put("total",iBookinformationService.selectTypeTatal());

        result.add(stonealbum);

        HashMap<String, Object> stonecompilation = new HashMap<>();

        stonecompilation.put("type","石刻汇编");

        stonecompilation.put("total",iBookinformationService.selectTypeTatal());

        result.add(stonecompilation);

        mmap.put("list",result);

        return "module/statistics/statistics";

    }

}
浏览器效果:
官方网址折线图: <!DOCTYPE html>
<html lang="zh" xmlns:th="http://www.thymeleaf.org">
<head>
<meta charset="utf-8">
<meta name="viewport" content="width=device-width, initial-scale=1.0">
<!--360浏览器优先以webkit内核解析-->
<title>高句丽介绍</title>
<link rel="shortcut icon" href="favicon.ico">
<link href="../static/css/bootstrap.min.css" th:href="@{/css/bootstrap.min.css}" rel="stylesheet"/>
<link href="../static/css/font-awesome.min.css" th:href="@{/css/font-awesome.min.css}" rel="stylesheet"/>
<link href="../static/css/main/animate.min.css" th:href="@{/css/main/animate.min.css}" rel="stylesheet"/>
<link href="../static/css/main/style.min862f.css" th:href="@{/css/main/style.min862f.css}" rel="stylesheet"/>
<style lang="css">
td {
align: center;
valign: middle;
text-align: center;
vertical-align: middle;
}
</style>
</head> <body class="gray-bg">
<div class="wrapper wrapper-content">
<div class="row">
<div class="col-sm-9">
<div class="ibox float-e-margins">
<div class="ibox-title">
<h4>资源数量统计表</h4>
</div>
<div class="ibox-content">
<table border="" cellspacing="" style="height: 200px;width: 100%;font-size: 0.5em" >
<thead>
<tr>
<td>类型</td>
<td>总数</td>
<!-- <td>已发布</td>
<td>未发布</td>-->
</tr>
</thead>
<tbody>
<tr th:each="a : ${list}">
<td th:text="${a.type}"></td>
<td th:text="${a.total}"></td>
<!--<td th:text="${a.publish}"></td>
<td th:text="${a.notPublish}"></td>-->
</tr>
</tbody>
</table>
</div>
</div>
</div> </div> <div class="col-sm-12"> <div class="ibox float-e-margins">
<div class="ibox-title">
<h4>资源数量统计图</h4>
</div>
<div class="ibox-content">
<div id="bar" style="height: 200px;width: 100%"></div> </div>
</div>
</div> <div class="col-sm-12"> <div class="ibox float-e-margins">
<div class="ibox-title">
<h4>资源数量统计图</h4>
</div>
<div class="ibox-content">
<div id="bars" style="height: 200px;width: 100%"></div> </div>
</div>
</div>
</div>
<script th:src="@{/js/jquery.min.js}"></script>
<script th:src="@{/js/bootstrap.min.js}"></script>
<!-- echart-->
<script th:src="@{/ajax/libs/echarts/echarts.common.min.js}"></script> <script th:inline="javascript">
// 基于准备好的dom,初始化echarts实例
var myChart = echarts.init(document.getElementById('bar'));
//折线
var myCharts = echarts.init(document.getElementById('bars'));
var list = [[${list}]]; var legendDate = [];
var total = [];
//var notPublish = [];
for (var i = ; i < list.length; i++) {
legendDate.push(list[i].type)
total.push(list[i].total)
// notPublish.push(list[i].notPublish)
} // 指定图表的配置项和数据
option = {
color: ['#3398DB'],
tooltip: {
trigger: 'axis',
axisPointer: { // 坐标轴指示器,坐标轴触发有效
type: 'shadow' // 默认为直线,可选为:'line' | 'shadow'
}
},
legend: {
data: '总数'
},
grid: {
left: '2%',
right: '3%',
bottom: '2%',
containLabel: true
},
xAxis: [{
type: 'category',
data: legendDate,
textStyle: {
color: '#c3dbff', //更改坐标轴文字颜色
fontSize : //更改坐标轴文字大小
},
axisLabel: {//x轴文字垂直显示
interval: ,
formatter:function(value)
{
return value.split("").join("\n");
}
}
// axisTick: {
// alignWithLabel: true
// }
}],
yAxis: {
type: 'value' },
series: [
{
name: '资源总量',
type: 'bar',
stack: '总量',
label: {
normal: {
show: true,
position: 'insideRight'
}
},
data: total
}/*,
{
name: '未发布',
type: 'bar',
stack: '总量',
label: {
normal: {
show: true,
position: 'insideRight'
}
},
data: notPublish
}*/
]
};
//折线
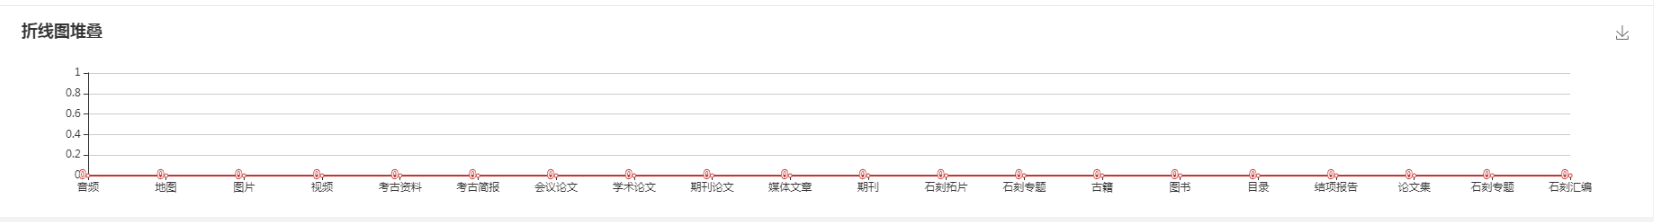
options = { title: {
text: '折线图堆叠'
},
tooltip: {
trigger: 'axis'
},
legend: {
data:legendDate
},
grid: {
left: '3%',
right: '4%',
bottom: '3%',
containLabel: true
},
toolbox: {
feature: {
saveAsImage: {}
}
},
xAxis: {
type: 'category',
boundaryGap: false,
data: legendDate
},
yAxis: {
type: 'value'
},
series: [{
name: '资源总量',
stack: '总量',
label: {
normal: {
show: true,
position: 'insideRight'
}
},
data: total,
type: 'line',
areaStyle: {}
}]
}; // 使用刚指定的配置项和数据显示图表。
myChart.setOption(option); myCharts.setOption(options);
</script>
</body>
</html>
前端统计图 echarts 实现简单柱状图的更多相关文章
- 【前端统计图】echarts实现简单柱状图
图片.png <!DOCTYPE html> <html> <head> <meta charset="utf-8"> <ti ...
- echarts之简单的入门——【二】再增加一个柱状图和图例组件
echarts之简单的入门——[一]做个带时间轴的柱状统计图 现在需求说,我需要知道日答题总次数和活跃人数,那么我们如何在上面的图表中增加一个柱状图呢? 如果你看过简单入门中的配置项手册中series ...
- echarts —— 绘制横向柱状图(圆角、无坐标轴)
UI给了设计图,看了一眼觉得简单,不就是无序列表布局嘛(ul,li),后来才知道那是echarts图,好吧,样式如下: 代码如下:(渐变色没做) <!DOCTYPE html> <h ...
- echarts的简单应用之(二)饼图
接上一篇文章: echarts的简单应用之(一)柱形图:https://www.cnblogs.com/jylee/p/9359363.html 本篇文章讲述饼图,撇过折线图不说,是因为折线图与柱形图 ...
- 如何基于 echarts 实现区间柱状图(包括横向)?
目录 需求 借鉴 echarts 的 demo 最终实现思路 实现效果 遇到的问题: 代码映射 源码 最后 始终如一 需求 需要利用 echarts 实现区间柱状图,效果如下: 效果来源于:g2-柱状 ...
- 【前端统计图】echarts多条折线图和横柱状图实现
参考链接:echarts官网:http://echarts.baidu.com/ 原型图(效果图): 图片.png 代码: <!DOCTYPE html> <html> < ...
- 【前端统计图】echarts实现属性修改
原图: 原代码: <!DOCTYPE html> <html> <head> <meta charset="UTF-8"> < ...
- 【前端统计图】echarts改变颜色属性的demo
一:柱状图改变颜色 图片.png 代码: <!DOCTYPE html> <html> <head> <meta charset="UTF-8&qu ...
- asp.net MVC项目开发之统计图echarts柱状图(一)
echarts统计图doc网址:http://echarts.baidu.com/echarts2/index.html 使用echarts,需要引用在js中,如果你已经下载echarts的js包,可 ...
随机推荐
- QScopedPointer
QScopedpointer detailed description the QScopedpointer class stores a pointer to a dynamically alloc ...
- jquery.validate.js客户端验证
参考:http://www.runoob.com/jquery/jquery-plugin-validate.html http://www.cnblogs.com/artech/archive/20 ...
- python时间处理详解-乾颐堂
1.获取当前时间的两种方法: import datetime,time now = time.strftime("%Y-%m-%d %H:%M:%S") print now now ...
- 掌握所有IO口的外部中断
外部中断配置流程 1.初始化IO口工作在普通IO.上拉输入状态. 2.首先开IO口组中断(P0IE=1.P1IE=1.P2IE=1): 3.开组内对应的具体某IO口中断(P0IEN.P1IEN.P2I ...
- mybatis常用方法总结
mybatis的强大特性之一就是动态SQL.我们在写复杂查询的时候,会发现复杂查询包括了各种各样的判断,我们很难一鼓作气的写出完美的查询.动态SQL语句可以帮助我们拼接不同的SQL语句,而已让我们的代 ...
- Spring Data JPA初使用 *****重要********
Spring Data JPA初使用 我们都知道Spring是一个非常优秀的JavaEE整合框架,它尽可能的减少我们开发的工作量和难度. 在持久层的业务逻辑方面,Spring开源组织又给我们带来了同样 ...
- Ubuntu14.04下 安装xhprof
1.下载xhprof包: wget http://pecl.php.net/get/xhprof-0.9.4.tgz 2.解压 进入扩展目录 .tgz cd /home/justphp/xhprof- ...
- mongodb学习-创建唯一索引(在已存在的集合创建)
如果在已存在的集合创建,可能会存在相同的值如下: 我们可以使用(2.x版本) db.users.ensureIndex({uid:1, name:1}, {unique:true, dropDups: ...
- 阿里云OSS-web直传---在服务端c#签名,浏览器直传
OSS web直传---在服务端php签名,浏览器直传 本文:OSS web直传---在服务端c#签名,浏览器直传 其他语言的范例地址:https://help.aliyun.com/document ...
- javascrip总结43:标签上自定义属性的操作
1 获取标签属性 语法: element.getAttribute('属性名') 返回对应属性的值 ,如果没有返回null. //html <div id="box" ind ...