matplotlib 进阶之Tight Layout guide
matplotlib教程学习笔记
如何使用tight_layout?
tight_layout作用于ticklabels, axis, labels, titles等Artist
简单的例子
import matplotlib.pyplot as plt

import numpy as np
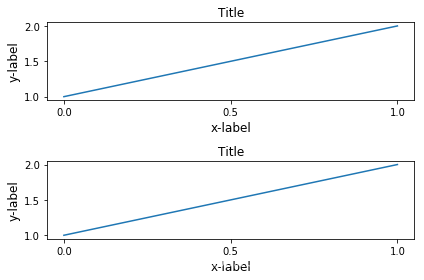
下面的例子和constrained_layout中的是一样的,notebook没有显示出其中的问题,就是labels被遮挡了
plt.rcParams['savefig.facecolor'] = "0.8"

def example_plot(ax, fontsize=12):

    ax.plot([1, 2])

    ax.locator_params(nbins=3)

    ax.set_xlabel('x-label', fontsize=fontsize)

    ax.set_ylabel('y-label', fontsize=fontsize)

    ax.set_title('Title', fontsize=fontsize)

plt.close('all')

fig, ax = plt.subplots()

example_plot(ax, fontsize=24)
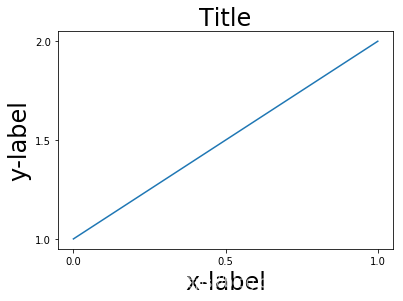
fig, ax = plt.subplots()

example_plot(ax, fontsize=24)

plt.tight_layout()
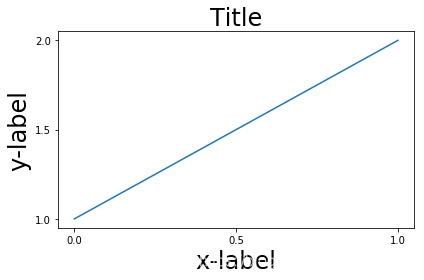
注意到,每次作图,我们都需要通过使用plt.tight_layout()函数来激活,我们也可以通过
fig.set_tight_layout(True)使得每次作图都会自动tight布局,当然,还可以通过将
figure.autolayout rcParam设置为True来实现。
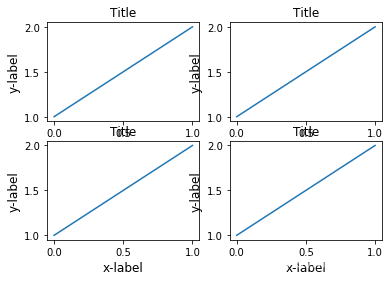
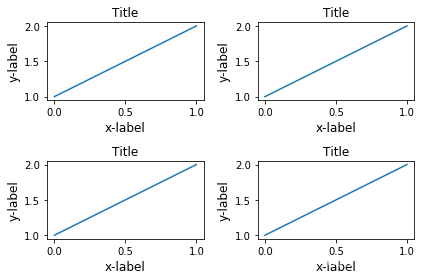
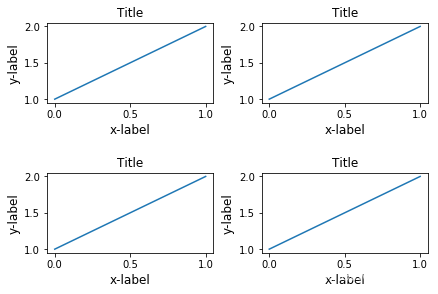
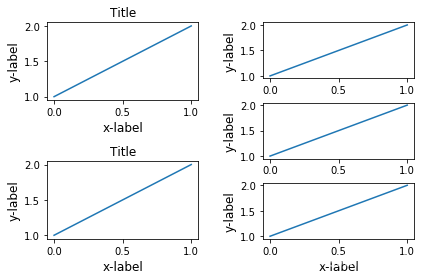
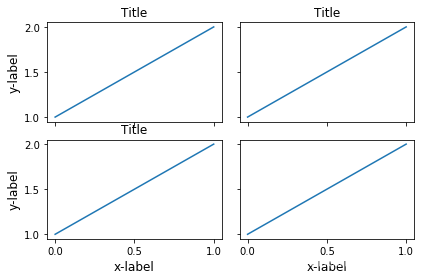
有多个plots的时候,会出现重叠的现象,通过tight_layout可以解决
plt.close('all')

fig, ((ax1, ax2), (ax3, ax4)) = plt.subplots(nrows=2, ncols=2)

example_plot(ax1)

example_plot(ax2)

example_plot(ax3)

example_plot(ax4)
fig, ((ax1, ax2), (ax3, ax4)) = plt.subplots(nrows=2, ncols=2)

example_plot(ax1)

example_plot(ax2)

example_plot(ax3)

example_plot(ax4)

plt.tight_layout()
tight_layout可以通过参数pad, w_pad, h_pad来设置一些布局的细节
fig, ((ax1, ax2), (ax3, ax4)) = plt.subplots(nrows=2, ncols=2)

example_plot(ax1)

example_plot(ax2)

example_plot(ax3)

example_plot(ax4)

plt.tight_layout(pad=0.4, w_pad=0.5, h_pad=2)
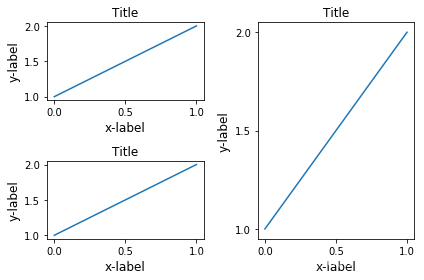
即使subplots的大小不一致,tight_layout依旧能够工作
plt.close('all')

fig = plt.figure()

ax1 = plt.subplot(221)

ax2 = plt.subplot(223)

ax3 = plt.subplot(122)

example_plot(ax1)

example_plot(ax2)

example_plot(ax3)

plt.tight_layout()
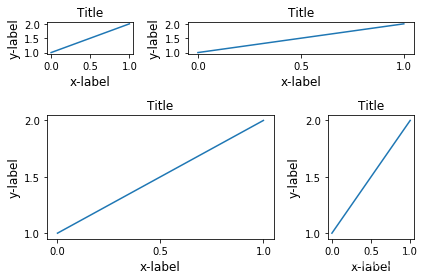
对subplot2grid也有效,注意subplot2grid参数为:
shape: e.g. (3, 3) 表示\(3 \times 3\)个格子
loc: e.g. (0, 1) 表示从第一行第二列个格子开始
rowspan: 跨行
colspan: 跨列
plt.close('all')

fig = plt.figure()

ax1 = plt.subplot2grid((3, 3), (0, 0))

ax2 = plt.subplot2grid((3, 3), (0, 1), colspan=2)

ax3 = plt.subplot2grid((3, 3), (1, 0), colspan=2, rowspan=2)

ax4 = plt.subplot2grid((3, 3), (1, 2), rowspan=2)

example_plot(ax1)

example_plot(ax2)

example_plot(ax3)

example_plot(ax4)

plt.tight_layout()
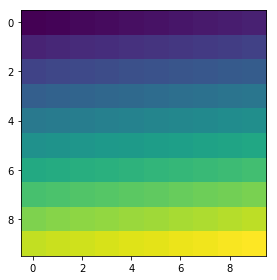
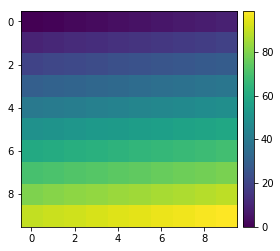
arr = np.arange(100).reshape((10, 10))

plt.close('all')

fig = plt.figure(figsize=(5, 4))

ax = plt.subplot(111)

im = ax.imshow(arr, interpolation="none")

plt.tight_layout()
Use with GridSpec
Gridspec 拥有自己的tight_layout()方法, 当然,plt.tight_layout也是有效的
import matplotlib.gridspec as gridspec

plt.close('all')

fig = plt.figure()

gs1 = gridspec.GridSpec(2, 1)

ax1 = fig.add_subplot(gs1[0])

ax2 = fig.add_subplot(gs1[1])

example_plot(ax1)

example_plot(ax2)

gs1.tight_layout(fig)
gs.tight_layout提供rect参数,表示一个外界的框框
默认是(0, 0, 1, 1)
(x1, y1, x2, y2)
(x1, y1)矩形限制框左下角点
(x2, y2)矩形限制框右上角点
fig = plt.figure()

gs1 = gridspec.GridSpec(2, 1)

ax1 = fig.add_subplot(gs1[0])

ax2 = fig.add_subplot(gs1[1])

example_plot(ax1)

example_plot(ax2)

gs1.tight_layout(fig, rect=[0, 0, 0.5, 1])
这个功能可以很好的用在分割图形,以及分块操作上
fig = plt.figure()

gs1 = gridspec.GridSpec(2, 1)

ax1 = fig.add_subplot(gs1[0])

ax2 = fig.add_subplot(gs1[1])

example_plot(ax1)

example_plot(ax2)

gs1.tight_layout(fig, rect=[0, 0, 0.5, 1])

gs2 = gridspec.GridSpec(3, 1)

for ss in gs2:

    ax = fig.add_subplot(ss)

    example_plot(ax)

    ax.set_title("")

    ax.set_xlabel("")

ax.set_xlabel("x-label", fontsize=12)

gs2.tight_layout(fig, rect=[0.5, 0, 1, 1], h_pad=0.5)

# We may try to match the top and bottom of two grids ::

#为了让俩块图形上下一致,需要进行下面的操作

top = min(gs1.top, gs2.top)

bottom = max(gs1.bottom, gs2.bottom)

gs1.update(top=top, bottom=bottom)

gs2.update(top=top, bottom=bottom)

plt.show()
但是呢,Title和右边的边边不齐,所以框框是不包含title的?
fig = plt.gcf()

gs1 = gridspec.GridSpec(2, 1)

ax1 = fig.add_subplot(gs1[0])

ax2 = fig.add_subplot(gs1[1])

example_plot(ax1)

example_plot(ax2)

gs1.tight_layout(fig, rect=[0, 0, 0.5, 1])

gs2 = gridspec.GridSpec(3, 1)

for ss in gs2:

    ax = fig.add_subplot(ss)

    example_plot(ax)

    ax.set_title("")

    ax.set_xlabel("")

ax.set_xlabel("x-label", fontsize=12)

gs2.tight_layout(fig, rect=[0.5, 0, 1, 1], h_pad=0.5)

top = min(gs1.top, gs2.top)

bottom = max(gs1.bottom, gs2.bottom)

gs1.update(top=top, bottom=bottom)

gs2.update(top=top, bottom=bottom)

top = min(gs1.top, gs2.top)

bottom = max(gs1.bottom, gs2.bottom)

gs1.tight_layout(fig, rect=[None, 0 + (bottom-gs1.bottom),

                            0.5, 1 - (gs1.top-top)])

gs2.tight_layout(fig, rect=[0.5, 0 + (bottom-gs2.bottom),

                            None, 1 - (gs2.top-top)],

                 h_pad=0.5)
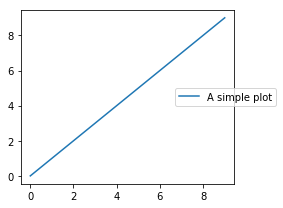
Legend and Annotations
fig, ax = plt.subplots(figsize=(4, 3))

lines = ax.plot(range(10), label='A simple plot')

ax.legend(bbox_to_anchor=(0.7, 0.5), loc='center left',)

fig.tight_layout()

plt.show()
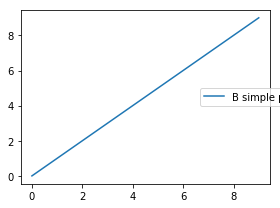
有些时候,我们不希望legend也在tight_layout的掌控范围之内,这个时候,我们可以设置leg.set_in_layout(False)
fig, ax = plt.subplots(figsize=(4, 3))

lines = ax.plot(range(10), label='B simple plot')

leg = ax.legend(bbox_to_anchor=(0.7, 0.5), loc='center left',)

leg.set_in_layout(False)

fig.tight_layout()

plt.show()
Use with AxesGrid1
没看懂
from mpl_toolkits.axes_grid1 import Grid

plt.close('all')

fig = plt.figure()

grid = Grid(fig, rect=111, nrows_ncols=(2, 2),

            axes_pad=0.25, label_mode='L',

            )

for ax in grid:

    example_plot(ax)

ax.title.set_visible(False)

plt.tight_layout()
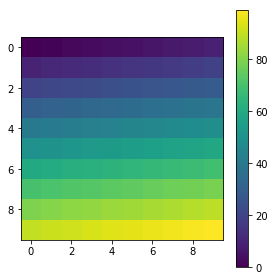
Colorbar
plt.close('all')

arr = np.arange(100).reshape((10, 10))

fig = plt.figure(figsize=(4, 4))

im = plt.imshow(arr, interpolation="none")

plt.colorbar(im, use_gridspec=True)

plt.close('all')

arr = np.arange(100).reshape((10, 10))

fig = plt.figure(figsize=(4, 4))

im = plt.imshow(arr, interpolation="none")

plt.colorbar(im, use_gridspec=True)

plt.tight_layout()
from mpl_toolkits.axes_grid1 import make_axes_locatable

plt.close('all')

arr = np.arange(100).reshape((10, 10))

fig = plt.figure(figsize=(4, 4))

im = plt.imshow(arr, interpolation="none")

divider = make_axes_locatable(plt.gca())

cax = divider.append_axes("right", "5%", pad="3%")

plt.colorbar(im, cax=cax)

plt.tight_layout()
函数链接
matplotlib 进阶之Tight Layout guide的更多相关文章
- matplotlib 进阶之Constrained Layout Guide
目录 简单的例子 Colorbars Suptitle Legends Padding and Spacing spacing with colobars rcParams Use with Grid ...
- Safe Area Layout Guide
原文:Safe Area Layout Guide Apple在iOS 7中引入了topLayoutGuide和bottomLayoutGuide作为UIViewController属性.它们允许您创 ...
- xcode9报错 Safe Area Layout Guide before iOS9.0
运行工程的时候会遇到 Safe Area Layout Guide before iOS9.0 这是因为xcode9 storyboard的设置里面多了 个 Safe Area Layout Gu ...
- Xcode 9.0 报错, Safe Area Layout Guide Before IOS 9.0
Xcode 9.0 新建工程报错 xcode Safe Area Layout Guide Before IOS 9.0 如下图,在Builds for 选择iOS9.0 and Later,不勾选U ...
- Safe Area Layout Guide before iOS 9.0
今天使用Xcode9.1重建项目,什么都没写运行报错:Safe Area Layout Guide before iOS 9.0!目前为止,不晓得原因,现记录解决方法:
- matplotlib 进阶之Legend guide
目录 matplotlib.pyplot.legend 方法1自动检测 方法2为现有的Artist添加 方3显示添加图例 控制图例的输入 为一类Artist设置图例 Legend 的位置 loc, b ...
- Log4j2进阶使用(Pattern Layout详细设置)
1.进阶说明 通过配置Layout打印格式化的日志, Log4j2支持很多的Layouts: CSV GELF HTML JSON Pattern Serialized Syslog XML YAML ...
- iOS---------- Safe Area Layout Guide before iOS 9.0
如果你们的项目不做iOS9以下支持就打开main.storyboard 去除Use safe Area Layout 如果不考虑iOS9以下支持就按照下面的步骤 选中控制器,右边面板的Build ...
- 【python】matplotlib进阶
参考文章:https://liam0205.me/2014/09/11/matplotlib-tutorial-zh-cn/ 几个重要对象:图像.子图.坐标轴.记号 figure:图像, subplo ...
随机推荐
- HTML5 基础内容(元素/属性/格式化)
HTML基础 1.HTML元素 1.1 元素指的是开始标签到结束标签的所有代码. 1.2 元素的内容是开始标签与结束标签之间的内容. 1.3大多数HTML元素可用有属性. 1.4标签可以拥有属性为元素 ...
- C++异常处理(try、catch、throw)
本文为转载 博主原文连接 我们通常希望自己编写的程序能够在异常的情况下也能作出相应的处理,而不至于程序莫名其妙地中断或者中止运行了.在设计程序时应充分考虑各种异常情况,并加以处理. 在C++中,一个函 ...
- 4.1 python中调用rust程序
概述 使用rust-cpython将rust程序做为python模块调用: 通常为了提高python的性能: 参考 https://github.com/dgrunwald/rust-cpython ...
- Android 极光推送集成
集成Jpush 1.用Android Studio创建一个Demo 2.创建激光推送开发者账号,要创建极光推送开发者帐号,请访问极光推送官方网站https://www.jiguang.cn/push ...
- java实现文件压缩
java实现文件压缩:主要是流与流之间的传递 代码如下: package com.cst.klocwork.service.zip; import java.io.File; import java. ...
- 【Java多线程】Java 中断
如何安全的结束一个正在运行的线程 java.lang.Thread类包含了一些常用的方法,如:start(), stop(), stop(Throwable) ,suspend(), destroy( ...
- Apache log4j2-RCE 漏洞复现(CVE-2021-44228)
Apache log4j2-RCE 漏洞复现 0x01 漏洞简介 Apache Log4j2是一个基于Java的日志记录工具.由于Apache Log4j2某些功能存在递归解析功能,攻击者可直接构造恶 ...
- 让你用Markdown的方式来做PPT
也许你是以为代码高手,Markdown写作高手,但你是PPT高手吗? 你的成绩有没有被PPT高手抢走过呢? 不会作精美PPT是不是很头疼呢? 今天就给大家介绍了一款PPT制作利器:Slidev~ 说S ...
- WPF将窗口置于桌面下方(可用于动态桌面)
WPF将窗口置于桌面下方(可用于动态桌面) 先来看一下效果: 界面元素很简单,就一个Button按钮,然后写个定时器,定时更新Button按钮中的内容为当前时间,下面来介绍下原理,和界面组成. 窗口介 ...
- CPU中断数查看与网卡中断绑核
CPU中断数查看 多核CPU每个核心CPU发生中断的数量查看 # mpstat -I SUM -P ALL 1 3 Linux 5.4.0-40-generic (verify-new-511kern ...