绘图工具graphviz学习使用
画图工具:
http://www.tuicool.com/articles/r2iAfa
http://www.tuicool.com/articles/RjQfey
绘图工具graphviz学习使用
起因
最近完成了研究生毕业设计,在写毕业论文时,老师曾经推荐使用代码来画相关的图,当时时间有些紧,所以没有这样做。最近在看rapidjson的文档,看到miloyip 文档中的图都是用dot文件的源代码编译出来的,一查,原来是graphviz的源代码。遂用了半天简单学习了下graphviz的语法和使用,感觉很不错,以后画图有了一个不错的工具。
graphviz 是一个运用广泛的命令行绘图软体,不过说是绘图软体,它能绘的图并不是一般人想像中的漫画或logo,而是数学意义上的graph,比较通俗的说法就是「关系图」。
安装
graphviz 支持 Windows、Mac OS X、FreeBSD、Solaris、Linux 等多种系统
Ubuntu或Debian下安装很简单:
sudo apt-get install graphviz
Mac下使用brew
brew install graphviz
Windows 下参考 http://www.graphviz.org/Download_windows.php
入门使用
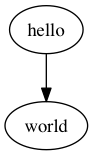
1. 编写以dot为后缀的源代码文件,如:
// hello.dot digraph {
hello -> world;}
2. 使用dot命令编译,如
dot hello.dot -T png -o hello.png
完整的命令为:
<cmd> <inputfile> -T <format> -o <outputfile>
其中graphviz 的<cmd> 有好几种,每种使用方法都完全相同,差别只在于渲染出来的图片效果不一样。man中的简介是这样的:
| <cmd> | 介绍 |
|---|---|
| dot | 渲染的图具有明确方向性。 |
| neato | 渲染的图缺乏方向性。 |
| twopi | 渲染的图采用放射性布局。 |
| circo | 渲染的图采用环型布局。 |
| fdp | 渲染的图缺乏方向性。 |
| sfdp | 渲染大型的图,图片缺乏方向性。 |
可以透过man <cmd> 取得进一步说明。但还是亲自用用比较容易理解。在本文中,凡没有说明的图,预设都是以dot渲染出来的。
3. 查看效果
效果如下:
语法介绍
graphviz使用dot语法来说明,其它语法可以用形式化的描述如下:
graph = [strict] (digraph | graph) id ’{’ stmt-list ’}’stmt-list = [stmt [’;’] [stmt-list ] ]stmt = attr-stmt | node-stmt | edge-stmt | subgraph | id ’=’ idattr-stmt = (graph | node | edge) attr-listattr-list = ’[’ [a-list ] ’]’ [attr-list]a-list = id ’=’ id [’,’] [a-list]node-stmt = node-id [attr-list]node-id = id [port]port = port-location [port-angle] | port-angle [port-location]port-location = ’:’ id|’:’ ’(’id’,’id’)’port-angle = ’@’ idedge-stmt = (node-id | subgraph) edgeRHS [attr-list]edgeRHS = edgeop (node-id | subgraph) [edgeRHS]subgraph = [subgraph id] ’{’ stmt-list ’}’ | subgraph id
graphviz 有两种图,一种是无向图graph,边用--连接,一种是有向图digraph,边用->连接,这个可以很简单的实践。
具体的图说明内容包含属性(attr)、节点(node)、边(edge)和子图(subgraph)说明。
节点属性如下 :
| Name | Default | Values |
|---|---|---|
| color | black | node shape color |
| comment | any string (format-dependent) | |
| distortion | 0.0 | node distortion for shape=polygon |
| fillcolor | lightgrey/black | node fill color |
| fixedsize | false | label text has no affect on node size |
| fontcolor | black | type face color |
| fontname | Times-Roman | font family |
| fontsize | 14 | point size of label |
| group | name of node’s group | |
| height | .5 | height in inches |
| label | node name | any string |
| layer | overlay range | all, id or id:id |
| orientation | 0.0 | node rotation angle |
| peripheries | shape-dependent | number of node boundaries |
| regular | false | force polygon to be regular |
| shape | ellipse | node shape; see Section 2.1 and Appendix E |
| shapefile | external EPSF or SVG custom shape file | |
| sides | 4 | number of sides for shape=polygon |
| skew | 0.0 | skewing of node for shape=polygon |
| style | graphics options, e.g. bold, dotted, filled; cf. Section 2.3 | |
| URL | URL associated with node (format-dependent) | |
| width | .75 | width in inches |
| z | 0.0 | z coordinate for VRML output |
边属性如下:
| Name | Default | Values |
|---|---|---|
| arrowhead | normal | style of arrowhead at head end |
| arrowsize | 1.0 | scaling factor for arrowheads |
| arrowtail | normal | style of arrowhead at tail end |
| color | black | edge stroke color |
| comment | any string (format-dependent) | |
| constraint | true | use edge to affect node ranking |
| decorate | if set, draws a line connecting labels with their edges | |
| dir | forward | forward, back, both, or none |
| fontcolor | black | type face color |
| fontname | Times-Roman | font family |
| fontsize | 14 | point size of label |
| headlabel | label placed near head of edge | |
| headport | n,ne,e,se,s,sw,w,nw | |
| headURL | URL attached to head label if output format is ismap | |
| label | edge label | |
| labelangle | -25.0 | angle in degrees which head or tail label is rotated off edge |
| labeldistance | 1.0 | scaling factor for distance of head or tail label from node |
| labelfloat | false | lessen constraints on edge label placement |
| labelfontcolor | black | type face color for head and tail labels |
| labelfontname | Times-Roman | font family for head and tail labels |
| labelfontsize | 14 | point size for head and tail labels |
| layer | overlay range | all, id or id:id |
| lhead | name of cluster to use as head of edge | |
| ltail | name of cluster to use as tail of edge | |
| minlen | 1 | minimum rank distance between head and tail |
| samehead | tag for head node; edge heads with the same tag are | |
| sametail | merged onto the same port | |
| style | tag for tail node; edge tails with the same tag are merged onto the same port | |
| taillabel | graphics options, e.g. bold, dotted, filled; cf. Section 2.3 | |
| tailport | label placed near tail of edge n,ne,e,se,s,sw,w,nw | |
| tailURL | URL attached to tail label if output format is ismap | |
| weight | 1 | integer cost of stretching an edge |
图属性如下:
| Name | Default | Values |
|---|---|---|
| bgcolor | background color for drawing, plus initial fill color | |
| center | false | center drawing on page |
| clusterrank | local | may be global or none |
| color | black | for clusters, outline color, and fill color if fillcolor not defined |
| comment | any string (format-dependent) | |
| compound | false | allow edges between clusters |
| concentrate | false | enables edge concentrators |
| fillcolor | black | cluster fill color |
| fontcolor | black | type face color |
| fontname | Times-Roman | font family |
| fontpath | list of directories to search for fonts | |
| fontsize | 14 | point size of label |
| label | any string | |
| labeljust | centered | ”l” and ”r” for left- and right-justified cluster labels, respectively |
| labelloc | top | ”t” and ”b” for top- and bottom-justified cluster labels, respectively |
| layers | id:id:id… | |
| margin | .5 | margin included in page, inches |
| mclimit | 1.0 | scale factor for mincross iterations |
| nodesep | .25 | separation between nodes, in inches. |
| nslimit | if set to f, bounds network simplex iterations by (f)(number of nodes) when setting x-coordinates | |
| nslimit1 | if set to f, bounds network simplex iterations by (f)(number of nodes) when ranking nodes | |
| ordering | if out out edge order is preserved | |
| orientation | portrait | if rotate is not used and the value is landscape, use landscape orientation |
| page | unit of pagination, e.g. “8.5,11” | |
| pagedir | BL | traversal order of pages |
| quantum | if quantum ¿ 0.0, node label dimensions will be rounded to integral multiples of quantum | |
| rank | same, min, max, source or sink | |
| rankdir | TB | LR (left to right) or TB (top to bottom) |
| ranksep | .75 | separation between ranks, in inches. |
| ratio | approximate aspect ratio desired, fill or auto | |
| remincross | if true and there are multiple clusters, re-run crossing minimization | |
| rotate | If 90, set orientation to landscape | |
| samplepoints | 8 | number of points used to represent ellipses and circles on output (cf. Appendix C |
| searchsize | 30 | maximum edges with negative cut values to check when looking for a minimum one during network simplex |
| size | maximum drawing size, in inches | |
| style | graphics options, e.g. filled for clusters | |
| URL | URL associated with graph (format-dependent) |
实例
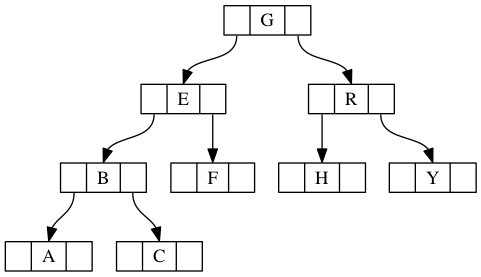
介绍了上面的语法,实际使用的时候就是学习几个详细的例子,下面是一个二叉树代码:
digraph g {node [shape = record,height=.1];node0[label = "<f0> |<f1> G|<f2> "];node1[label = "<f0> |<f1> E|<f2> "];node2[label = "<f0> |<f1> B|<f2> "];node3[label = "<f0> |<f1> F|<f2> "];node4[label = "<f0> |<f1> R|<f2> "];node5[label = "<f0> |<f1> H|<f2> "];node6[label = "<f0> |<f1> Y|<f2> "];node7[label = "<f0> |<f1> A|<f2> "];node8[label = "<f0> |<f1> C|<f2> "];"node0":f2 -> "node4":f1;"node0":f0 -> "node1":f1;"node1":f0 -> "node2":f1;"node1":f2 -> "node3":f1;"node2":f2 -> "node8":f1;"node2":f0 -> "node7":f1;"node4":f2 -> "node6":f1;"node4":f0 -> "node5":f1;}
效果如下:
python调用
除了可以使用dot文件编写图形外,也可以使用python编写相关的代码,生成图形文件,
安装方法:
pip install pygraphviz
引用 PyGraphviz:
import pygraphviz as pgv
初始化图类:
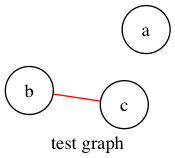
G=pgv.AGraph()
增加结点和边:
G.add_node('a') # adds node 'a'G.add_edge('b','c') # adds edge 'b'-'c' (and also nodes 'b', 'c')
设置属性:
G.graph_attr['label']='test graphf'G.node_attr['shape']='circle'G.edge_attr['color']='red'
设置输出的格式:
G.layout() # default to neatoG.layout(prog='dot') # use do
输出到文件:
G.draw('file.png') # write previously positioned graph to PNG fileG.draw('file.ps',prog='circo') # use circo to position, write PS file
效果:
参考
Powered by Jekyll with Type Theme
绘图工具graphviz学习使用的更多相关文章
- jquery 绘图工具 flot 学习笔记
今天想做一个统计图表,像163博客的流量统计一样的,借助 flot 实现了,而且很简单. flot网址:http://code.google.com/p/flot/ 下载 JS 文件,使用方法和 jq ...
- mark::开源绘图工具graphviz
http://blog.csdn.net/iamljj/article/details/5862930 http://codeforces.com/contest/601/problem/D
- Graphviz - Graph Visualization Software 开源可视化绘图工具(visio 类)
http://www.graphviz.org/Download_windows.php Welcome to Graphviz Available translations: Romanian, ...
- Opencv实现的简易绘图工具
第一次写博,还是个菜鸟.最近开始学习Opencv,试着写了个简易的绘图工具(目前只写了画线和橡皮擦部分,画其它图形还有待往里添加),也算是记录自己的学习之路. #include "stdaf ...
- 画图工具Graphviz安装配置
Graphviz (英文:Graph Visualization Software的缩写)是一个由AT&T实验室启动的开源工具包,用于绘制DOT语言脚本描述的图形.它也提供了供其它软件使用的库 ...
- HTML5 canvas 在线画笔绘图工具(一)
HTML5 canvas 在线画笔绘图工具(一) 功能介绍 这是我用Javascript写的第一个程序,在写的过程中走了很多弯路,所以写完之后想分享出来,给与我一样的初学者做为学习的参考,同时在编写这 ...
- Python使用Plotly绘图工具,绘制饼图
今天我们来学习一下如何使用Python的Plotly绘图工具,绘制饼图 使用Plotly绘制饼图的方法,我们需要使用graph_objs中的Pie函数 函数中最常用的两个属性values,用于赋值给需 ...
- Python使用Plotly绘图工具,绘制甘特图
今天来讲一下如何使用Python 的绘图工具Plotly来绘制甘特图的方法 甘特图大家应该了解熟悉,就是通过条形来显示项目的进度.时间安排等相关情况的. 我们今天来学习一下,如何使用ployly来绘制 ...
- H5新特性——--第三方绘图工具库 echarts(canvas)---SVG绘图
今天学习的内容 3.1:h5新特性---第三方绘图工具库 echarts(canvas) 百度 echarts;d3;two.js;.... 3.2:h5新特性---SVG绘图 3.2:h5新特性-- ...
随机推荐
- Golden Pyramid
Golden Pyramid Our Robo-Trio need to train for future journeys and treasure hunts. Stephan has built ...
- c++ 14
一.堆栈(stack) stack -> vector/deque/list push -> push_back pop -> pop_back top -> bac ...
- 利用内存结构及多线程优化多图片下载(IOS篇)
利用内存结构及多线程优化多图片下载(IOS篇) 前言 下载地址, 后续发布, 请继续关注本blog 在IOS中,我们常常遇到多图片下载的问题.最简单的解决方案是直接利用别人写好的框架.但是这如同练武, ...
- Linux 计算器
bc: 默认没有小数位,使用scale=2设置保留的位数.
- DoTween学习笔记(一)
DOTween是一个快速,高效,完全统一的类型安全的对象属性动画引擎,免费开源,大量的高级特性. DoTween兼容Unity4.5以上的版本,支持的平台: Win, Mac, Unity WebPl ...
- NoSQL 简介
NoSQL(NoSQL = Not Only SQL ),意即"不仅仅是SQL". 在现代的计算系统上每天网络上都会产生庞大的数据量. 这些数据有很大一部分是由关系数据库管理系统( ...
- Ant命令行操作
Ant命令行操作 Ant构建文件可以将项目编译,打包,測试,它是Apache软件基金会jakarta文件夹中的一个子项目,具有跨平台性,操作简单,并且非常easy上手. 关于Ant执行,能够在项目中找 ...
- Chrome开发者工具详解(3):Timeline面板
Timeline面板 Timeline面板是整个面板里面最复杂的一个面板,涉及的东西比较多.可以利用这个面板来记录和分析网页运行过程中的所有活动行为信息. 你可以充分利用这个面板来分析你的网页的程序性 ...
- 创建一个简单的配置android编译环境的脚本
由于有多个Android项目,每个项目配置编译环境时选项都不同,所以尝试写一个sh脚本来完成这个功能. 首先进入bin文件夹,新建一个文件enbuild $ cd ~/bin $ touch ...
- 新浪授权认证(不用SDK)
微博开放平台:http://open.weibo.com/ 微博开放接口的调用,如发微博.关注等,都是需要获取用户身份认证的.目前微博开放平台用户身份鉴权主要采用的是OAuth2.0.另外,为了方便开 ...