output value . Sigmoid neurons are similar to perceptrons, but modified so that small changes in their weights and bias cause only a small change in their output.
http://neuralnetworksanddeeplearning.com/chap1.html
. Sigmoid neurons are similar to perceptrons, but modified so that small changes in their weights and bias cause only a small change in their output.
http://neuralnetworksanddeeplearning.com/chap3.html


// This is a paper.js widget to show a single neuron learning. In
// particular, the widget is used to show the learning slowdown that
// occurs when the output is saturated.
//
// The same basic widget is used several times, in slightly different
// configurations. paper.js makes it somewhat complex to reuse the
// code, so I have simply duplicated the code. This can give rise to
// bugs if one is not careful to keep the code in sync, so I have
// separated the code into two pieces.
//
// The first piece is the header code. This changes between widgets.
// It sets up things like the starting weight, bias, cost function,
// and so on -- things which may vary betweens widgets.
//
// The second piece is the body code. This is almost exactly the same
// for the different widgets. Note, however, that the costGraphX and
// epochX variables change name, due to a bug in the way paperjs
// handles scope.
//
// We can make these changes by searching on costGraph1 and replacing
// with costGraph2, costGraph3 etc, by replacing epoch1 with epoch2,
// epoch3 etc, and by replcacing cost1 with cost2, cost3 etc.
//
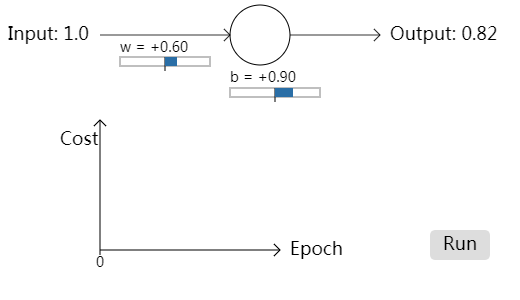
// This separation makes it easy to maintain the duplicated code. // HEADER CODE var startingWeight = 0.6;
var startingBias = 0.9;
var eta = 0.15;
var numFrames = 300; quadratic_cost = {
fn: function(a) {return a*a/2;},
derivative: function(a) {return a*a*(1-a);},
scaling: 240 // used to scale on the graph
} cross_entropy_cost = {
fn: function(a) {return -Math.log(1-a);},
derivative: function(a) {return 1/(1-a);},
scaling: 30
} cost1 = quadratic_cost; // A path for the graph.
costGraph1 = new Path();
costGraph1.strokeColor = "#2A6EA6"; // BODY CODE // STATIC ELEMENTS
//
// Note that this includes some paper.js items which will later be
// modified, e.g., the variables output and weightText. This section
// merely sets the static parts of the elements. var input = new PointText(new Point(8, 40));
input.fontSize = 18;
input.content = "Input: 1.0"; arrow(new Point(100, 35), new Point(230, 35), 0.8); // input arrow var neuron = new Path.Circle(new Point(260, 35), 30);
neuron.strokeColor = "black"; arrow(new Point(290, 35), new Point(380, 35), 0.8); // output arrow // The output text's content will be set dynamically, later
var output = new PointText(new Point(390, 40));
output.fontSize = 18; // The weight text and bar
var weightText = new PointText(new Point(120, 52));
weightText.fontSize=14;
var weightBar = new Path.Rectangle(new Rectangle(120, 57, 90, 9));
weightBar.strokeColor = "grey";
weightBar.strokeWidth = 1;
var weightTick = new Path(new Point(165, 57), new Point(165, 71));
weightTick.strokeColor = "black";
var weightSlider = new Path.Line(
new Point(165, 61.5), new Point(165+weight*20, 61.5));
weightSlider.strokeColor = "#2A6EA6";
weightSlider.strokeWidth = 9; // The bias text and bar
var biasText = new PointText(new Point(230, 82));
biasText.fontSize = 14;
var biasBar = new Path.Rectangle(new Rectangle(230, 88, 90, 9));
biasBar.strokeColor = "grey";
biasBar.strokeWidth = 1;
var biasTick = new Path(new Point(275, 88), new Point(275, 102));
biasTick.strokeColor = "black";
var biasSlider = new Path.Line(
new Point(275, 92.5), new Point(275+bias*20, 92.5));
biasSlider.strokeColor = "#2A6EA6";
biasSlider.strokeWidth = 9; // Axes for the graph
arrow(new Point(100, 250), new Point(100, 120));
arrow(new Point(100, 250), new Point(130+numFrames/2, 250)); // Labels on the axes
var costText = new PointText(new Point(60, 145));
costText.fontSize = 18;
costText.content = "Cost"; var epoch1LabelText = new PointText(new Point(140+numFrames/2, 255));
epoch1LabelText.fontSize = 18;
epoch1LabelText.content = "Epoch"; // Marker for the current epoch
var epoch1Tick = new Path(new Point(100, 250), new Point(100, 255));
epoch1Tick.strokeColor = "black"; var epoch1Number = new PointText(new Point(100, 267));
epoch1Number.fontSize = 14;
epoch1Number.justification = "center"; // We group the epochTick and epochNumber, to make it easy to move
epoch1 = new Group([epoch1Tick, epoch1Number]); // Initialize the dynamic elements. It's convenient to do this in a
// function, so that function can also be called upon a (re)start of
// the widget. var weight, bias;
initDynamicElements(); function initDynamicElements() {
weight = startingWeight;
bias = startingBias;
weightText.content = paramContent("w = ", weight);
weightSlider.segments[1].point.x = 165+weight*20;
biasText.content = paramContent("b = ", bias);
biasSlider.segments[1].point.x = 275+bias*20;
output.content = outputContent(weight, bias);
epoch1.position.x = 100;
epoch1Number.content = "0";
costGraph1.removeSegments();
} function paramContent(s, x) {
sign = (x >= 0)? "+": "";
return s+sign+x.toFixed(2);
} // The run button var runBox = new Path.Rectangle(new Rectangle(430, 230, 60, 30), 5);
runBox.fillColor = "#dddddd"; var runText = new PointText(new Point(460, 250));
runText.justification = "center";
runText.fontSize = 18;
runText.content = "Run"; var runIcon = new Group([runBox, runText]); runIcon.onMouseEnter = function(event) {
runBox.fillColor = "#aaaaaa";
} runIcon.onMouseLeave = function(event) {
runBox.fillColor = "#dddddd";
} var playing = false;
var count = 0; runIcon.onClick = function(event) {
initDynamicElements();
this.visible = false;
weight = startingWeight;
bias = startingBias;
playing = true;
} // The actual procedure function onFrame(event) {
if (playing) {
a = outputValue(weight, bias);
delta = cost1.derivative(a);
weight += -eta*delta;
bias += -eta*delta;
weightText.content = paramContent("w = ", weight);
weightSlider.segments[1].point.x = 165+weight*20;
biasText.content = paramContent("b = ", bias);
biasSlider.segments[1].point.x = 275+bias*20;
output.content = outputContent(weight, bias);
if (count % 2 === 0) {epoch1.position.x += 1;}
costGraph1.add(new Point(epoch1.position.x, 250-cost1.scaling*cost1.fn(a)));
epoch1Number.content = count;
count += 1;
if (count > numFrames) {
count = 0;
runIcon.visible = true;
playing = false;
}
}
} function outputValue(weight, bias) {
return sigmoid(weight+bias);
} function outputContent(weight, bias) {
return "Output: "+outputValue(weight, bias).toFixed(2);
} function sigmoid(z) {
return 1/(1+Math.exp(-z));
} function arrow(point1, point2, width, color) {
if (typeof width === 'undefined') {width=1};
if (typeof color === 'undefined') {color='black'};
delta = point1 - point2;
n = delta/delta.length;
nperp = new Point(-n.y, n.x);
line = new Path(point1, point2);
line.strokeColor = color;
line.strokeWidth = width;
arrow_stroke_1 = new Path(point2, point2+(n+nperp)*6);
arrow_stroke_1.strokeWidth = width;
arrow_stroke_1.strokeColor = color;
arrow_stroke_2 = new Path(point2, point2+(n-nperp)*6);
arrow_stroke_2.strokeWidth = width;
arrow_stroke_2.strokeColor = color;
}
http://neuralnetworksanddeeplearning.com/js/saturation4.js
// This is a paper.js widget to show a single neuron learning. In
// particular, the widget is used to show the learning slowdown that
// occurs when the output is saturated.
//
// The same basic widget is used several times, in slightly different
// configurations. paper.js makes it somewhat complex to reuse the
// code, so I have simply duplicated the code. This can give rise to
// bugs if one is not careful to keep the code in sync, so I have
// separated the code into two pieces.
//
// The first piece is the header code. This changes between widgets.
// It sets up things like the starting weight, bias, cost function,
// and so on -- things which may vary betweens widgets.
//
// The second piece is the body code. This is almost exactly the same
// for the different widgets. Note, however, that the costGraphX and
// epochX variables change name, due to a bug in the way paperjs
// handles scope.
//
// We can make these changes by searching on costGraph1 and replacing
// with costGraph2, costGraph3 etc, and by replacing epoch1 with
// epoch2, epoch3 etc.
//
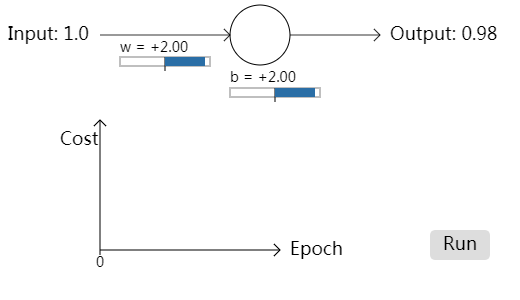
// This separation makes it easy to maintain the duplicated code. // HEADER CODE var startingWeight = 2.0;
var startingBias = 2.0;
var eta = 0.005;
var numFrames = 300; quadratic_cost = {
fn: function(a) {return a*a/2;},
derivative: function(a) {return a*a*(1-a);},
scaling: 240 // used to scale on the graph
} cross_entropy_cost = {
fn: function(a) {return -Math.log(1-a);},
derivative: function(a) {return 1/(1-a);},
scaling: 30
} cost4 = cross_entropy_cost; // A path for the graph.
costGraph4 = new Path();
costGraph4.strokeColor = "#2A6EA6"; // BODY CODE // STATIC ELEMENTS
//
// Note that this includes some paper.js items which will later be
// modified, e.g., the variables output and weightText. This section
// merely sets the static parts of the elements. var input = new PointText(new Point(8, 40));
input.fontSize = 18;
input.content = "Input: 1.0"; arrow(new Point(100, 35), new Point(230, 35), 0.8); // input arrow var neuron = new Path.Circle(new Point(260, 35), 30);
neuron.strokeColor = "black"; arrow(new Point(290, 35), new Point(380, 35), 0.8); // output arrow // The output text's content will be set dynamically, later
var output = new PointText(new Point(390, 40));
output.fontSize = 18; // The weight text and bar
var weightText = new PointText(new Point(120, 52));
weightText.fontSize=14;
var weightBar = new Path.Rectangle(new Rectangle(120, 57, 90, 9));
weightBar.strokeColor = "grey";
weightBar.strokeWidth = 1;
var weightTick = new Path(new Point(165, 57), new Point(165, 71));
weightTick.strokeColor = "black";
var weightSlider = new Path.Line(
new Point(165, 61.5), new Point(165+weight*20, 61.5));
weightSlider.strokeColor = "#2A6EA6";
weightSlider.strokeWidth = 9; // The bias text and bar
var biasText = new PointText(new Point(230, 82));
biasText.fontSize = 14;
var biasBar = new Path.Rectangle(new Rectangle(230, 88, 90, 9));
biasBar.strokeColor = "grey";
biasBar.strokeWidth = 1;
var biasTick = new Path(new Point(275, 88), new Point(275, 102));
biasTick.strokeColor = "black";
var biasSlider = new Path.Line(
new Point(275, 92.5), new Point(275+bias*20, 92.5));
biasSlider.strokeColor = "#2A6EA6";
biasSlider.strokeWidth = 9; // Axes for the graph
arrow(new Point(100, 250), new Point(100, 120));
arrow(new Point(100, 250), new Point(130+numFrames/2, 250)); // Labels on the axes
var costText = new PointText(new Point(60, 145));
costText.fontSize = 18;
costText.content = "Cost"; var epoch4LabelText = new PointText(new Point(140+numFrames/2, 255));
epoch4LabelText.fontSize = 18;
epoch4LabelText.content = "Epoch"; // Marker for the current epoch
var epoch4Tick = new Path(new Point(100, 250), new Point(100, 255));
epoch4Tick.strokeColor = "black"; var epoch4Number = new PointText(new Point(100, 267));
epoch4Number.fontSize = 14;
epoch4Number.justification = "center"; // We group the epochTick and epochNumber, to make it easy to move
epoch4 = new Group([epoch4Tick, epoch4Number]); // Initialize the dynamic elements. It's convenient to do this in a
// function, so that function can also be called upon a (re)start of
// the widget. var weight, bias;
initDynamicElements(); function initDynamicElements() {
weight = startingWeight;
bias = startingBias;
weightText.content = paramContent("w = ", weight);
weightSlider.segments[1].point.x = 165+weight*20;
biasText.content = paramContent("b = ", bias);
biasSlider.segments[1].point.x = 275+bias*20;
output.content = outputContent(weight, bias);
epoch4.position.x = 100;
epoch4Number.content = "0";
costGraph4.removeSegments();
} function paramContent(s, x) {
sign = (x >= 0)? "+": "";
return s+sign+x.toFixed(2);
} // The run button var runBox = new Path.Rectangle(new Rectangle(430, 230, 60, 30), 5);
runBox.fillColor = "#dddddd"; var runText = new PointText(new Point(460, 250));
runText.justification = "center";
runText.fontSize = 18;
runText.content = "Run"; var runIcon = new Group([runBox, runText]); runIcon.onMouseEnter = function(event) {
runBox.fillColor = "#aaaaaa";
} runIcon.onMouseLeave = function(event) {
runBox.fillColor = "#dddddd";
} var playing = false;
var count = 0; runIcon.onClick = function(event) {
initDynamicElements();
this.visible = false;
weight = startingWeight;
bias = startingBias;
playing = true;
} // The actual procedure function onFrame(event) {
if (playing) {
a = outputValue(weight, bias);
delta = cost4.derivative(a);
weight += -eta*delta;
bias += -eta*delta;
weightText.content = paramContent("w = ", weight);
weightSlider.segments[1].point.x = 165+weight*20;
biasText.content = paramContent("b = ", bias);
biasSlider.segments[1].point.x = 275+bias*20;
output.content = outputContent(weight, bias);
if (count % 2 === 0) {epoch4.position.x += 1;}
costGraph4.add(new Point(epoch4.position.x, 250-cost4.scaling*cost4.fn(a)));
epoch4Number.content = count;
count += 1;
if (count > numFrames) {
count = 0;
runIcon.visible = true;
playing = false;
}
}
} function outputValue(weight, bias) {
return sigmoid(weight+bias);
} function outputContent(weight, bias) {
return "Output: "+outputValue(weight, bias).toFixed(2);
} function sigmoid(z) {
return 1/(1+Math.exp(-z));
} function arrow(point1, point2, width, color) {
if (typeof width === 'undefined') {width=1};
if (typeof color === 'undefined') {color='black'};
delta = point1 - point2;
n = delta/delta.length;
nperp = new Point(-n.y, n.x);
line = new Path(point1, point2);
line.strokeColor = color;
line.strokeWidth = width;
arrow_stroke_1 = new Path(point2, point2+(n+nperp)*6);
arrow_stroke_1.strokeWidth = width;
arrow_stroke_1.strokeColor = color;
arrow_stroke_2 = new Path(point2, point2+(n-nperp)*6);
arrow_stroke_2.strokeWidth = width;
arrow_stroke_2.strokeColor = color;
}
output value . Sigmoid neurons are similar to perceptrons, but modified so that small changes in their weights and bias cause only a small change in their output.的更多相关文章
- 使用神经网络识别手写数字Using neural nets to recognize handwritten digits
The human visual system is one of the wonders of the world. Consider the following sequence of handw ...
- chapter1:using neural nets to recognize handwritten digits
two important types of artificial neuron :the perceptron and the sigmoid neuron Perceptrons 感知机的输入个数 ...
- 提高神经网络的学习方式Improving the way neural networks learn
When a golf player is first learning to play golf, they usually spend most of their time developing ...
- 神经网络和Deep Learning
参考资料: 在线免费书籍 http://neuralnetworksanddeeplearning.com/chap1.html Chapter 1 1. perceptron 感知机 it's a ...
- (六)6.16 Neurons Networks linear decoders and its implements
Sparse AutoEncoder是一个三层结构的网络,分别为输入输出与隐层,前边自编码器的描述可知,神经网络中的神经元都采用相同的激励函数,Linear Decoders 修改了自编码器的定义,对 ...
- [LeetCode] Similar RGB Color 相似的红绿蓝颜色
In the following, every capital letter represents some hexadecimal digit from 0 to f. The red-green- ...
- CS229 6.16 Neurons Networks linear decoders and its implements
Sparse AutoEncoder是一个三层结构的网络,分别为输入输出与隐层,前边自编码器的描述可知,神经网络中的神经元都采用相同的激励函数,Linear Decoders 修改了自编码器的定义,对 ...
- Digital Adjustment of DC-DC Converter Output Voltage in Portable Applications
http://pdfserv.maximintegrated.com/en/an/AN818.pdf http://www.maximintegrated.com/app-notes/index.mv ...
- Simple Addition Permits Voltage Control Of DC-DC Converter's Output
http://electronicdesign.com/power/simple-addition-permits-voltage-control-dc-dc-converters-output In ...
随机推荐
- 关于Docker&kubernetes的一些问题
本文是我自己在学习docker以及kubernetes的过程中遇到的一些问题,以及同事在听过培训之后一些问题,事后我自己去网上找些资料以及问一些资深大牛,我在此做一个归纳总结,将这些问题的解答做一个分 ...
- C++ 设置控制台输出颜色
#include <stdint.h> #include <iostream> #include <string> #include <Windows.h&g ...
- poj 1719Shooting Contest
//本题大意是对于一个r*c的矩阵,每一列有两个是白色的 //如今选c个位置,要求每一行至少有一个白色的方格被选上 //每一列仅仅能选一个 //用二分匹配求出最大匹配,假设最大匹配等于r,则满足 // ...
- Linux——学习环境搭建
终于决定将学习环境彻底转到Linux上来,下面记录一下转移学习环境的各种软件和环境的安装和配置. 1.centos自带python2.6,之前的博文已经说到已成功更新到python3.3,下面首先安装 ...
- PHP实现查看邮件是否被阅读
<? //当你在发送邮件时,你或许很想知道该邮件是否被对方已阅读.这里有段非常有趣的代码片段能够显示对方IP地址记录阅读//的实际日期和时间. error_reporting(0); Hea ...
- react-native 路由 react-native-router-flux
引言 react-native-router-flux 是一个基于 react-navigation 路由框架,进一步简化了页面跳转的步骤,并且一直随着 react-navigation升级更新版本. ...
- jQuery异步框架探究2:jQuery.Deferred方法
(本文针对jQuery1.6.1版本号)关于Deferred函数的描写叙述中有一个词是fledged,意为"羽翼丰满的",说明jQuery.Deferred函数应用应该更成熟. 这 ...
- 基于SpringMVC+Ext.js的权限管理系统(无权限框架)
代码地址如下:http://www.demodashi.com/demo/12811.html 0.准备工作 注意!!! 本案例数据库相关请下载例子包,内有数据库脚本.EXCEL数据表和详细的设计文档 ...
- DICOM医学图像处理:WEB PACS初谈二,图像的传输
背景: 如前一篇专栏博文所述,借助于CGI或FastCGI技术转发浏览器发送过来的用户请求,启动本地的DCMTK和CxImage库响应.然后将处理结果转换成常规图像返回到浏览器来实现Web PACS. ...
- mongoDB: cursor not found on server
查询mongoDB集合数据更新,数据有400w多.我一次用cursor(游标)取1w,处理更新.程序在某段时间运行中遍历游标时发生异常! DBCursor cursor = tabColl.find( ...