数据分箱:等频分箱,等距分箱,卡方分箱,计算WOE、IV
转载:https://zhuanlan.zhihu.com/p/38440477
转载:https://blog.csdn.net/starzhou/article/details/78930490
转载:https://www.cnblogs.com/wzdLY/p/9649101.html
1.离散的优势:
(1)离散化后的特征对异常数据有很强的鲁棒性:比如一个特征是年龄>30是1,否则0。如果特征没有离散化,一个异常数据“年龄300岁”会给模型造成很大的干扰;
(2)逻辑回归属于广义线性模型,表达能力受限,单变量离散化为N个后,每个变量有单独的权重,相当于为模型引入了非线性,能够提升模型表达能力,加大拟合;
(3)离散化后可以进行特征交叉,由M+N个变量变为M*N个变量,进一步引入非线性,提升表达能力;
(4)可以将缺失作为独立的一类带入模型;
(5)将所有变量变换到相似的尺度上。
WOE:
WOE的全称是“Weight of Evidence”,即证据权重,WOE是对原始自变量的一种编码形式。要对一个变量进行WOE编码,需要首先把这个变量进行分箱。分箱后,对于第i组,WOE的计算公式如下:

yi是这个分组中响应客户(即取值为1)的数量,yT是全部样本中所有响应客户(即取值为1)的数量
ni是这个分组中未响应客户(即取值为0)的数量,nT是全部样本中所有未响应客户(即取值为0)的数量
IV值:
IV的全称是Information Value,用来衡量自变量的预测能力
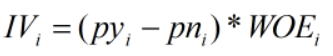
对于分组i的IV值:
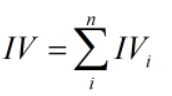
计算整个变量的IV值,n为变量分组个数:
- 过高的IV,可能有潜在的风险
- 特征分箱越细,IV越高

def compute_WOE_IV(df,col,target):

    """

    param df:DataFrame|包含feature和label

    param col:str|feature名称,col这列已经经过分箱

    param taget:str|label名称,0,1

    return 每箱的WOE(字典类型)和总的IV之和,注意考虑计算时候分子分母为零的溢出情况

    """

    import numpy as np

    total = df.groupby([col])[target].count() #计算col每个分组中的样本总数

    total = pd.DataFrame({'total': total})

    bad   = df.groupby([col])[target].sum()   #计算col每个分组中的目标取值为1的总数,关注的正样本

    bad   = pd.DataFrame({'bad': bad})

    regroup = total.merge(bad,left_index=True,right_index=True,how='left')

    regroup.reset_index(level=0,inplace=True)

    N = sum(regroup['total'])  #样本总数

    B = sum(regroup['bad'])    #正样本总数

    regroup['good'] = regroup['total'] - regroup['bad'] #计算col每个分组中的目标取值为0的总数,关注的负样本

    G = N - B #负样本总数

    regroup['bad_pcnt'] = regroup['bad'].map(lambda x: x*1.0/B)

    regroup['good_pcnt'] = regroup['good'].map(lambda x: x * 1.0 / G)

    regroup["WOE"] = regroup.apply(lambda x:np.log(x.good_pcnt*1.0/x.bad_pcnt),axis=1)

    WOE_dict = regroup[[col,"WOE"]].set_index(col).to_dict(orient="index")

    IV = regroup.apply(lambda x:(x.good_pcnt-x.bad_pcnt)*np.log(x.good_pcnt*1.0/x.bad_pcnt),axis = 1)

    IV = sum(IV)

    return {"WOE":WOE_dict,"IV":IV}
等频分箱
区间的边界值要经过选择,使得每个区间包含大致相等的实例数量。比如说 N=10 ,每个区间应该包含大约10%的实例。
等距分箱
从最小值到最大值之间,均分为 N 等份。 如果 A,B 为最小最大值, 则每个区间的长度为 W=(B−A)/N , 则区间边界值为A+W,A+2W,….A+(N−1)W 。这里只考虑边界,每个等份的实例数量可能不等。
import pandas as pd

import seaborn as sn

from sklearn.model_selection import train_test_split

df = sn.load_dataset(name="titanic")

train,test = train_test_split(df,test_size=0.2)

#####################等频分箱#################################################

train["age_bin"] = pd.qcut(train["age"],10)

group_by_age_bin = train.groupby(["age_bin"],as_index=True)

df_min_max_bin = pd.DataFrame()#用来记录每个箱体的最大最小值

df_min_max_bin["min_bin"] = group_by_age_bin.age.min()

df_min_max_bin["max_bin"] = group_by_age_bin.age.max()

df_min_max_bin.reset_index(inplace=True)

#####################等宽分箱###################################################

train["age_bin"] = pd.cut(train["age"],10)

group_by_age_bin = train.groupby(["age_bin"],as_index=True)

df_min_max_bin = pd.DataFrame()#用来记录每个箱体的最大最小值

df_min_max_bin["min_bin"] = group_by_age_bin.age.min()

df_min_max_bin["max_bin"] = group_by_age_bin.age.max()

df_min_max_bin.reset_index(inplace=True)
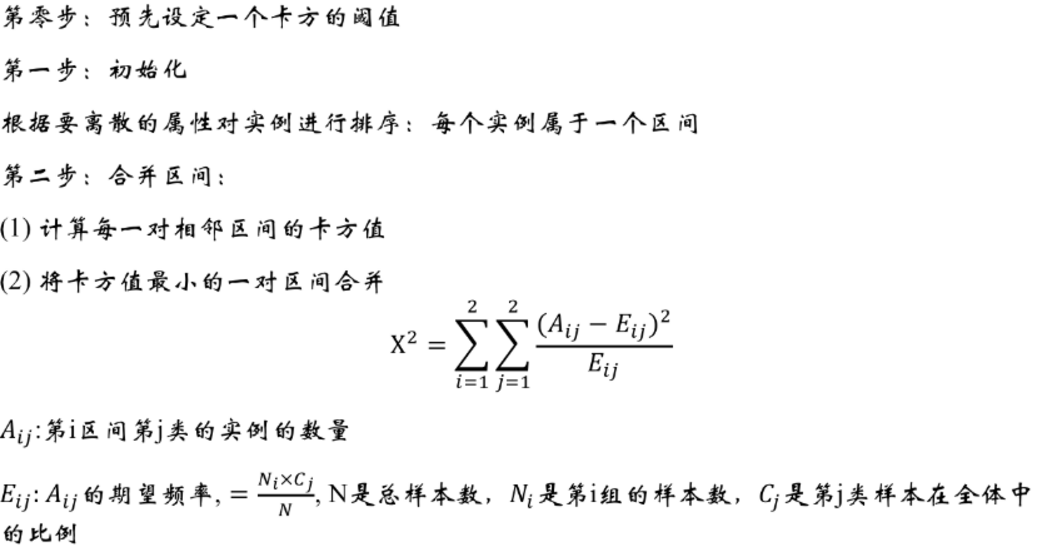
卡方分箱
转载:https://github.com/tatsumiw/ChiMerge/blob/master/ChiMerge.py
# -*- coding: utf-8 -*-

"""

Created on Sun Oct 28 21:39:24 2018

@author: WZD

"""

def ChiMerge(df,variable,flag,confidenceVal=3.841,bin=10,sample=None):

    '''

    param df:DataFrame| 必须包含标签列

    param variable:str| 需要卡方分箱的变量名称(字符串)

    param flag:str    | 正负样本标识的名称(字符串)

    param confidenceVal:float| 置信度水平(默认是不进行抽样95%)

    param bin:int            | 最多箱的数目

    param sample: int          | 为抽样的数目(默认是不进行抽样),因为如果观测值过多运行会较慢

    note: 停止条件为大于置信水平且小于bin的数目

    return :DataFrame|采样结果

    '''

    import pandas as pd

    import numpy as np

    #进行是否抽样操作

    if sample != None:

        df = df.sample(n=sample)

    else:

        df

    #进行数据格式化录入

    total_num = df.groupby([variable])[flag].count()  #统计需分箱变量每个值数目

    total_num = pd.DataFrame({'total_num': total_num})  #创建一个数据框保存之前的结果

    positive_class = df.groupby([variable])[flag].sum()  #统计需分箱变量每个值正样本数

    positive_class = pd.DataFrame({'positive_class': positive_class})  #创建一个数据框保存之前的结果

    regroup = pd.merge(total_num, positive_class, left_index=True, right_index=True,

                       how='inner')  # 组合total_num与positive_class

    regroup.reset_index(inplace=True)

    regroup['negative_class'] = regroup['total_num'] - regroup['positive_class']  #统计需分箱变量每个值负样本数

    regroup = regroup.drop('total_num', axis=1)

    np_regroup = np.array(regroup)  #把数据框转化为numpy(提高运行效率)

    #print('已完成数据读入,正在计算数据初处理')

    #处理连续没有正样本或负样本的区间,并进行区间的合并(以免卡方值计算报错)

    i = 0

    while (i <= np_regroup.shape[0] - 2):

        if ((np_regroup[i, 1] == 0 and np_regroup[i + 1, 1] == 0) or ( np_regroup[i, 2] == 0 and np_regroup[i + 1, 2] == 0)):

            np_regroup[i, 1] = np_regroup[i, 1] + np_regroup[i + 1, 1]  # 正样本

            np_regroup[i, 2] = np_regroup[i, 2] + np_regroup[i + 1, 2]  # 负样本

            np_regroup[i, 0] = np_regroup[i + 1, 0]

            np_regroup = np.delete(np_regroup, i + 1, 0)

            i = i - 1

        i = i + 1

    #对相邻两个区间进行卡方值计算

    chi_table = np.array([])  # 创建一个数组保存相邻两个区间的卡方值

    for i in np.arange(np_regroup.shape[0] - 1):

        chi = (np_regroup[i, 1] * np_regroup[i + 1, 2] - np_regroup[i, 2] * np_regroup[i + 1, 1]) ** 2 \

          * (np_regroup[i, 1] + np_regroup[i, 2] + np_regroup[i + 1, 1] + np_regroup[i + 1, 2]) / \

          ((np_regroup[i, 1] + np_regroup[i, 2]) * (np_regroup[i + 1, 1] + np_regroup[i + 1, 2]) * (

          np_regroup[i, 1] + np_regroup[i + 1, 1]) * (np_regroup[i, 2] + np_regroup[i + 1, 2]))

        chi_table = np.append(chi_table, chi)

    #print('已完成数据初处理,正在进行卡方分箱核心操作')

    #把卡方值最小的两个区间进行合并(卡方分箱核心)

    while (1):

        if (len(chi_table) <= (bin - 1) and min(chi_table) >= confidenceVal):

            break

        chi_min_index = np.argwhere(chi_table == min(chi_table))[0]  # 找出卡方值最小的位置索引

        np_regroup[chi_min_index, 1] = np_regroup[chi_min_index, 1] + np_regroup[chi_min_index + 1, 1]

        np_regroup[chi_min_index, 2] = np_regroup[chi_min_index, 2] + np_regroup[chi_min_index + 1, 2]

        np_regroup[chi_min_index, 0] = np_regroup[chi_min_index + 1, 0]

        np_regroup = np.delete(np_regroup, chi_min_index + 1, 0)

        if (chi_min_index == np_regroup.shape[0] - 1):  # 最小值试最后两个区间的时候

            # 计算合并后当前区间与前一个区间的卡方值并替换

            chi_table[chi_min_index - 1] = (np_regroup[chi_min_index - 1, 1] * np_regroup[chi_min_index, 2] - np_regroup[chi_min_index - 1, 2] * np_regroup[chi_min_index, 1]) ** 2 \

                                           * (np_regroup[chi_min_index - 1, 1] + np_regroup[chi_min_index - 1, 2] + np_regroup[chi_min_index, 1] + np_regroup[chi_min_index, 2]) / \

                                       ((np_regroup[chi_min_index - 1, 1] + np_regroup[chi_min_index - 1, 2]) * (np_regroup[chi_min_index, 1] + np_regroup[chi_min_index, 2]) * (np_regroup[chi_min_index - 1, 1] + np_regroup[chi_min_index, 1]) * (np_regroup[chi_min_index - 1, 2] + np_regroup[chi_min_index, 2]))

            # 删除替换前的卡方值

            chi_table = np.delete(chi_table, chi_min_index, axis=0)

        else:

            # 计算合并后当前区间与前一个区间的卡方值并替换

            chi_table[chi_min_index - 1] = (np_regroup[chi_min_index - 1, 1] * np_regroup[chi_min_index, 2] - np_regroup[chi_min_index - 1, 2] * np_regroup[chi_min_index, 1]) ** 2 \

                                       * (np_regroup[chi_min_index - 1, 1] + np_regroup[chi_min_index - 1, 2] + np_regroup[chi_min_index, 1] + np_regroup[chi_min_index, 2]) / \

                                       ((np_regroup[chi_min_index - 1, 1] + np_regroup[chi_min_index - 1, 2]) * (np_regroup[chi_min_index, 1] + np_regroup[chi_min_index, 2]) * (np_regroup[chi_min_index - 1, 1] + np_regroup[chi_min_index, 1]) * (np_regroup[chi_min_index - 1, 2] + np_regroup[chi_min_index, 2]))

            # 计算合并后当前区间与后一个区间的卡方值并替换

            chi_table[chi_min_index] = (np_regroup[chi_min_index, 1] * np_regroup[chi_min_index + 1, 2] - np_regroup[chi_min_index, 2] * np_regroup[chi_min_index + 1, 1]) ** 2 \

                                       * (np_regroup[chi_min_index, 1] + np_regroup[chi_min_index, 2] + np_regroup[chi_min_index + 1, 1] + np_regroup[chi_min_index + 1, 2]) / \

                                   ((np_regroup[chi_min_index, 1] + np_regroup[chi_min_index, 2]) * (np_regroup[chi_min_index + 1, 1] + np_regroup[chi_min_index + 1, 2]) * (np_regroup[chi_min_index, 1] + np_regroup[chi_min_index + 1, 1]) * (np_regroup[chi_min_index, 2] + np_regroup[chi_min_index + 1, 2]))

            # 删除替换前的卡方值

            chi_table = np.delete(chi_table, chi_min_index + 1, axis=0)

    #print('已完成卡方分箱核心操作,正在保存结果')

    #把结果保存成一个数据框

    result_data = pd.DataFrame()  # 创建一个保存结果的数据框

    result_data['variable'] = [variable] * np_regroup.shape[0]  # 结果表第一列:变量名

    list_temp = []

    for i in np.arange(np_regroup.shape[0]):

        if i == 0:

            x = '' + ',' + str(np_regroup[i, 0])

        elif i == np_regroup.shape[0] - 1:

            x = str(np_regroup[i - 1, 0]) + '+'

        else:

            x = str(np_regroup[i - 1, 0]) + ',' + str(np_regroup[i, 0])

        list_temp.append(x)

    result_data['interval'] = list_temp  #结果表第二列:区间

    result_data['flag_0'] = np_regroup[:, 2]  # 结果表第三列:负样本数目

    result_data['flag_1'] = np_regroup[:, 1]  # 结果表第四列:正样本数目

    return result_data

##############################测试#############################################

from sklearn.model_selection import train_test_split

import seaborn as sn

import pandas as pd

df = sn.load_dataset(name="titanic")

train,test = train_test_split(df,test_size=0.2)

result_data = ChiMerge(df=df,variable="age",flag="survived",confidenceVal=3.841,bin=10,sample=None)

bins = [] #卡方的区间值

bins.append(-float('inf'))

for i in range(result_data["interval"].shape[0]-1):

    St = result_data["interval"][i].split(",")

    bins.append(float(St[1]))

bins.append(float('inf'))

train["age"] = pd.cut(x=train["age"],bins=bins,labels=[1,3,5,7,9,11,13,15,17])

test["age"] = pd.cut(x=test["age"],bins=bins,labels=[1,3,5,7,9,11,13,15,17])
数据分箱:等频分箱,等距分箱,卡方分箱,计算WOE、IV的更多相关文章
- 分库分表真的适合你的系统吗?聊聊分库分表和NewSQL如何选择
曾几何时,"并发高就分库,数据大就分表"已经成了处理 MySQL 数据增长问题的圣经. 面试官喜欢问,博主喜欢写,候选人也喜欢背,似乎已经形成了一个闭环. 但你有没有思考过,分库分 ...
- vue 在有大数据量的 table 中使用弹窗 input 输入数据时卡顿解决方案
vue 在有大数据量的 table 中使用弹窗 input 输入数据时卡顿解决方案 原因:vue在进行输入时,进行了多次的render刷新渲染操作,导致了input框输入时发生的卡顿现象 解决方法:在 ...
- 西安电话面试:谈谈Vue数据双向绑定原理,看看你的回答能打几分
最近我参加了一次来自西安的电话面试(第二轮,技术面),是大厂还是小作坊我在这里按下不表,先来说说这次电面给我留下印象较深的几道面试题,这次先来谈谈Vue的数据双向绑定原理. 情景再现: 当我手机铃声响 ...
- 分表需要解决的问题 & 基于MyBatis 的轻量分表落地方案
分表:垂直拆分.水平拆分 垂直拆分:根据业务将一个表拆分为多个表. 如:将经常和不常访问的字段拆分至不同的表中.由于与业务关系密切,目前的分库分表产品均使用水平拆分方式. 水平拆分:根据分片算法将一个 ...
- pyhton中matplotlib箱线图的绘制(matplotlib双轴图、箱线图、散点图以及相关系数矩阵图))
//2019.07.23 1.箱形图,又称为盒式图,一般可以很好地反映出数据分布的特征,也可以进行多项数据之间分布特征的比较,它主要包含五个基础数据:中位数,两个上下分位数以及上下边缘线数据 其中的一 ...
- 大数据技术之_19_Spark学习_05_Spark GraphX 应用解析 + Spark GraphX 概述、解析 + 计算模式 + Pregel API + 图算法参考代码 + PageRank 实例
第1章 Spark GraphX 概述1.1 什么是 Spark GraphX1.2 弹性分布式属性图1.3 运行图计算程序第2章 Spark GraphX 解析2.1 存储模式2.1.1 图存储模式 ...
- 等距结点下的Newton插值多项式系数计算(向前差分)
插值多项式的牛顿法 1.为何需要牛顿法? 使用Lagrange插值法不具备继承性.当求好经过\(({x_0},{y_0})-({x_n},{y_n})\)共n+1个点的插值曲线时候,如果再增加一个 ...
- java例题_50 题目:有五个学生,每个学生有 3 门课的成绩,从键盘输入以上数据(包括学生号,姓名,三门课成 绩),计算出平均成绩,将原有的数据和计算出的平均分数存放在磁盘文件"stud"中。
1 /*50 [程序 50 文件 IO] 2 题目:有五个学生,每个学生有 3 门课的成绩,从键盘输入以上数据(包括学生号,姓名,三门课成 3 绩),计算出平均成绩,将原有的数据和计算出的平均分数存放 ...
- Hbase导入MapReduce数据的时候提示Running Job XXXX后就一直卡着不动
代码确信无误之后,ant运行起来,发现一执行就卡在Running Job XXXX那里一直不动了. 试着把代码打包成jar扔到Linux执行也还是一样的效果.还是停在那里.然后就一顿瞎蒙.最后发现是H ...
随机推荐
- pushpin openresty 集成试用
pushpin 是一个很不错的将restapi 转换为reailtime api 的proxy,openresty 具有很强的nginx 控制能力 可以方便的用来进行api 的开发,默认其他语言pus ...
- 对象的释放Dispose和Close对比
C#内存释放的几个方法对比: 而Close与Dispose这两种方法的区别在于,调用完了对象的Close方法后,此对象有可能被重新进行使用:而Dispose方法来说,此对象所占有的资源需要被标记为无用 ...
- Array.asList()
package study.stage2;import java.util.*; /** * Created by Sandy.Liu on 2017/7/19. */public class Asl ...
- 【转】C#获取当前日期时间(转)
我们可以通过使用DataTime这个类来获取当前的时间.通过调用类中的各种方法我们可以获取不同的时间:如:日期(2008-09-04).时间(12:12:12).日期+时间(2008-09-04 12 ...
- js过滤输入的emoji表情
因为emoji表情是Unicode编码, 在某些流浪器上会显示乱码, 有的数据库字节不够也无法存储, 网上有很多解决此类问题的办法, 最简单的莫过于将emoji表情替换成文本, 比如 [表情][表情] ...
- 访问者模式-Visitor Pattern
1.主要优点 访问者模式的主要优点如下: (1) 增加新的访问操作很方便.使用访问者模式,增加新的访问操作就意味着增加一个新的具体访问者类,实现简单,无须修改源代码,符合“开闭原则”. (2) 将有关 ...
- jmeter---将回应数据写入到文件
jmeter---将回应数据写入到文件 JMeterPlugins (插件监听器)Flexible File Writer:这个插件允许你灵活记录测试结果 Filename:结果记录的地方 Overw ...
- Maven 环境隔离实践
现在将SpringMVC中Maven环境隔离实践总结如下: 1. 在pom中配置 <resources> <resource> <directory>src/mai ...
- 【java】private关键字
private关键字(1)修饰成员:可以修饰成员变量和成员方法(2)特点:被private修饰的后的成员只能在本类中被访问 (3)private的应用:定义类的时候,当把成员变量给private修饰 ...
- Pandas的使用(2)
Pandas的使用(2) 1.新建一个空的DataFrame数据类型 total_price = pd.DataFrame() #新建一个空的DataFrame 2.向空的DataFrame中逐行添加 ...