C# SharpMap的简单使用
本文是利用ShapMap实现GIS的简单应用的小例子,以供学习分享使用。关于SharpMap的说明,网上大多是以ShapeFile为例进行简单的说明,就连官网上的例子也不多。本文是自己参考了源代码进行整理的,主要是WinForm的例子。原理方面本文也不过多论述,主要是实例演示,需要的朋友还是以SharpMap源码进行深入研究。
什么是SharpMap ?
SharpMap是一个基于.net 2.0使用C#开发的Map渲染类库,可以渲染各类GIS数据(目前支持ESRI Shape和PostGIS格式),可应用于桌面和Web程序。代码行数近10000行,可以算是一个实现了最基本功能的GIS系统,有利于研究学习使用。
涉及知识点:
- SharpMap的基本概念:Layer(图层,常用图层:VectorLayer,LabelLayer) , IProvider(数据提供者,常用数据源:Ogr(对应MapInfo),ShapFile,DataTablePoint(对应DataSet))
- 坐标转换:主要用于经纬度和地图坐标的转换。
SharpMap知识结构图:

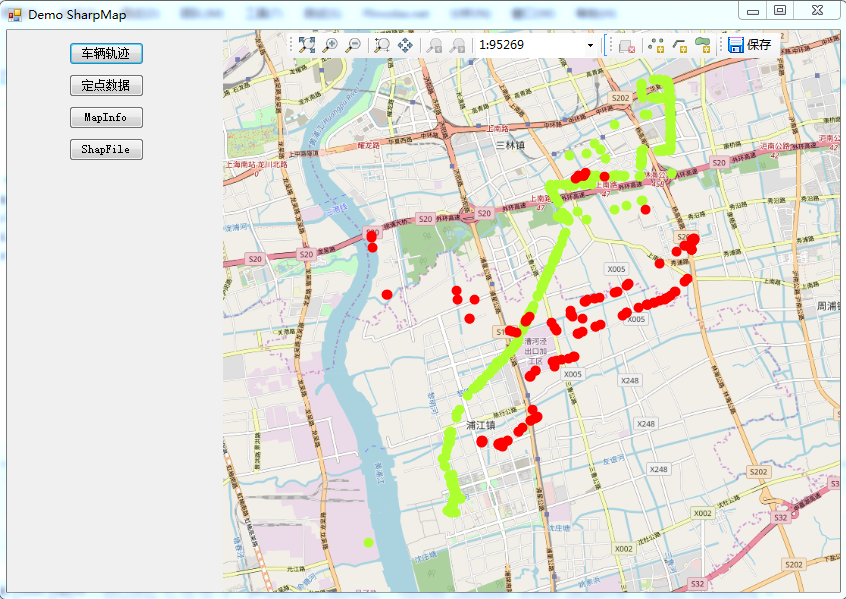
效果图如下:
(一)车辆轨迹图:数据源:Excel数据
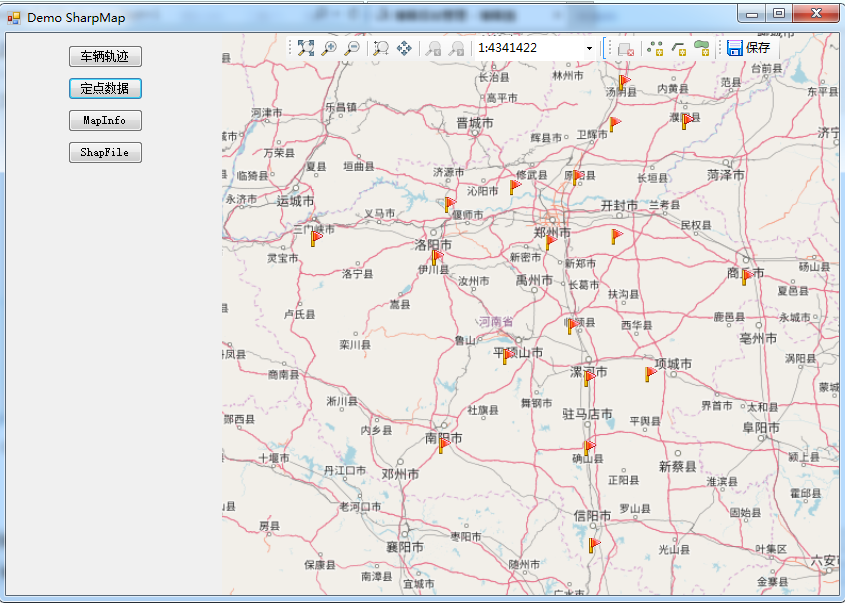
(二)定点数据(数据源:Excel)将河南省十七个城市,全部插上小红旗
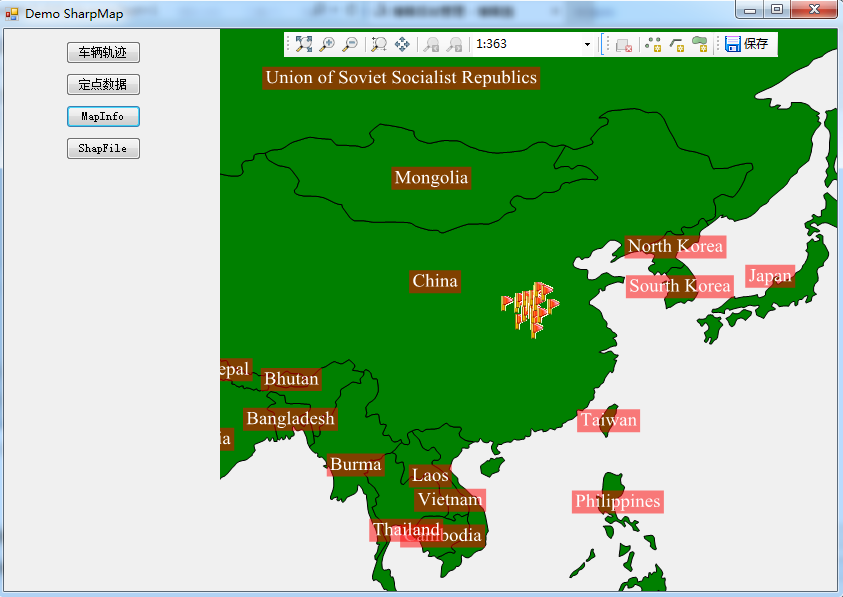
(三)使用MapInfo做背景文件(此处通过程序调整了比例尺)
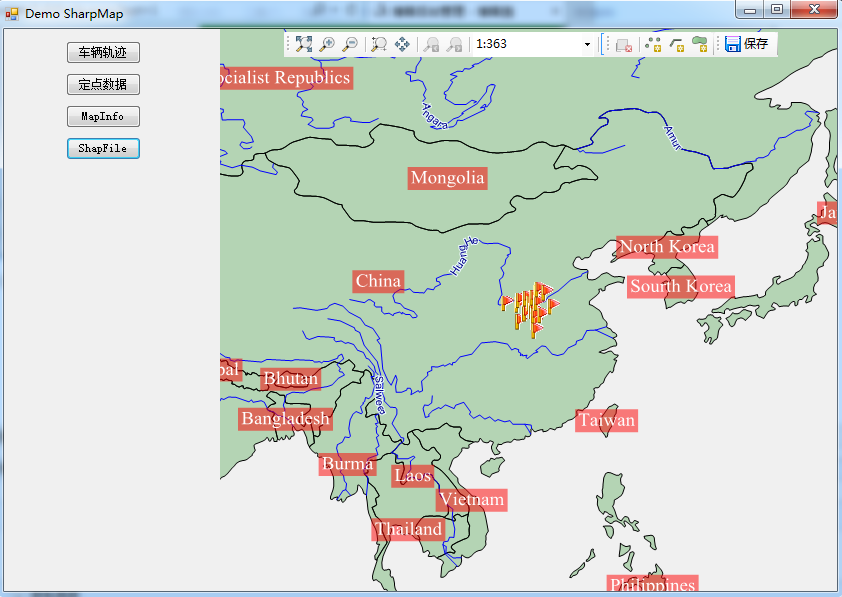
(四)使用ShapFile做背景图
核心代码
using BruTile.Predefined;
using GeoAPI.CoordinateSystems.Transformations;
using ProjNet.CoordinateSystems;
using ProjNet.CoordinateSystems.Transformations;
using SharpMap;
using SharpMap.Data.Providers;
using SharpMap.Layers;
using SharpMap.Rendering;
using SharpMap.Rendering.Thematics;
using SharpMap.Styles;
using System;
using System.Collections.Generic;
using System.Data;
using System.Data.OleDb;
using System.Drawing;
using System.Drawing.Drawing2D;
using System.Drawing.Text;
using System.Linq;
using System.Text;
using Point = GeoAPI.Geometries.Coordinate;
namespace DemoSharpMap
{
public class SharpMapHelper
{ private const string XlsConnectionString = "Provider={2};Data Source={0}\\{1};Extended Properties=\"Excel 8.0;HDR=Yes;IMEX=1\""; public static Map InitializeMap(MapType tt,float angle)
{
Map map = null;
switch (tt)
{
case MapType.RunLine:
map = InitializeMapOsmWithXls(angle);
break;
case MapType.MapInfo:
map = InitializeMapinfo(angle);
break;
case MapType.ShapeFile:
map = InitializeMapOrig(angle);
break;
case MapType.Static:
map = InitializeMapOsmWithXls2(angle);
break;
default:
map = InitializeMapOsmWithXls(angle);
break;
}
return map;
} /// <summary>
/// MapInfo格式的地图文件
/// </summary>
/// <param name="angle"></param>
/// <returns></returns>
private static Map InitializeMapinfo(float angle)
{
//Initialize a new map of size 'imagesize'
Map map = new Map(); //Set up the countries layer
VectorLayer layCountries = new VectorLayer("Countries");
//Set the datasource to a shapefile in the App_data folder
try
{
layCountries.DataSource = new Ogr("GeoData/MapInfo/countriesMapInfo.tab");
}
catch (TypeInitializationException ex)
{
if (ex.Message == "The type initializer for 'OSGeo.OGR.Ogr' threw an exception.")
{
throw new Exception(
String.Format(
"The application threw a PINVOKE exception. You probably need to copy the unmanaged dll's to your bin directory. They are a part of fwtools {0}. You can download it from: http://home.gdal.org/fwtools/",
GdalRasterLayer.FWToolsVersion));
}
throw;
} //Set fill-style to green
layCountries.Style.Fill = new SolidBrush(Color.Green);
//Set the polygons to have a black outline
layCountries.Style.Outline = Pens.Black;
layCountries.Style.EnableOutline = true;
layCountries.SRID = ; //Set up a river layer
VectorLayer layRivers = new VectorLayer("Rivers");
//Set the datasource to a shapefile in the App_data folder
layRivers.DataSource = new Ogr("GeoData/MapInfo/riversMapInfo.tab");
//Define a blue 1px wide pen
layRivers.Style.Line = new Pen(Color.Blue, );
layRivers.SRID = ; //Set up a river layer
VectorLayer layCities = new VectorLayer("Cities");
//Set the datasource to a shapefile in the App_data folder
layCities.DataSource = new Ogr("GeoData/MapInfo/citiesMapInfo.tab");
layCities.Style.SymbolScale = 0.8f;
layCities.MaxVisible = ;
layCities.SRID = ; //Set up a country label layer
LabelLayer layLabel = new LabelLayer("Country labels");
layLabel.DataSource = layCountries.DataSource;
layLabel.Enabled = true;
layLabel.LabelColumn = "Name";
layLabel.Style = new LabelStyle();
layLabel.Style.ForeColor = Color.White;
layLabel.Style.Font = new Font(FontFamily.GenericSerif, );
layLabel.Style.BackColor = new SolidBrush(Color.FromArgb(, , , ));
layLabel.MaxVisible = ;
layLabel.MinVisible = ;
layLabel.Style.HorizontalAlignment = LabelStyle.HorizontalAlignmentEnum.Center;
layLabel.SRID = ;
layLabel.MultipartGeometryBehaviour = LabelLayer.MultipartGeometryBehaviourEnum.Largest; //Set up a city label layer
LabelLayer layCityLabel = new LabelLayer("City labels");
layCityLabel.DataSource = layCities.DataSource;
layCityLabel.Enabled = true;
layCityLabel.LabelColumn = "Name";
layCityLabel.Style = new LabelStyle();
layCityLabel.Style.ForeColor = Color.Black;
layCityLabel.Style.Font = new Font(FontFamily.GenericSerif, );
layCityLabel.MaxVisible = layLabel.MinVisible;
layCityLabel.Style.HorizontalAlignment = LabelStyle.HorizontalAlignmentEnum.Left;
layCityLabel.Style.VerticalAlignment = LabelStyle.VerticalAlignmentEnum.Bottom;
layCityLabel.Style.Offset = new PointF(, );
layCityLabel.Style.Halo = new Pen(Color.Yellow, );
layCityLabel.TextRenderingHint = TextRenderingHint.AntiAlias;
layCityLabel.SmoothingMode = SmoothingMode.AntiAlias;
layCityLabel.SRID = ;
layCityLabel.LabelFilter = LabelCollisionDetection.ThoroughCollisionDetection;
layCityLabel.Style.CollisionDetection = true; //Add the layers to the map object.
//The order we add them in are the order they are drawn, so we add the rivers last to put them on top
map.Layers.Add(layCountries);
map.Layers.Add(layRivers);
map.Layers.Add(layCities);
map.Layers.Add(layLabel);
map.Layers.Add(layCityLabel);
//增加Layers
var xlsPath = string.Format(XlsConnectionString, System.IO.Directory.GetCurrentDirectory(), "GeoData\\Henan.xls", Properties.Settings.Default.OleDbProvider);
var ds = GetDataFromExcel(xlsPath, "Cities");
//var ct = GetCoordinateTransformation();
//TransCoordinate(ds, ct);
string columeName = "Rotation";
//Add Rotation Column
AddColumeToDataSet(ds, columeName, -angle); var xlsLayer = GetLayerFromDataSet2(ds, Color.GreenYellow);//Set up provider map.Layers.Add(xlsLayer); //Add layer to map
map.Center = xlsLayer.Envelope.Centre;// new Point(0, 0);
map.MapScale = ;
//map.Center = new Point(0, 0); //_ogrSampleDataset = "MapInfo"; //Matrix mat = new Matrix();
//mat.RotateAt(angle, map.WorldToImage(map.Center));
//map.MapTransform = mat; //map.ZoomToBox(xlsLayer.Envelope);
return map;
} /// <summary>
/// ShapeFile
/// </summary>
/// <param name="angle"></param>
/// <returns></returns>
private static Map InitializeMapOrig(float angle)
{
//Initialize a new map of size 'imagesize'
Map map = new Map(); //Set up the countries layer
VectorLayer layCountries = new VectorLayer("Countries");
//Set the datasource to a shapefile in the App_data folder
layCountries.DataSource = new ShapeFile("GeoData/World/countries.shp", true);
//Set fill-style to green
layCountries.Style.Fill = new SolidBrush(Color.FromArgb(, Color.Green));
//Set the polygons to have a black outline
layCountries.Style.Outline = Pens.Black;
layCountries.Style.EnableOutline = true;
layCountries.SRID = ; //Set up a river layer
VectorLayer layRivers = new VectorLayer("Rivers");
//Set the datasource to a shapefile in the App_data folder
layRivers.DataSource = new ShapeFile("GeoData/World/rivers.shp", true);
//Define a blue 1px wide pen
layRivers.Style.Line = new Pen(Color.Blue, );
layRivers.SRID = ; //Set up a cities layer
VectorLayer layCities = new VectorLayer("Cities");
//Set the datasource to a shapefile in the App_data folder
layCities.DataSource = new ShapeFile("GeoData/World/cities.shp", true);
layCities.Style.SymbolScale = 0.8f;
layCities.MaxVisible = ;
layCities.SRID = ; //Set up a country label layer
LabelLayer layLabel = new LabelLayer("Country labels");
layLabel.DataSource = layCountries.DataSource;
layLabel.Enabled = true;
layLabel.LabelColumn = "Name";
layLabel.Style = new LabelStyle();
layLabel.Style.ForeColor = Color.White;
layLabel.Style.Font = new Font(FontFamily.GenericSerif, );
layLabel.Style.BackColor = new SolidBrush(Color.FromArgb(, , , ));
layLabel.MaxVisible = ;
layLabel.MinVisible = ;
layLabel.Style.HorizontalAlignment = LabelStyle.HorizontalAlignmentEnum.Center;
layLabel.SRID = ;
layLabel.MultipartGeometryBehaviour = LabelLayer.MultipartGeometryBehaviourEnum.Largest;
layLabel.LabelFilter = LabelCollisionDetection.ThoroughCollisionDetection;
layLabel.Style.CollisionDetection = true;
layLabel.LabelPositionDelegate = fdr => fdr.Geometry.InteriorPoint.Coordinate;
layLabel.PriorityColumn = "POPDENS"; //Set up a city label layer
LabelLayer layCityLabel = new LabelLayer("City labels");
layCityLabel.DataSource = layCities.DataSource;
layCityLabel.Enabled = true;
layCityLabel.LabelColumn = "Name";
layCityLabel.Style = new LabelStyle();
layCityLabel.Style.ForeColor = Color.Black;
layCityLabel.Style.Font = new Font(FontFamily.GenericSerif, );
layCityLabel.MaxVisible = layLabel.MinVisible;
layCityLabel.Style.HorizontalAlignment = LabelStyle.HorizontalAlignmentEnum.Left;
layCityLabel.Style.VerticalAlignment = LabelStyle.VerticalAlignmentEnum.Bottom;
layCityLabel.Style.Offset = new PointF(, );
layCityLabel.Style.Halo = new Pen(Color.Yellow, );
layCityLabel.TextRenderingHint = TextRenderingHint.AntiAlias;
layCityLabel.SmoothingMode = SmoothingMode.AntiAlias;
layCityLabel.SRID = ;
layCityLabel.LabelFilter = LabelCollisionDetection.ThoroughCollisionDetection;
layCityLabel.Style.CollisionDetection = true;
layCityLabel.PriorityColumn = "POPULATION";
layCityLabel.Theme = new GradientTheme(layCityLabel.PriorityColumn, , ,
new LabelStyle
{
MaxVisible = ,
CollisionBuffer = new Size(, ),
CollisionDetection = true,
Enabled = true,
ForeColor = Color.LightSlateGray,
Halo = new Pen(Color.Silver, ),
HorizontalAlignment = LabelStyle.HorizontalAlignmentEnum.Center,
VerticalAlignment = LabelStyle.VerticalAlignmentEnum.Middle,
Font = new Font(GenericFontFamilies.SansSerif.ToString(), 8f, FontStyle.Regular)
},
new LabelStyle
{
MaxVisible = layLabel.MinVisible,
CollisionBuffer = new Size(, ),
CollisionDetection = true,
Enabled = true,
ForeColor = Color.LightSlateGray,
Halo = new Pen(Color.Silver, ),
HorizontalAlignment = LabelStyle.HorizontalAlignmentEnum.Center,
VerticalAlignment = LabelStyle.VerticalAlignmentEnum.Middle,
Font = new Font(GenericFontFamilies.SansSerif.ToString(), 16f, FontStyle.Bold)
}); bool ignoreLength = false; var layRiverLabel = new LabelLayer("River labels")
{
DataSource = layRivers.DataSource,
Enabled = true,
LabelColumn = "Name",
TextRenderingHint = TextRenderingHint.AntiAlias,
SmoothingMode = SmoothingMode.AntiAlias,
SRID = ,
LabelFilter = LabelCollisionDetection.ThoroughCollisionDetection,
MultipartGeometryBehaviour = LabelLayer.MultipartGeometryBehaviourEnum.CommonCenter,
Style =
new LabelStyle
{
ForeColor = Color.DarkBlue,
Font = new Font(FontFamily.GenericSansSerif, ),
HorizontalAlignment = LabelStyle.HorizontalAlignmentEnum.Center,
VerticalAlignment = LabelStyle.VerticalAlignmentEnum.Middle,
//CollisionDetection = true,
Halo = new Pen(Color.Azure, ),
IgnoreLength = ignoreLength,
Offset = new PointF(, -) },
}; //Add the layers to the map object.
//The order we add them in are the order they are drawn, so we add the rivers last to put them on top
//map.BackgroundLayer.Add(AsyncLayerProxyLayer.Create(layCountries));
map.Layers.Add(layCountries);
map.Layers.Add(layRivers);
map.Layers.Add(layCities);
map.Layers.Add(layLabel);
map.Layers.Add(layCityLabel);
map.Layers.Add(layRiverLabel); //增加Layers
var xlsPath = string.Format(XlsConnectionString, System.IO.Directory.GetCurrentDirectory(), "GeoData\\Henan.xls", Properties.Settings.Default.OleDbProvider);
var ds = GetDataFromExcel(xlsPath, "Cities");
//var ct = GetCoordinateTransformation();
//TransCoordinate(ds, ct);
string columeName = "Rotation";
//Add Rotation Column
AddColumeToDataSet(ds, columeName, -angle); var xlsLayer = GetLayerFromDataSet2(ds, Color.GreenYellow);//Set up provider map.Layers.Add(xlsLayer); //Add layer to map
//limit the zoom to 360 degrees width
//map.MaximumZoom = 360;
//map.BackColor = Color.LightBlue; //map.Zoom = 360;
map.Center = xlsLayer.Envelope.Centre;// new Point(0, 0);
map.MapScale = ;
//Matrix mat = new Matrix();
//mat.RotateAt(angle, map.WorldToImage(map.Center));
//map.MapTransform = mat;
//map.ZoomToBox(xlsLayer.Envelope);
return map;
} /// <summary>
/// 在线显示,圆点显示轨迹
/// </summary>
/// <param name="angle"></param>
/// <returns></returns>
private static Map InitializeMapOsmWithXls(float angle)
{
var map = new Map(); var tileLayer = new TileAsyncLayer(
KnownTileSources.Create(KnownTileSource.OpenStreetMap), "TileLayer - OSM with XLS");
tileLayer.SRID = ;
map.BackgroundLayer.Add(tileLayer); //Get data from excel
var xlsPath = string.Format(XlsConnectionString, System.IO.Directory.GetCurrentDirectory(), "GeoData\\Cities.xls", Properties.Settings.Default.OleDbProvider);
var ds = GetDataFromExcel(xlsPath, "Cities");
var ds1 = GetDataFromExcel(xlsPath, "Cities2");
var ct = GetCoordinateTransformation();
TransCoordinate(ds, ct);
TransCoordinate(ds1, ct);
string columeName = "Rotation";
//Add Rotation Column
AddColumeToDataSet(ds, columeName, -angle);
AddColumeToDataSet(ds1, columeName, -angle); var xlsLayer = GetLayerFromDataSet(ds, Color.GreenYellow);//Set up provider
map.Layers.Add(xlsLayer); //Add layer to map var xlsLayer1 = GetLayerFromDataSet(ds1, Color.Red);
map.Layers.Add(xlsLayer1); var xlsLabelLayer = GetLabelLayerByVectorLayer(xlsLayer, "XLSLabel"); xlsLabelLayer.Theme = new SharpMap.Rendering.Thematics.FontSizeTheme(xlsLabelLayer, map) { FontSizeScale = 1000f };
map.Layers.Add(xlsLabelLayer);
map.ZoomToBox(xlsLayer.Envelope.ExpandedBy(xlsLayer1.Envelope));
return map;
} /// <summary>
/// 在线显示,图标显示轨迹
/// </summary>
/// <param name="angle"></param>
/// <returns></returns>
private static Map InitializeMapOsmWithXls2(float angle)
{
var map = new Map(); var tileLayer = new TileAsyncLayer(
KnownTileSources.Create(KnownTileSource.OpenStreetMap), "TileLayer - OSM with XLS");
tileLayer.SRID = ;
map.BackgroundLayer.Add(tileLayer); //Get data from excel
var xlsPath = string.Format(XlsConnectionString, System.IO.Directory.GetCurrentDirectory(), "GeoData\\Henan.xls", Properties.Settings.Default.OleDbProvider);
var ds = GetDataFromExcel(xlsPath, "Cities");
var ct = GetCoordinateTransformation();
TransCoordinate(ds, ct);
string columeName = "Rotation";
//Add Rotation Column
AddColumeToDataSet(ds, columeName, -angle); var xlsLayer = GetLayerFromDataSet2(ds, Color.GreenYellow);//Set up provider
map.Layers.Add(xlsLayer); //Add layer to map var xlsLabelLayer = GetLabelLayerByVectorLayer(xlsLayer, "XLSLabel"); xlsLabelLayer.Theme = new FontSizeTheme(xlsLabelLayer, map) { FontSizeScale = 1000f };
map.Layers.Add(xlsLabelLayer);
map.ZoomToBox(xlsLayer.Envelope);
return map;
} /// <summary>
/// 从Excel中读取数据
/// </summary>
private static DataSet GetDataFromExcel(string xlsPath, string sheetName)
{
DataSet ds = new DataSet("XLS");
string sql = string.Format("SELECT * FROM [{0}$];", sheetName);
using (var cn = new OleDbConnection(xlsPath))
{
cn.Open();
using (var da = new OleDbDataAdapter(new OleDbCommand(sql, cn)))
{
da.Fill(ds);
}
}
return ds;
} /// <summary>
/// 获取坐标转换对象
/// </summary>
/// <returns></returns>
private static ICoordinateTransformation GetCoordinateTransformation()
{
//The SRS for this datasource is EPSG:4326, therefore we need to transfrom it to OSM projection
var ctf = new CoordinateTransformationFactory();
var cf = new CoordinateSystemFactory();
var epsg4326 = cf.CreateFromWkt("GEOGCS[\"WGS 84\",DATUM[\"WGS_1984\",SPHEROID[\"WGS 84\",6378137,298.257223563,AUTHORITY[\"EPSG\",\"7030\"]],AUTHORITY[\"EPSG\",\"6326\"]],PRIMEM[\"Greenwich\",0,AUTHORITY[\"EPSG\",\"8901\"]],UNIT[\"degree\",0.01745329251994328,AUTHORITY[\"EPSG\",\"9122\"]],AUTHORITY[\"EPSG\",\"4326\"]]");
var epsg3857 = cf.CreateFromWkt("PROJCS[\"Popular Visualisation CRS / Mercator\", GEOGCS[\"Popular Visualisation CRS\", DATUM[\"Popular Visualisation Datum\", SPHEROID[\"Popular Visualisation Sphere\", 6378137, 0, AUTHORITY[\"EPSG\",\"7059\"]], TOWGS84[0, 0, 0, 0, 0, 0, 0], AUTHORITY[\"EPSG\",\"6055\"]],PRIMEM[\"Greenwich\", 0, AUTHORITY[\"EPSG\", \"8901\"]], UNIT[\"degree\", 0.0174532925199433, AUTHORITY[\"EPSG\", \"9102\"]], AXIS[\"E\", EAST], AXIS[\"N\", NORTH], AUTHORITY[\"EPSG\",\"4055\"]], PROJECTION[\"Mercator\"], PARAMETER[\"False_Easting\", 0], PARAMETER[\"False_Northing\", 0], PARAMETER[\"Central_Meridian\", 0], PARAMETER[\"Latitude_of_origin\", 0], UNIT[\"metre\", 1, AUTHORITY[\"EPSG\", \"9001\"]], AXIS[\"East\", EAST], AXIS[\"North\", NORTH], AUTHORITY[\"EPSG\",\"3857\"]]");
var ct = ctf.CreateFromCoordinateSystems(epsg4326, epsg3857);
return ct;
} /// <summary>
/// 转换地球经纬度到坐标
/// </summary>
/// <param name="ds"></param>
/// <param name="ct"></param>
private static void TransCoordinate(DataSet ds, ICoordinateTransformation ct)
{
foreach (System.Data.DataRow row in ds.Tables[].Rows)
{
if (row["X"] == DBNull.Value || row["Y"] == DBNull.Value) continue;
var coords = new[] { Convert.ToDouble(row["X"]), Convert.ToDouble(row["Y"]) };
coords = ct.MathTransform.Transform(coords);
row["X"] = coords[];
row["Y"] = coords[];
}
} /// <summary>
/// 增加列
/// </summary>
/// <param name="ds"></param>
/// <param name="columeName"></param>
/// <param name="columeValue"></param>
private static void AddColumeToDataSet(DataSet ds, string columeName, float columeValue)
{
ds.Tables[].Columns.Add(columeName, typeof(float));
foreach (System.Data.DataRow row in ds.Tables[].Rows)
{
row["Rotation"] = -columeValue;
}
} /// <summary>
/// 轨迹用点表示
/// </summary>
/// <param name="ds"></param>
/// <param name="c"></param>
/// <returns></returns>
private static VectorLayer GetLayerFromDataSet(DataSet ds, Color c)
{
var xlsProvider = new DataTablePoint(ds.Tables[], "OID", "X", "Y");
var xlsLayer = new VectorLayer("XLS", xlsProvider)
{ Style = new VectorStyle() { PointColor = new SolidBrush(c) } };
return xlsLayer;
} /// <summary>
/// 获取带图标的图层
/// </summary>
/// <param name="ds"></param>
/// <param name="c"></param>
/// <returns></returns>
private static VectorLayer GetLayerFromDataSet2(DataSet ds, Color c)
{
var xlsProvider = new DataTablePoint(ds.Tables[], "OID", "X", "Y");
var xlsLayer = new VectorLayer("XLS", xlsProvider)
{ Style = { Symbol=Properties.Resources.redflag} };
return xlsLayer;
} private static LabelLayer GetLabelLayerByVectorLayer(VectorLayer xlsLayer, string layerName)
{
var xlsLabelLayer = new LabelLayer(layerName)
{
DataSource = xlsLayer.DataSource,
LabelColumn = "NAME",
//PriorityColumn = "Population",
Style =
{
CollisionBuffer = new System.Drawing.SizeF(2f, 2f),
CollisionDetection = true
},
LabelFilter = LabelCollisionDetection.ThoroughCollisionDetection
};
return xlsLabelLayer;
}
} public enum MapType {
ShapeFile = ,
MapInfo = ,
RunLine = ,//运行轨迹
Static = //定点数据 }
}
源码下载链接
备注:
1. 因用的MapInfo和Shape源文件为源码里面的,所有为英文显示。
C# SharpMap的简单使用的更多相关文章
- SharpMap简析
1.背景 因为项目需求,需要基于开源项目来对SHP进行相关操作.涉及到的主要功能就是加载SHP读取其中的属性信息和几何信息.于是选择了Sharpmap来进行,在使用中对其相关功能做了初步了解,做个总结 ...
- 开源地图SharpMap源码解析-(1)简介
1.简介 SharpMap最新版基于.NET Framework 4,采用C#开发的地图渲染引擎,非常易于使用.我这次研究的是比较稳定发布的V1.1版本.可以在GitHub下载该源码,地址:https ...
- SharpMap在web上的应用
最近公司用SharpMap做了一个做桌面程序,它是一个开源的Gis项目,功能还可以,最大的特点就是简单易用,这里介绍下怎么在web下使用: 这次我们根据demo先了解一下如何show一个地图.这是最基 ...
- SharpMap源代码解析
1. 简介 SharpMap是基于.net2.0的GIS系统.支持多种.NET开发语言(C# C++ 等).使用属性数据作为注记.符合OpenGIS的简单要素规范(OpenGIS Simple Fea ...
- [转]基于C#的开源GIS项目介绍之SharpMap篇
我是一个刚毕业的GIS本科毕业生,目前在杭州从事GIS软件应用开发.在项目开发中总感觉自己的编程水平还不够,于是想找些开源GIS小项目来研究研究,借以提高自己的编程能力和项目开发能力.在网上搜了一下“ ...
- 【造轮子】打造一个简单的万能Excel读写工具
大家工作或者平时是不是经常遇到要读写一些简单格式的Excel? shit!~很蛋疼,因为之前吹牛,就搞了个这东西,还算是挺实用,和大家分享下. 厌烦了每次搞简单类型的Excel读写?不怕~来,喜欢流式 ...
- Fabio 安装和简单使用
Fabio(Go 语言):https://github.com/eBay/fabio Fabio 是一个快速.现代.zero-conf 负载均衡 HTTP(S) 路由器,用于部署 Consul 管理的 ...
- node.js学习(三)简单的node程序&&模块简单使用&&commonJS规范&&深入理解模块原理
一.一个简单的node程序 1.新建一个txt文件 2.修改后缀 修改之后会弹出这个,点击"是" 3.运行test.js 源文件 使用node.js运行之后的. 如果该路径下没有该 ...
- 哪种缓存效果高?开源一个简单的缓存组件j2cache
背景 现在的web系统已经越来越多的应用缓存技术,而且缓存技术确实是能实足的增强系统性能的.我在项目中也开始接触一些缓存的需求. 开始简单的就用jvm(java托管内存)来做缓存,这样对于单个应用服务 ...
随机推荐
- Tools - 速查表与备忘单(Cheat Sheet)
Cheat Sheets Rico's cheatsheets Cheat-Sheets.org Python Python Cheat sheet Python Programming Cheat ...
- Ubuntu 18.04基础软件安装
1.fcitx 这个应该是最基础的了,虽然系统自带的也有,不过说实话可能是我还不会配置,我觉得是不好用,坚持用了一周后还是换回了小企鹅,最初是装小企鹅时失败了被迫坚持用了一周,当时失败情况是这样的,使 ...
- Mac idea激活
感谢https://blog.csdn.net/HALEN001/article/details/81137092 1.下载IntelliJ IDEA 2018.2.2版本和破解补丁Jetbrains ...
- pylot测试工具环境搭建
1.下载Pylot:www.pylot.org/ 2. 安装Python 2.5 + (必须) 3. 安装wxPython(可选 - 用于GUI模式) 4. 安装numpy的(可选 - 用于报告以图表 ...
- 关于 Kubernetes 中的 Volume 与 GlusterFS 分布式存储
容器中持久化的文件生命周期是短暂的,如果容器中程序崩溃宕机,kubelet 就会重新启动,容器中的文件将会丢失,所以对于有状态的应用容器中持久化存储是至关重要的一个环节:另外很多时候一个 Pod 中可 ...
- @property、@sythesize以及Ivar和@dynamic讲解(下)
下面仅仅是一些基本知识,可能有些知识用的比较少,不过知道怎么使用或者了解这个知识,还是不错的,毕竟技多不压身嘛!读完这篇文章大约需要5-10分钟左右!!! 一.@property 1.在头文件中: @ ...
- 数据分析面试题之Pandas中的groupby
昨天晚上,笔者有幸参加了一场面试,有一个环节就是现场编程!题目如下: 示例数据如下,求每名学生(ID)对应的成绩(score)最高的那门科目(class)与ID,用Python实现: 这个题目 ...
- OpenCV入门之获取验证码的单个字符(字符切割)
介绍 在我们日常上网注册账号以及制作网络爬虫时,经常会遇到奇奇怪怪的验证码,有些容易,有些连人眼都无法辨识.于是,大牛们想到了用深度学习的方法来破解验证码,对于一般的验证码往往能出奇制胜,取得不俗 ...
- 第一册:lesson fifty five。
原文: The Sawyer family. The Sawyers live at 87 King street. In the morning Mr.Sawyer goes to work and ...
- 模拟获取post数据的方式
使用下面两种方法可以获取post数据 .通过$HTTP_RAW_POST_DATA获取 $post=$GLOBALS['HTTP_RAW_POST_DATA']; 但需要修改相应的php.ini指令 ...