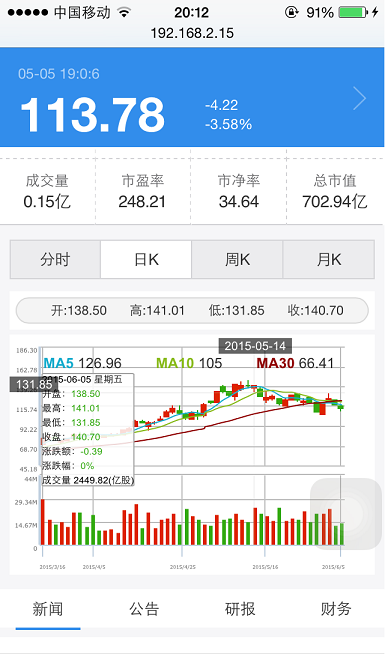
股票k线
与上一篇文章相比k线图主要的难点
1.tooltip的定制化显示:
当手指触摸手机屏幕上下拖动可能会手指的事件陷入图表无法进行上下拖动
tooltip:{followMouseMove}
followMouseMove为true的话手指左右移动框中数据会发生改变但是无法上下移动,false的话图表框可以上下移动但数据无法改变。
所以需要定制化tooltip,当手指上下移动的时候事件不会被捕获,左右移动的时候tooltip中的数据可以跟随变化。
 var tooltipChart = {//

         chartVar: null,//highcharts() 对象传入  在load时传入

         SVGElements: {},

         tooltipWidth:null,

         buildTooltip: function(text, coord,isLeft) {

             // we've to check if exists and remove it

             try {

                 this.SVGElements.destroy();

             } catch(e) {

                 // nothing

             }

             try {

                 // first of all we've to build a group to put the elements

                 this.SVGElements = this.chartVar.renderer.g().attr({'zIndex': 11}).add();

                 //将tooltip放在左边  coord[0] 左坐标位置正确的,coord[1]传入的是图表高度

                 // build tooltip text

                 var textContainer = this.chartVar.renderer.text(text, coord[0],coord[1])

                     .attr({

                         'zIndex': 10

                     })

                     .add(this.SVGElements);

                 // get text 'box'

                 var box = textContainer.getBBox();

                 tooltipChart.tooltipWidth=box.width;

                 // build  tooltip square according to the text location, then place the container behind the text

                 this.chartVar.renderer.rect(box.x , box.y, box.width , box.height , 1)

                     .attr({

                         'stroke-width': 1,            // border width

                         'stroke': '#a8a8a8',        // border color

                         'zIndex': 9,

                         'fill': 'white',            // background color

                         'fill-opacity': 0.85,        // background opacity

                         'isShadow': false

                     })

                     .add(this.SVGElements);

             } catch(e) {

                 return false;

             }

         }

     }
2.蜡烛的形状以及源码改写
  //修改colum条的颜色(重写了源码方法)

      var originalDrawPoints = Highcharts.seriesTypes.column.prototype.drawPoints;

         Highcharts.seriesTypes.column.prototype.drawPoints = function () {

             var merge  = Highcharts.merge,

                 series = this,

                 chart  = this.chart,

                 points = series.points,

                 i      = points.length;

             var seriesPointAttr ;

             while (i--) {

                 var candlePoint = chart.series[0].points[i];

                 if(candlePoint.open != undefined && candlePoint.close !=  undefined){  //如果是K线图 改变矩形条颜色,否则不变

                     var color = (candlePoint.open < candlePoint.close) ? '#DD2200' : '#33AA11';

                     seriesPointAttr = merge(series.pointAttr);

                     seriesPointAttr[''].fill = color;

                     seriesPointAttr.hover.fill = Highcharts.Color(color).brighten(0.3).get();

                     seriesPointAttr.select.fill = color;

                 }else{

                      seriesPointAttr = merge(series.pointAttr);

                 }

                 points[i].pointAttr = seriesPointAttr;

             }

             originalDrawPoints.call(this);

         };
3.MA5、 MA10、MA30的显示
可以借助addPlotBand在x轴上label中写入数据
代码:
以下html来触发样式点击
     <ul class="clearfix">

                 <li class="hover">

                     <a href="javascript:void(0);" onclick="clickTrend(this)">分时</a>

                 </li>

                 <li>

                     <a href="javascript:void(0);" onclick="clickDayKLine(this)">日K</a>

                 </li>

                 <li>

                     <a href="javascript:void(0);" onclick="clickWeekKLine(this)">周K</a>

                 </li>

                 <li>

                     <a href="javascript:void(0);" onclick="clickMonthKLine(this)">月K</a>

                 </li>

             </ul>
引入jquery.js highstock.js
html
 <div id="report" class="klineMap-report"></div>

 <div class="kline_map" id="line_map" style="height: 200px;width: 100%" >
kline_chart.js
//open.hundsun.com:8081/quote/v1/kline?get_type=range&prod_code=600570.SS&candle_period=6&fields=open_px,high_px,low_px,close_px,business_amount&data_count=5
var KLINE_URL=js_lib.getkLineUrl();
var DIVID="#line_map";
//接收个股代码
var STOCK_CODE = js_lib.getQueryStringByName("stock_code");
var STOCKCODE="600570.SS";
if(STOCK_CODE==""){
STOCK_CODE="600570.SS";
}
//日K
function clickDayKLine(obj){
var kline_params = "get_type=range&prod_code="+STOCK_CODE+"&candle_period=6&fields=open_px,high_px,low_px,close_px,business_amount";
js_lib.ajax(KLINE_URL, clickKLine_Show, 'get',kline_params,failCallback); $(obj).parent().parent().children().each(function(){
$(this).removeClass("hover");
});
$(obj).parent().addClass("hover");
} //周K
function clickWeekKLine(obj){
var kline_params = "get_type=range&prod_code="+STOCK_CODE+"&candle_period=7&fields=open_px,high_px,low_px,close_px,business_amount";
js_lib.ajax(KLINE_URL, clickKLine_Show, 'get',kline_params,failCallback);
$(obj).parent().parent().children().each(function(){
$(this).removeClass("hover");
});
$(obj).parent().addClass("hover");
}
//月k
function clickMonthKLine(obj){
var kline_params = "get_type=range&prod_code="+STOCK_CODE+"&candle_period=8&fields=open_px,high_px,low_px,close_px,business_amount";
js_lib.ajax(KLINE_URL, clickKLine_Show, 'get',kline_params,failCallback);
$(obj).parent().parent().children().each(function(){
$(this).removeClass("hover");
});
$(obj).parent().addClass("hover"); }
//年K
function clickYearKLine(obj){
var kline_params = "get_type=range&prod_code="+STOCK_CODE+"&candle_period=9&fields=open_px,high_px,low_px,close_px,business_amount&data_count=5";
js_lib.ajax(KLINE_URL, clickKLine_Show, 'get',kline_params,failCallback);
$(obj).parent().parent().children().each(function(){
$(this).removeClass("hover");
});
$(obj).parent().addClass("hover");
} function clickKLine_Show(val){
var jsonText = JSON.parse(val);
if(typeof(jsonText.error_info)!='undefined'){
failCallback();
return ;
}
data=jsonText.data.candle;
data=data[STOCK_CODE];
createKlineChart(DIVID,data);
}
//定制化 tooltip
var tooltipChart = {//
chartVar: null,//highcharts() 对象传入 在load时传入
SVGElements: {},
tooltipWidth:null,
buildTooltip: function(text, coord,isLeft) {
// we've to check if exists and remove it
try {
this.SVGElements.destroy();
} catch(e) {
// nothing
}
try {
// first of all we've to build a group to put the elements
this.SVGElements = this.chartVar.renderer.g().attr({'zIndex': 11}).add();
//将tooltip放在左边 coord[0] 左坐标位置正确的,coord[1]传入的是图表高度
// build tooltip text
var textContainer = this.chartVar.renderer.text(text, coord[0],coord[1])
.attr({
'zIndex': 10
})
.add(this.SVGElements);
// get text 'box'
var box = textContainer.getBBox();
tooltipChart.tooltipWidth=box.width;
// build tooltip square according to the text location, then place the container behind the text
this.chartVar.renderer.rect(box.x , box.y, box.width , box.height , 1)
.attr({
'stroke-width': 1, // border width
'stroke': '#a8a8a8', // border color
'zIndex': 9,
'fill': 'white', // background color
'fill-opacity': 0.85, // background opacity
'isShadow': false
})
.add(this.SVGElements);
} catch(e) {
return false;
}
}
}
//放数据个数控制
var count=0;
//highstock K线图
var createKlineChart = function (divID,data,crrentData){
var $reporting = $("#report");
$reporting.html("");
var firstTouch = true;
//开盘价^最高价^最低价^收盘价^成交量^成交额^涨跌幅^换手率^五日均线^十日均线^30日均线^昨日收盘价
var open,high,low,close,y,zde,zdf,MA5=0,MA10=0,MA30=0,zs=0;
//定义数组
var ohlcArray = [],volumeArray = [],MA5Array = [],MA10Array=[],MA30Array=[];
//容错处理
if(data==undefined&&data==null&&data.length==0){
failCallback();
return;
}
//修改colum条的颜色(重写了源码方法)
var originalDrawPoints = Highcharts.seriesTypes.column.prototype.drawPoints;
Highcharts.seriesTypes.column.prototype.drawPoints = function () {
var merge = Highcharts.merge,
series = this,
chart = this.chart,
points = series.points,
i = points.length;
var seriesPointAttr ;
while (i--) {
var candlePoint = chart.series[0].points[i];
if(candlePoint.open != undefined && candlePoint.close != undefined){ //如果是K线图 改变矩形条颜色,否则不变
var color = (candlePoint.open < candlePoint.close) ? '#DD2200' : '#33AA11';
seriesPointAttr = merge(series.pointAttr);
seriesPointAttr[''].fill = color;
seriesPointAttr.hover.fill = Highcharts.Color(color).brighten(0.3).get();
seriesPointAttr.select.fill = color;
}else{
seriesPointAttr = merge(series.pointAttr);
}
points[i].pointAttr = seriesPointAttr;
}
originalDrawPoints.call(this);
};
//常量本地化
Highcharts.setOptions({
global : {
useUTC : true
},
lang: {
rangeSelectorFrom:"日期:",
rangeSelectorTo:"至",
rangeSelectorZoom:"间隔",
loading:'加载中...',
shortMonths:['1月','2月','3月','4月','5月','6月','7月','8月','9月','10月','11月','12月'],
weekdays:['星期日', '星期一', '星期二', '星期三', '星期四', '星期五', '星期六'],
}});
//格式化数据,准备绘图 ,把当前最新K线数据加载进来,count至多50个数据
count = data.length<50?data.length:50;
//限制数据输入个数
var i;
for (i = data.length-count; i <data.length; i++) {
//日期的原始格式 20141205,转换成highstock的日期格式
var dateUTC = getDateUTC(data[i][0]);//得出的UTC时间
ohlcArray.push([
parseInt(dateUTC), // the date
parseFloat(data[i][1]), // open
parseFloat(data[i][2]), // high
parseFloat(data[i][3]), // low
parseFloat(data[i][4]) // close
]);
if(i>=4){
var ma5=0.00;
for( var j=0;j<5;j++){
ma5+=parseFloat(data[i-j][4]);
}
MA5Array.push([
parseInt(dateUTC), // the date
parseFloat(ma5/5)
]);
}
if(i>=9){
var ma10=0.00;
for( var j=0;j<10;j++){
ma10+=parseFloat(data[i-j][4]);
}
MA10Array.push([
parseInt(dateUTC),
parseFloat(ma10/10),
]);
}
if(i>=29){
var ma30=0.00;
for( var j=0;j<30;j++){
ma30+=parseFloat(data[i-j][4]);
}
MA30Array.push([
parseInt(dateUTC),
parseFloat(ma30/30)
]);
}
volumeArray.push([
parseInt(dateUTC), // the date
parseInt(data[i][5]) // 成交量
]); }
var swipeX=false,//左右移动标志
swipeY=false;//上下移动标志
//触屏触摸
createKlineChart.kline_touchstart=function(event){
var touch = event.touches[0];
startX=touch.pageX;
startY=touch.pageY;
swipeX=swipeY=false;
document.getElementById("line_map").addEventListener("touchmove", createKlineChart.kline_touchmove);
}
//触屏手指移动
createKlineChart.kline_touchmove=function(event){
var touch = event.touches[0];
var currenX=touch.pageX;
var currentY=touch.pageY;
var chart = $(DIVID).highcharts(); if(true==swipeX){//先左右就一直左右 上下也不影响
swipeY=false;
}
else if(true==swipeY){//向上下移动的标志
swipeX=false;
}else{
if(Math.abs(currentY-startY)>Math.abs(currenX-startX)){//判断上下移动
swipeY=true;
}
else{
swipeX=true;
}
}
if(true==swipeY){//上下移动 x 先重画线 然后删除事件
document.getElementById("line_map").removeEventListener("touchmove", createKlineChart.kline_touchmove,false);
}else if(true==swipeX){
event.preventDefault();
}
//不管 上下 还是 左右 都需要先画标示线
//画图区左边距离
var left=chart.yAxis[0].left+(chart.yAxis[0].axisLine.strokeWidth==undefined?0:chart.yAxis[0].axisLine.strokeWidth);
var y ;
var x = touch.pageX-left-10;
//x点 =x/chart宽度 * 总体点的个数
x=(x/chart.plotWidth)*ohlcArray.length;
var i=0;
i=Number(Math.ceil(x));
if(i>=ohlcArray.length||i<0){
return;}
//计算图表x轴
x=ohlcArray[i][0];//utc格式时间数据
y=ohlcArray[i][3];
chart = $(DIVID).highcharts(); // Highcharts构造函数
chart.xAxis[0].removePlotBand("plotBand-x");
chart.xAxis[0].addPlotBand({
borderColor:'#BEBEBE',
borderWidth:0.1,
color: '#BEBEBE',
from: x-0.0001,//,Date.UTC(2015, 3, 27,10,50),
to: x+0.0001,//Date.UTC(2015, 3, 27,10,51),
label: {
useHTML:true,
text: '<span class="value" style="font-size:10px;background-color:rgba(0,0,0,.6); color:#fff; height:15px; line-height:15px; padding:0 5px;">'+Highcharts.dateFormat('%Y-%m-%d ', x)+'</span>',
textAlign: 'bottom',
x:-30,
y:5
},
id:'plotBand-x',
zIndex:1001
});
chart.yAxis[0].removePlotBand("plotBand-y0");
chart.yAxis[0].addPlotBand({
borderColor:'#BEBEBE',
borderWidth:0.1,
color: '#BEBEBE',
from: y-0.0001,//,Date.UTC(2015, 3, 27,10,50),
to: y+0.0001,//Date.UTC(2015, 3, 27,10,51),
label: {
useHTML:true,
text: '<span class="value" style="font-size:10px;background-color:rgba(0,0,0,.6); color:#fff; height:15px; line-height:15px; padding:0 5px;">'+y.toFixed(2)+'</span>',
verticalAlign:'left',
textAlign: 'left',
x:-25,
y:-2
},
id:'plotBand-y0',
zIndex:1001
});
var open=0,high=0,low=0,close=0,MA5=0,MA10=0,MA30=0;
if(ohlcArray.length>0){
open=Number(ohlcArray[i][1].toFixed(2));
high=Number(ohlcArray[i][2].toFixed(2));
low=Number(ohlcArray[i][3].toFixed(2));
close=Number(ohlcArray[i][4].toFixed(2));
if(i>=4){
MA5=Number(MA5Array[i-4][1].toFixed(2));
}
if(i>=9){
MA10=Number(MA10Array[i-9][1].toFixed(2));
}
if(i>=29){
MA30=Number(MA30Array[i-29][1].toFixed(2));
}
}
$reporting.html(
'<div class="detail">'+
'<ul>'+
'<li class="value-4">'+
' <span>开:</span>'+ open.toFixed(2)
+'</li>'
+'<li>'
+' <span>高:</span>'+ high.toFixed(2)
+'</li>'
+'<li>'
+' <span>低:</span>'+ low.toFixed(2)
+'</li>'
+'<li>'
+'<span>收:</span>'+close.toFixed(2)
+'</li>'
+'</ul>'
+'</div>'
);
chart.xAxis[0].removePlotBand("plotBand-whole-x");
chart.xAxis[0].addPlotBand({
borderColor:'transparent',
borderWidth:1,
color: 'transparent',
from: ohlcArray[0][0]-0.00001,//,Date.UTC(2015, 3, 27,10,50),
to: ohlcArray[0][0]+0.000001,//Date.UTC(2015, 3, 27,10,51),
label: {
useHTML:true,
text:'<p>'
+ ' <b style="color:#1aadce;padding-left:25px">MA5</b> '+ MA5
+' <b style="color: #8bbc21;padding-left:25px">MA10 </b> '+ MA10
+' <b style="color:#910000;padding-left:25px">MA30</b> '+ MA30
+'</p>' ,
textAlign: 'top',
y:20,
x:-25
},
id:'plotBand-whole-x',
zIndex:1001
}); //左右移动,显示tooltip关联tooltipChart对象
var coord=null ;
//手指在图表中间的右侧
if(i>ohlcArray.length/2){
coord = [left,chart.yAxis[0].top+30];
}else{
coord=[chart.chartWidth-left-tooltipChart.tooltipWidth,chart.yAxis[0].top+30];
}
var text = getTooltipHTML(ohlcArray,volumeArray,i);
tooltipChart.buildTooltip(text, coord);
}
document.getElementById("line_map").removeEventListener("touchstart",createTrendChart.trend_touchstart,false);
document.getElementById("line_map").addEventListener("touchstart",createKlineChart.kline_touchstart);
document.getElementById("line_map").removeEventListener("touchmove",createTrendChart.trend_touchmove,false);
//开始绘图
$(DIVID).highcharts('StockChart', {
chart:{
renderTo : DIVID,
//关闭平移
panning:false,
zoomType: 'none',
pinchType:'none',
//修改左右位置
margin: [10, 25,25, 25],
spacing: [0,0,0,0],
plotBorderColor: '#3C94C4',
plotBorderWidth: 0,
zoomType:false,
events:{
load:function(){
x=ohlcArray[ohlcArray.length-1][0];
y=ohlcArray[ohlcArray.length-1][3];
var chart = $(DIVID).highcharts(); // Highcharts构造函数
//时间线
chart.xAxis[0].removePlotBand("plotBand-x");
chart.xAxis[0].addPlotBand({
borderColor:'#BEBEBE',
borderWidth:0.1,
color: '#BEBEBE',
from: x-0.0001,//,Date.UTC(2015, 3, 27,10,50),
to: x+0.0001,//Date.UTC(2015, 3, 27,10,51),
label: {
useHTML:true,
text: '<span class="value" style="font-size:10px;background-color:rgba(0,0,0,.6); color:#fff; height:15px; line-height:15px; padding:0 5px;">'+Highcharts.dateFormat('%Y-%m-%d ', x)+'</span>',
textAlign: 'bottom',
y:5,
x:-30
},
id:'plotBand-x',
zIndex:1001
});
chart.yAxis[0].removePlotBand("plotBand-y0");
chart.yAxis[0].addPlotBand({
borderColor:'#BEBEBE',
borderWidth:0.1,
color: '#BEBEBE',
from: y-0.0001,//,Date.UTC(2015, 3, 27,10,50),
to: y+0.0001,//Date.UTC(2015, 3, 27,10,51),
label: {
useHTML:true,
text: '<span class="value" style="font-size:10px;background-color:rgba(0,0,0,.6); color:#fff; height:15px; line-height:15px; padding:0 5px;">'+y.toFixed(2)+'</span>',
verticalAlign:'left',
textAlign: 'left',
x:-25,
y:-2
},
id:'plotBand-y0',
zIndex:1001
});
var open=0,high=0,low=0,close=0,MA5=0,MA10=0,MA30=0;
if(ohlcArray.length>0){
open=Number(ohlcArray[ohlcArray.length-1][1].toFixed(2));
high=Number(ohlcArray[ohlcArray.length-1][2].toFixed(2));
low=Number(ohlcArray[ohlcArray.length-1][3].toFixed(2));
close=Number(ohlcArray[ohlcArray.length-1][4].toFixed(2));
if(ohlcArray.length>=5-1){
MA5=Number(MA5Array[MA5Array.length-1][1].toFixed(2));
}
if(ohlcArray.length>=10-1){
MA10=Number(MA10Array[MA10Array.length-1][1].toFixed(2));
}
if(ohlcArray.length>=30-1){
MA30=Number(MA30Array[MA30Array.length-1][1].toFixed(2));
}
}
$reporting.html(
'<div class="detail">'+
'<ul>'+
'<li class="value-4">'+
' <span>开:</span>'+ open.toFixed(2)
+'</li>'
+'<li>'
+' <span>高:</span>'+ high.toFixed(2)
+'</li>'
+'<li>'
+' <span>低:</span>'+ low.toFixed(2)
+'</li>'
+'<li>'
+'<span>收:</span>'+close.toFixed(2)
+'</li>'
+'</ul>'
+'</div>'
);
chart.xAxis[0].removePlotBand("plotBand-whole-x");
chart.xAxis[0].addPlotBand({
borderColor:'transparent',
borderWidth:1,
color: 'transparent',
from: ohlcArray[0][0]-0.000001,//,Date.UTC(2015, 3, 27,10,50),
to: ohlcArray[0][0]+0.000001,//Date.UTC(2015, 3, 27,10,51),
label: {
useHTML:true,
text:'<p>'
+ ' <b style="color:#1aadce;padding-left:25px">MA5</b> '+ MA5
+' <b style="color: #8bbc21;padding-left:25px">MA10 </b> '+ MA10
+' <b style="color:#910000;padding-left:25px">MA30</b> '+ MA30
+'</p>' ,
textAlign: 'top',
y:20,
x:-25
},
id:'plotBand-whole-x',
zIndex:1001
});
//显示tooltip
var chart = $(DIVID).highcharts();
var left=chart.yAxis[0].left+(chart.yAxis[0].axisLine.strokeWidth==undefined?0:chart.yAxis[0].axisLine.strokeWidth); //关联tooltipChart对象
tooltipChart.chartVar=chart;
var coord = [left,chart.yAxis[0].top+30];
var text = getTooltipHTML(ohlcArray,volumeArray,ohlcArray.length-1);
$textDiv=$(text);
tooltipChart.buildTooltip(text, coord);
}
} }, loading: {
labelStyle: {
position: 'relative',
top: '10em',
zindex:1000
}
},
credits:{
enabled:false
},
rangeSelector: {
enabled:false
},
plotOptions: {
//修改蜡烛颜色
candlestick: {
color: '#33AA11',
upColor: '#DD2200',
lineColor: '#33AA11',
upLineColor: '#DD2200',
maker:{
enabled:false,
states:{
hover:{
enabled:false,
}
}
},
// cursor: 'pointer',
dataLabels: {
enabled: false, // y:-100
}
},
//去掉曲线和蜡烛上的hover事件
series: {
states: {
hover: {
enabled: false
}
},
line: {
marker: {
enabled: false
}
},
},
column:{
//启用动画
animation:true,
states: {
hover: {
enabled: false
}
},
},
spline:{
allowPointSelect:false,
states: {
hover: {
enabled: false
}
},
}, },
//格式化悬浮框
tooltip: {
enabled:false,
crosshairs:false,
},
title: {
enabled:false
},
exporting: {
enabled: false //设置导出按钮不可用
},
scrollbar: {
enabled:false
},
navigator: {
enabled:false,
},
xAxis:{
showFirstLabel: true,
showLastLabel:true,
labels: {
overflow: 'justify',
style: { //字体样式
font: 'normal 4px Verdana, sans-serif'
},
formatter: function() {
var vDate=new Date(this.value);
return vDate.getFullYear()+"/"+(vDate.getMonth()+1)+"/"+vDate.getDate();
},
align: 'center'
} , gridLineWidth: 1,
// X轴的步进值,决定隔多少个显示一个
tickPositioner:function(){
var positions = [],
tick = Number((this.dataMin)),
increment = Number(((this.dataMax - this.dataMin) / 4));
for (tick; tick - increment <= this.dataMax; tick += increment) {
positions.push(Number(tick.toFixed(2)));
if(increment==0){
break;
}
}
return positions;
},
},
yAxis: [{
title: {
text: ''
},
labels: {
overflow: 'justify',
style: { //字体样式
font: 'normal 5px Verdana, sans-serif'
},
align: 'right',
x:-2,
y:5,
formatter: function() {
return this.value.toFixed(2);
},
},
//tickInterval: 10,
showFirstLabel: true,
showLastLabel:true,
height: '60%',
lineWidth:2,//Y轴边缘线条粗细
opposite:false,
tickPositioner:function(){
var positions = [],
tickMin=Number(this.dataMin),
tickMax=Number(this.dataMax),
tick ,
increment = Number(((tickMax-tickMin) / 5).toFixed(2));
tickMin=tickMin-increment;
tickMax=tickMax+increment;
increment= Number(((tickMax-tickMin) / 5).toFixed(2));
tick=tickMin;
if(tick<0){
tick=0;
tickMin=0;
tickMax=tickMax+(-tick);
increment=tickMax/5;
}
var j=0;
for (tick;j++<=6 &&increment!=0; tick =Number(tick+ increment)) {
positions.push(Number(tick.toFixed(2)));
}
return positions;
},
},{
title: {
text:''
},
showFirstLabel: true,
showLastLabel:true,
labels: {
style: { //字体样式
font: 'normal 5px Verdana, sans-serif'
},
align: 'right',
x: -2,
y:5,
formatter:function(){
if(this.value>1000000000){
return Number((this.value/1000000000).toFixed(2))+"G";
}else if(this.value>1000000){
return Number((this.value/1000000).toFixed(2))+"M";
}else if(this.value>1000){
return Number((this.value/1000).toFixed(2))+"K";
}else{
return Number(this.value.toFixed(2));
}
}
},
top: '65%',
height: '35%',
offset:0,
lineWidth: 2,
opposite:false,
tickPositioner:function(){
var positions = [],
tick = Number((this.dataMin)),
increment = Number(((this.dataMax - this.dataMin) / 2));
for (tick; tick - increment <= this.dataMax; tick += increment) {
positions.push(Number(tick.toFixed(2)));
if(0==increment){break;}
}
return positions;
}
}],
series: [
{
type: 'candlestick',
id:"candlestick",
name: STOCK_CODE,
data: ohlcArray,
tooltip : {
valueDecimals : 2
},
dataGrouping: {
enabled: false,
forced: true
}
}
,{
type: 'column',//
name: '成交量',
data: volumeArray,
yAxis: 1,
dataGrouping: {
enabled: false,
forced: true
}
} ,{
type: 'spline',
name: 'MA5',
color:'#1aadce',
data: MA5Array,
lineWidth:1,
dataGrouping: {
enabled: false,
forced: true
}
},{
type: 'spline',
name: 'MA10',
data: MA10Array,
color:'#8bbc21',
threshold: null,
lineWidth:1,
dataGrouping: {
enabled: false,
forced: true
}
},{
type: 'spline',
name: 'MA30',
data: MA30Array,
color:'#910000',
threshold: null,
lineWidth:1,
dataGrouping: {
enabled: false,
forced: true
}
}
]
});
Highcharts.seriesTypes.column.prototype.drawPoints = originalDrawPoints ;
}
//ohlcArray和volumeArray中的第i个数据
function getTooltipHTML(ohlcArray,volumeArray,i){
//涨跌幅=(今收最新价-昨收)/昨收
var time=ohlcArray[i][0];
var zde=0,zdf=0,zs=0;
if(i!=0){
zde = parseFloat(ohlcArray[i][4]-ohlcArray[i-1][4]).toFixed(2);
zdf = parseFloat((zde/(ohlcArray[i][4])).toFixed(2));
zs=parseFloat(ohlcArray[i-1][4]); //昨天收盘价
}
var open = ohlcArray[i][1].toFixed(2),
high = ohlcArray[i][2].toFixed(2),
low = ohlcArray[i][3].toFixed(2),
close = ohlcArray[i][4].toFixed(2),
y = volumeArray[i][1]; //成交量
var tip= '<div><span style="font-size:8px;">'+ Highcharts.dateFormat('%Y-%m-%d %A', this.x) +'</span><br/>';
if(open>zs){
tip += '<span style="font-size:8px;">开盘:</span><span style="font-size:8px;color: #DD2200;align:right;">'+open+' </span><br/>';
}else{
tip += '<span style="font-size:8px;">开盘:</span><span style="font-size:8px;color: #33AA11;align:right;">'+open+' </span><br/>';
}
if(high>zs){
tip += '<span style="font-size:8px;">最高:</span></span><span style="font-size:8px;color: #DD2200;align:right;">'+high+' </span><br/>';
}else{
tip += '<span style="font-size:8px;">最高:</span></span><span style="font-size:8px;color: #33AA11;align:right;">'+high+' </span><br/>';
}
if(low>zs){
tip += '<span style="font-size:8px;">最低:</span><span style="font-size:8px;color: #DD2200;align:right;">'+low+' </span><br/>';
}else{
tip += '<span style="font-size:8px;">最低:</span><span style="font-size:8px;color: #33AA11;align:right;">'+low+' </span><br/>';
}
if(close>zs){
tip += '<span style="font-size:8px;">收盘:</span><span style="font-size:8px;color: #DD2200;align:right;">'+close+' </span><br/>';
}else{
tip += '<span style="font-size:8px;">收盘:</span><span style="font-size:8px;color: #33AA11;align:right;">'+close+' </span><br/>';
}
if(zde>0){
tip += '<span style="font-size:8px;">涨跌额:</span><span style="font-size:8px;color: #DD2200;align:right;">'+zde+' </span><br/>';
}else{
tip += '<span style="font-size:8px;">涨跌额:</span><span style="font-size:8px;color: #33AA11;align:right;">'+zde+' </span><br/>';
}
if(zdf>0){
tip += '<span style="font-size:8px;">涨跌幅:</span><span style="font-size:8px;color: #DD2200;align:right;">'+zdf+'% </span><br/>';
}else{
tip += '<span style="font-size:8px;">涨跌幅:</span><span style="font-size:8px;color: #33AA11;align:right;">'+zdf+'% </span><br/>';
}
if(y>10000){
tip += '<span style="font-size:8px;">成交量 '+(y*0.0001).toFixed(2)+"(亿股)</sapn>";
}else{
tip += '<span style="font-size:8px;">成交量:'+y+"(万股)</span>";
}
tip+="</div>"
return tip;
}
function failCallback(){
//常量本地化
Highcharts.setOptions({
global : {
useUTC : true
}
});
$(DIVID).highcharts('StockChart', {
chart:{
renderTo : DIVID,
margin: [0, 0,0, 0],
plotBorderColor: '#3C94C4',
plotBorderWidth: 0,
panning:false,
pinchType:'x'
}, rangeSelector:{
enabled: false,
},
/*导出配置*/
exporting: {
enabled: false,
},
/*创建者信息*/
credits: {
enabled: false,
},
/*下部时间拖拉选择*/
navigator: {
enabled: false,
/*关闭时间选择*/
baseseries: 10
}, scrollbar: {
enabled: false /*关闭下方滚动条*/
},
/*底部滚动条*/
scrollbar: {
enabled: false
},
plotOptions:{
//去掉分时线上的hover事件
series: {
states: {
hover: {
enabled: true
}
},
line: {
marker: {
enabled: false
}
},
},
},
yAxis: [{
opposite: false,//是否把它显示到另一边(右边)
labels: {
align: 'right',
x: -3
},
title: {
text: ''
},
height: '60%',
lineWidth: 1,
},
{
opposite: true,//是否把它显示到另一边(右边)
labels: {
align: 'right',
x: 40,
},
title: {
text: ''
},
lineWidth: 1,
height: '60%',
gridLineWidth: 1,
},
{
opposite: false,//是否把它显示到另一边(右边)
labels: {
align: 'right',
x: -3,
},
title: {
text: ''
},
top: '65%',
height: '35%',
offset: 0,
lineWidth: 2,
}], series : [{
name : 'AAPL Stock Price',
data : [[0, 15], [10, -50], [20, -56.5], [30, -46.5], [40, -22.1],
[50, -2.5], [60, -27.7], [70, -55.7], [80, -76.5]],//[["9:30",200],["10:30",205]["11:30/13:00",210],["14:00",215],["15:00",220]],
type : 'scatter',
color:'transparent',
type : 'areaspline',
tooltip : {
valueDecimals : 2
},
fillColor : {
linearGradient : {
x1: 0,
y1: 0,
x2: 0,
y2: 1
},
stops : [
[0, Highcharts.getOptions().colors[0]],
[1, Highcharts.Color(Highcharts.getOptions().colors[0]).setOpacity(0).get('rgba')]
]
},
yAxis:0,
},
{
type: 'column',
name: '成交量',
data: "",
yAxis: 1,
dataGrouping: {
enabled: false,
forced: true
},
yAxis:2,
}]
});
}
function getDateUTC(date){
var dArr = new Array();
date+="";
for(var hh=0;hh<3;hh++){
var numb ;
if(hh==0){
numb = Number(date.slice(0,4));
}
else {
numb= Number(date.slice((hh-1)*2+4,hh*2+4));
};
dArr.push(numb);
}
var dateUTC = Number(Date.UTC(dArr[0],dArr[1],dArr[2],0,0));//得出的UTC时间
return dateUTC;
}
股票k线的更多相关文章
- 股票K线图-JfreeChart版
http://blog.csdn.net/ami121/article/details/3953272 股票K线图-JfreeChart版 标签: jfreechartpropertiesapplet ...
- 利用JFreeChart绘制股票K线图完整解决方案
http://blog.sina.com.cn/s/blog_4ad042e50100q7d9.html 利用JFreeChart绘制股票K线图完整解决方案 (2011-04-30 13:27:17) ...
- IOS 股票K线图、分时图
IOS 股票K线图.分时图,网上开源项目很少,质量也是参差不齐:偶尔搜索到看似有希望的文章,点进去,还是个标题党:深受毒害.经过一段时间的探索,终于在开源基础上完成了自己的股票K线图.分时图: 先放出 ...
- 基于Echarts的股票K线图展示
发布时间:2018-10-31 技术:javascript+html5+canvas 概述 基于echarts的股票K线图展示,只需引用单个插件,通过简单配置,导入数据,即可实现炫酷复杂的K线 ...
- highcharts绘制股票k线
借助highcharts绘制股票k线: 后台通过websocket没个一定时间下发最新数据,然后重新绘制k线; 开发文档: https://api.highcharts.com/highcharts/ ...
- Highstock生成股票K线图
在线演示 本地下载 使用HightStock生成股票K线图例子.
- WPF中使用amCharts绘制股票K线图
原文:WPF中使用amCharts绘制股票K线图 本想自己用GDI绘图, 通过数据直接绘制一张蜡柱图, 但觉得这样子的功能比较少, 所以到网上搜索一些能画出K线图的控件. 发现DynamicDataD ...
- 用python的matplotlib和numpy库绘制股票K线均线和成交量的整合效果(含量化验证交易策略代码)
在用python的matplotlib和numpy库绘制股票K线均线的整合效果(含从网络接口爬取数据和验证交易策略代码)一文里,我讲述了通过爬虫接口得到股票数据并绘制出K线均线图形的方式,在本文里,将 ...
- PHP使用HighChart生成股票K线图详解
本人qq群也有许多的技术文档,希望可以为你提供一些帮助(非技术的勿加). QQ群: 281442983 (点击链接加入群:http://jq.qq.com/?_wv=1027&k=29Lo ...
- python pandas 画图、显示中文、股票K线图
目录: 1.pandas官方画图链接 2.标记图中数据点 3.画图显示中文 4.画股票K线图 5.matplotlib基本用法 6.format输出 6.format输出例子 eps_range=[0 ...
随机推荐
- linux中的find命令——查找文件名
1.在某目录下查找名为“elm.cc”的文件 find /home/lijiajia/ -name elm.cc 2.查找文件名中包含某字符(如"elm")的文件 find /ho ...
- mysql提权笔记
最近小菜遇到mysql提权,总是会搞错,就记记笔记吧!以后方便用 先说手工吧! mysql<5.0,导出路径随意:5.0<=mysql<5.1,则需要导出至目标服务器的系统目录(如: ...
- xfs文件系统
引用http://blog.chinaunix.net/uid-522675-id-4665059.html xfs文件系统使用总结 1.3 xfs相关常用命令xfs_admin: 调整 xfs 文件 ...
- windows知识点
https://technet.microsoft.com/zh-cn/windows/dd641430 win7相关资源 23. Remtoe FX是微软WIN2008 R2的SP1新功能首先您需 ...
- OpenJudge计算概论-计算书费
/*============================================== 计算书费 总时间限制: 1000ms 内存限制: 65536kB 描述 下面是一个图书的单价表: 计算 ...
- 树莓派 2 win 10 IOT
Setting up Windows 10 for IoT on your Raspberry Pi This week at the BUILD conference in San Francisc ...
- 解决Win10默认占用80端口
方案1: 以管理员身份运行cmd;输入net stop http;如果提示是否真的需要停止这些服务,则选择“Y”;完成后输入:sc config http start=disabled 方案2: Ct ...
- 【shell】case语句
case只能判断一种条件关系,而if能判断多种条件关系 #!/bin/bash read -p "please input your choice (high/middle/low):&qu ...
- redhat编译安装cmake
将RHEL的yum软件源更换为CentOS的软件源之后,其中的cmake版本太低,为2.6.4版本,编译较新的软件时会提示cmake版本太低,所以有必要编译安装最新版的cmake. 1. 更换yu ...
- 【Spring-AOP-学习笔记-7】@Around增强处理简单示例
阅读目录 简单介绍 章节1:项目结构 章节2:定义切面类.连接点注解类 章节3:为待增强的方法--添加注解声明 章节4:AspectJ配置文件 章节5:测试类xxx 章节6:测试结果 Around 增 ...