MATLAB绘图及例子总结
MATLAB绘图及例子总结
二维图
例 1
X1=[1,2,4,6,7,8,10,11,12,14,16,17,18,20];
Y1=[1,2,4,6,7,8,10,10,8,7,6,4,2,1];
figure(1)
plot(X1,Y1,'o','MarkerSize',15)
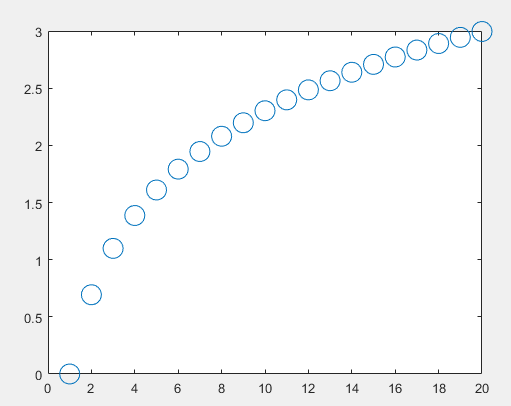
X2=1:20;
Y2=log(X2);
figure(2)
plot(X2,Y2,'o','MarkerSize',15)
结果:
例 2
X1=(0:12)*pi/6;

Y1=cos(3*X1);

X2=(0:360)*pi/180;

Y2=cos(3*X2);

figure(1)

subplot(2,2,1);

plot(X1,Y1,'o','MarkerSize',3); % 设置标准尺寸为3

xlim([0 2*pi]) % 补充知识点xlim

% x轴上下限设定xlim([a,b]);

% y轴上下限设定ylim([a,b])

subplot(2,2,2);

plot(X1,Y1,'LineWidth',2); % 设置线宽度为2

xlim([0 2*pi])

subplot(2,2,3);

plot(X2,Y2,'o','MarkerSize',3);

xlim([0 2*pi])

subplot(2,2,4);

plot(X2,Y2,'LineWidth',2);

xlim([0 2*pi])
结果:

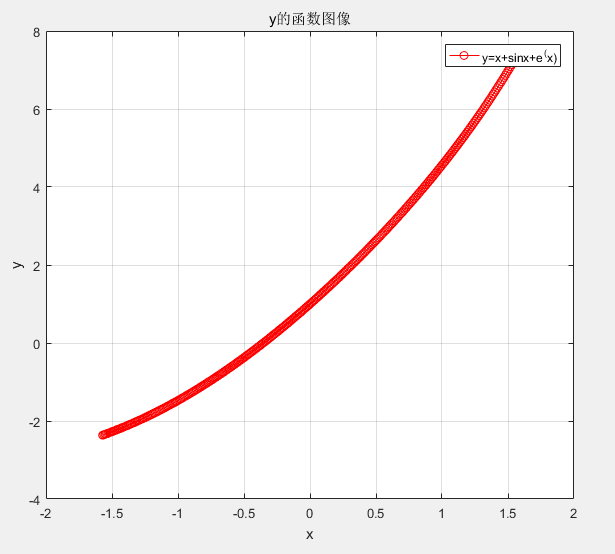
例 3
x=-pi/2:0.01:pi/2;

y=x+sin(x)+exp(x);

plot(x,y,'-ro'); % 颜色红色

grid on % 网格

title('y的函数图像');

xlabel('x');

ylabel('y');

legend('y=x+sinx+e^(x)');
结果:
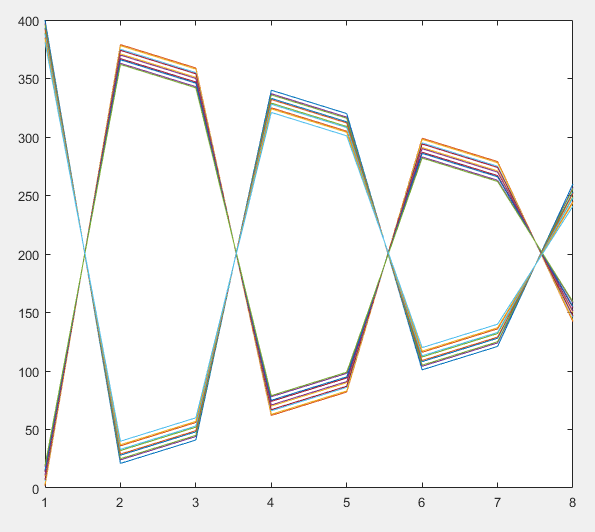
例 4
A=magic(20);
A(9:20,:)=[];
figure(1);
plot(A);
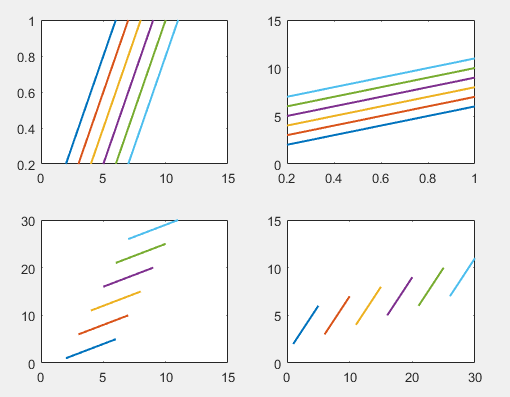
for i=1:5
for j=1:6
B(i,j)=i+j;
end
end
x=0.2:0.2:1;
figure(2)
subplot(2,2,1);plot(B,x,'LineWidth',1.5);
subplot(2,2,2);plot(x,B,'LineWidth',1.5);
C=reshape(1:30,5,6); % 变换成特定维数5×6的矩阵
subplot(2,2,3);plot(B,C,'LineWidth',1.5);
subplot(2,2,4);plot(C,B,'LineWidth',1.5);
结果:
例 5
x=-pi:pi/10:pi;

y=tan(sin(x))-sin(tan(x));

plot(x,y,'--rs','LineWidth',2,'MarkerEdgeColor','k','MarkerFaceColor','g','MarkerSize',10);

% MarkerFaceColor:点符号填充颜色

% MarkerEdgeColor:点边框颜色
结果:

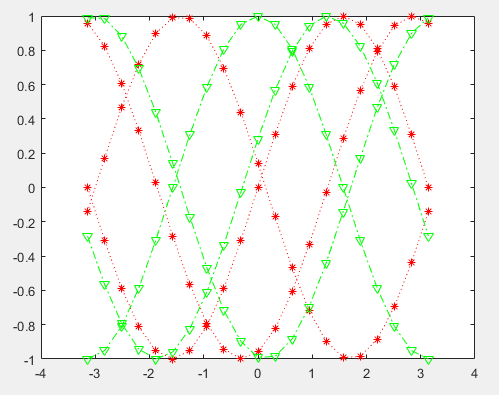
例 6
clear all

x=-pi:pi/10:pi;

y=[sin(x);sin(x+3);sin(x+5)];

z=[cos(x);cos(x+3);cos(x+5)];

figure;

plot(x,y,'r:*',x,z,'g-.v');

% r是红色,:是点线,*是星号标记

% g是绿色,-.是点画线,v是倒三角形
结果:
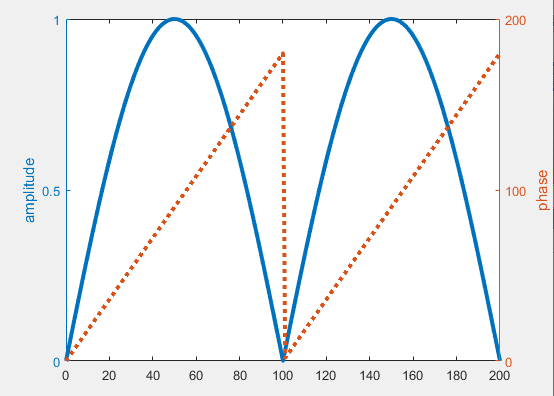
例 7
% 绘制双坐标轴

figure

angl=0:0.01*pi:2*pi;

ampl=sin(0:0.01*pi:2*pi);

z=ampl.*(cos(angl)+sqrt(-1)*sin(angl));

[AX,H1,H2]=plotyy(0:200,abs(z),0:200,angle(z)*180/pi);

% angle用来求复数矩阵相位角的弧度值,其取值为-pi到pi,z是一个复数,abs(z)是复数的模

set(get(AX(1),'Ylabel'),'String','amplitude') % amplitude振幅

set(get(AX(2),'Ylabel'),'String','phase')   % phase阶段

% get返回某些对象属性的当前值

set(H1,'LineWidth',3);

set(H2,'LineStyle',':','LineWidth',3)
结果:
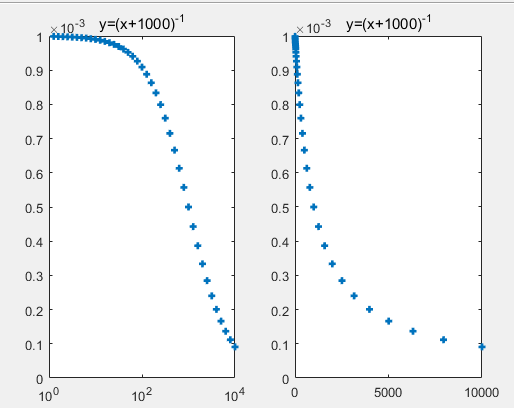
例 8
% x轴对数坐标

x=10.^(0.1:0.1:4);

y=1./(x+1000);

figure

subplot(1,2,1);

semilogx(x,y,'+','MarkerSize',5,'LineWidth',2);

title('y=(x+1000)^{-1}')

subplot(1,2,2);

plot(x,y,'+','MarkerSize',5,'LineWidth',2);

title('y=(x+1000)^{-1}')

% y轴对数坐标同理
结果1:
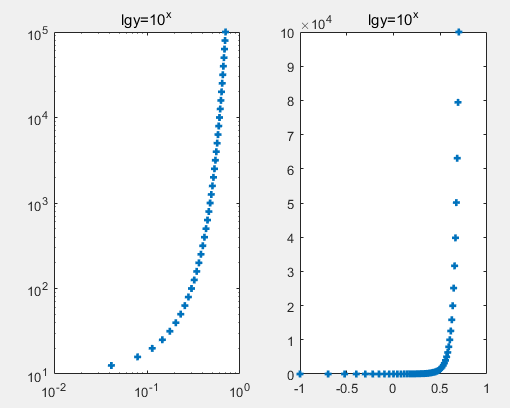
% x轴和y轴均为对数坐标

a=0.1:0.1:5;

x=log10(a);

y=10.^a;

figure

subplot(1,2,1)

loglog(x,y,'+','MarkerSize',5,'LineWidth',2)

title('lgy=10^x')

subplot(1,2,2)

plot(x,y,'+','MarkerSize',5,'LineWidth',2)

title('lgy=10^x')
结果2:
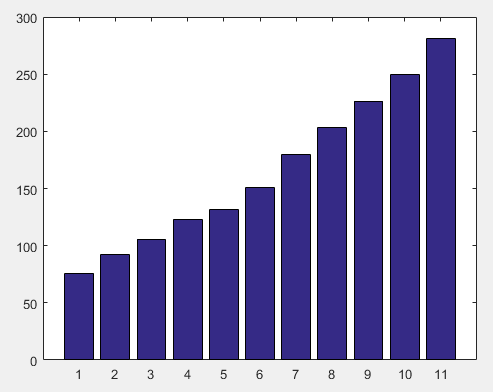
例 9
y=[75.995,91.972,105.711,123.203,131.669...

150.697,179.323,203.212,226.505,249.633,281.422];

figure;

bar(y);
结果:
例 10
x=-2:2;

Y=[6,8,7,4,5;4,8,1,12,0;4,6,21,1,3];

subplot(1,2,1),bar(x',Y','stacked')

xlabel('x'),ylabel('\Sigma y'),colormap(cool)

legend('因素 1','因素 2','因素 3')

subplot(1,2,2),barh(x',Y','grouped') % barh创建水平直方图

xlabel('y'),ylabel('x')
结果:

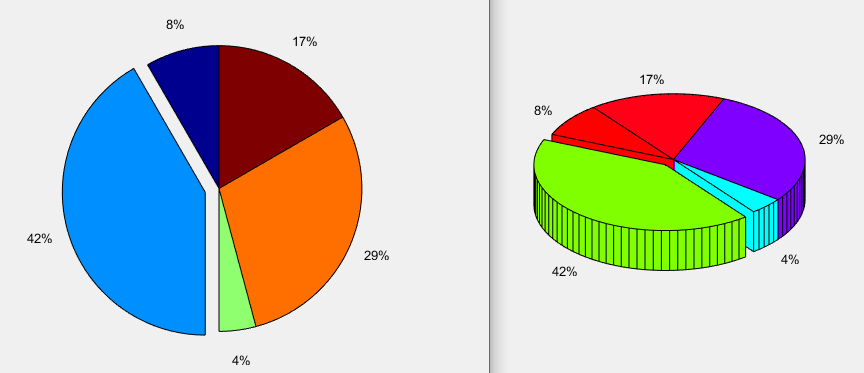
例 11
x=[1,5,0.5,3.5,2];

explode=[0,1,0,0,0];

pie(x,explode) % 饼图

colormap jet

figure

pie3(x,explode)

colormap hsv
结果:
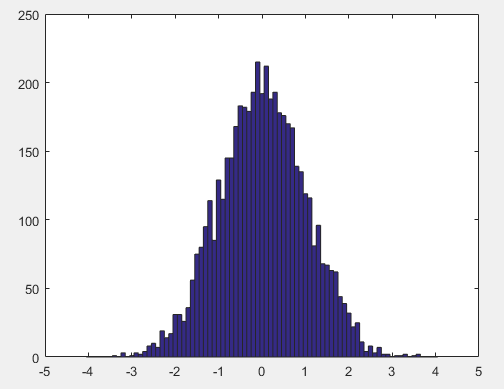
例 12
x=-4:0.1:4;

y=randn(5000,1);

hist(y,x) % 直方图
结果:
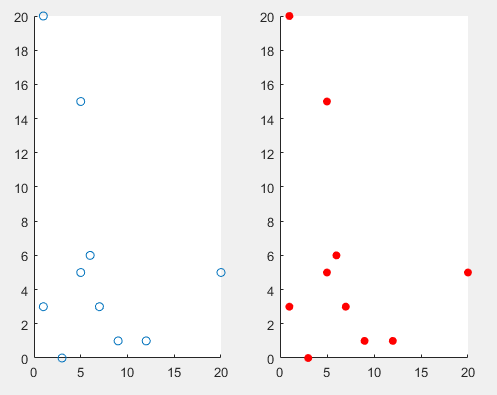
例 13
clear

figure;

x=[1,5,6,7,9,5,1,3,12,20];

y=[20,15,6,3,1,5,3,0,1,5];

subplot(121);

scatter(x,y); % 散点图

subplot(122);

scatter(x,y,[],[1,0,0],'fill');
结果:
三维图
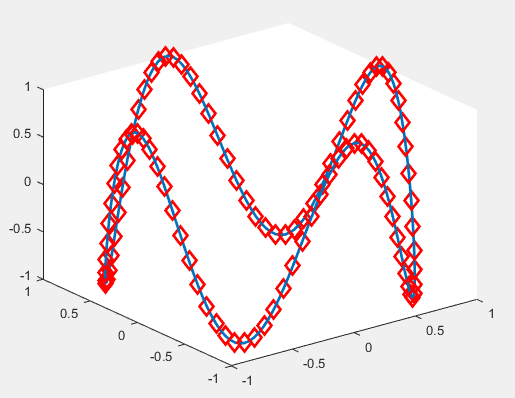
例 1
theta=0:0.01*pi:2*pi;

x=sin(theta);

y=cos(theta);

z=cos(4*theta);

figure

plot3(x,y,z,'LineWidth',2);hold on;

theta=0:0.02*pi:2*pi;

x=sin(theta);

y=cos(theta);

z=cos(4*theta);

plot3(x,y,z,'rd','MarkerSize',10,'LineWidth',2)
结果:
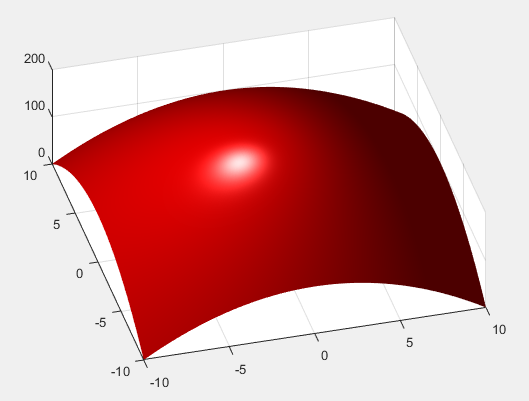
例 2
X=-10:0.1:10;

Y=-10:0.1:10;

[X,Y]=meshgrid(X,Y);

Z=-X.^2-Y.^2+200;

mesh(X,Y,Z)
结果:

例 3
figure

surf(X,Y,Z,'FaceColor','red','EdgeColor','none');

camlight left; % 左侧加一个发光物体

lighting phong % 光照模式,使图表面光滑细腻,色彩丰富

view(-15,65) % 视角的角度
结果:
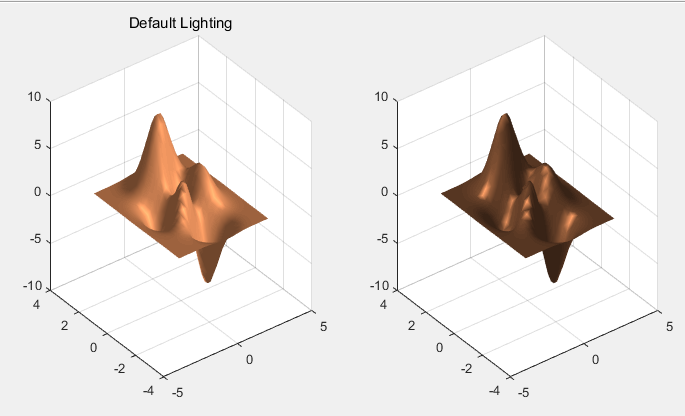
例 4
···
[X,Y,Z]=peaks(30); %peaks函数是一个典型的多元函数,本质上是一个二元高斯分布的概率密度函数
subplot(1,2,1);surfl(X,Y,Z),colormap(copper),title('Default Lighting'),shading interp
subplot(1,2,2);surfl(X,Y,Z,[-90,30],[.55,.6,2,10]),shading interp
···
结果:
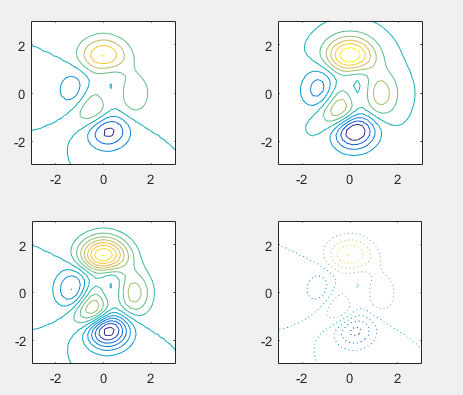
例 5
% 等高线图

[X,Y,Z]=peaks(30);

figure

subplot(2,2,1);contour(X,Y,Z);axis square

subplot(2,2,2);contour(X,Y,Z,10);axis square

subplot(2,2,3);contour(X,Y,Z,-10:1:10);axis square

subplot(2,2,4);contour(X,Y,Z,':');axis square
结果:
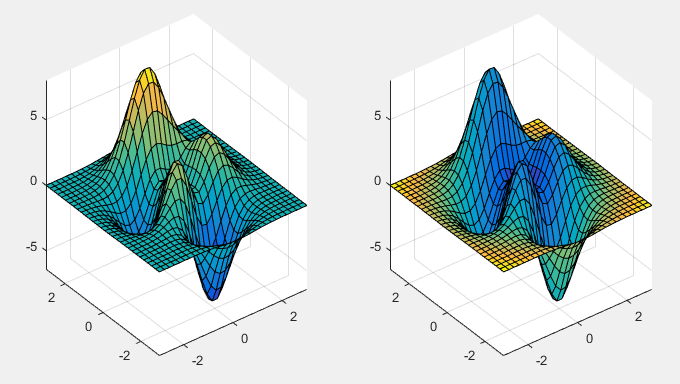
例 6
[X,Y,Z]=peaks(30);

R=sqrt(X.^2+Y.^2);

subplot(1,2,1);

surf(X,Y,Z,Z);

axis tight

subplot(1,2,2);surf(X,Y,Z,R);

axis tight
结果:
MATLAB绘图及例子总结的更多相关文章
- Matlab绘图详解
Matlab绘图 强大的绘图功能是Matlab的特点之一,Matlab提供了一系列的绘图函数,用户不需要过多的考虑绘图的细节,只需要给出一些基本参数就能得到所需图形,这类函数称为高层绘图函数.此外,M ...
- 使用axes函数在matlab绘图中实现图中图的绘制
使用axes函数在matlab绘图中实现图中图的绘制 有时为了对细节进行详细说明,需要在一个较大坐标轴上绘制一个小图来对局部进行放大以阐述结果. 这可以通过调用axes函数实现. 下面通过绘制 y=1 ...
- matlab绘图--线性规划图解法示意
matlab绘图--线性规划图解法示意 图解法 matlab绘图 区域填充 线性规划问题: matlab绘图 L1=[4,0;4,4]; plot(L1(:,1),L1(:,2));hold on ...
- Matlab绘图(一二三维)
Matlab绘图 强大的绘图功能是Matlab的特点之一,Matlab提供了一系列的绘图函数,用户不需要过多的考虑绘图的细节,只需要给出一些基本参数就能得到所需图形,这类函数称为高层绘图函数.此外,M ...
- Matlab绘图高级部分
图形是呈现数据的一种直观方式,在用Matlab进行数据处理和计算后,我们一般都会以图形的形式将结果呈现出来.尤其在论文的撰写中,优雅的图形无疑会为文章加分.本篇文章非完全原创,我的工作就是把见到的Ma ...
- (转载)MatLab绘图
转载自:http://www.cnblogs.com/hxsyl/archive/2012/10/10/2718380.html 转载自:http://www.cnblogs.com/jeromebl ...
- Matlab绘图系列之高级绘图
Matlab绘图系列之高级绘图 原帖地址: http://blog.163.com/enjoy_world/blog/static/115033832007865616218/ Matlab绘图 20 ...
- matlab绘图(详细)(全面)
Matlab绘图 强大的绘图功能是Matlab的特点之一,Matlab提供了一系列的绘图函数,用户不需要过多的考虑绘图的细节,只需要给出一些基本参数就能得到所需图形,这类函数称为高层绘图函数.此外,M ...
- Matlab 绘图完整入门
Matlab绘图 强大的绘图功能是Matlab的特点之一,Matlab提供了一系列的绘图函数,用户不需要过多的考虑绘图的细节,只需要给出一些基本参数就能得到所需图形,这类函数称为高层绘图函数.此外,M ...
随机推荐
- python c++ 混合编程中python调用c++string返回类型的函数,python中返回为数字的解决办法
本随笔解决 Python使用ctypes 调用c++dll 字符串返回类型函数,在python中显示为数字:原文解决方案见so: https://stackoverflow.com/questions ...
- JMeter学习之元件的作用域与执行顺序
1.元件的作用域 JMeter中共有8类可被执行的元件(测试计划与线程组不属于元件),这些元件中,取样器是典型的不与其它元件发生交互作用的元件,逻辑控制器只对其子节点的取样器有效,而其它元件(conf ...
- windows 端口转发 netsh
原文地址 listenaddress # 本地监听的ip listenport # 本地监听的端口 connectaddress # 转发请求接收的主机ip connectport # 转发请求接收的 ...
- 关于Python中正则使用findall和分组的一个坑
版权声明:本文为sam的原创文章,转载请添加出处:http://blog.csdn.net/samed https://blog.csdn.net/samed/article/details/5055 ...
- Mybatis各种查询
实体Emp private int empno; private String ename; private String job; private Integer mgr; private Date ...
- HDU 3824/ BZOJ 3963 [WF2011]MachineWorks (斜率优化DP+CDQ分治维护凸包)
题面 BZOJ传送门(中文题面但是权限题) HDU传送门(英文题面) 分析 定义f[i]f[i]f[i]表示在iii时间(离散化之后)卖出手上的机器的最大收益.转移方程式比较好写f[i]=max{f[ ...
- 自制tomcat镜像
1.编写dockerfile FROM centos MAINTAINER raygift@qq.com # 安装vim RUN yum -y install vim net-tools ENV BA ...
- 关系型数据库与NoSQL的对比
SQL(结构化的查询语言)数据库是过去四十年间存储数据的主要方式.20世纪90年代末随着Web应用和MySQL.PostgreSQL和SQLite等开源数据库的兴起,用户爆炸式的增长. NoSQL数据 ...
- 浏览器环境下的microtaks和macrotasks
带有可视代码执行顺序的原文链接https://jakearchibald.com/201...,此篇文字并非其完整翻译,加入了一部分自己的理解,比如将其中的task替换为macrotask或是删除了可 ...
- debian、ubuntu安装metasploit通用方法
网上有很多方法让去github上下载安装,这方法的确可以但是特别慢,更新也特别慢,这里写下比较快的方法 1.添加kali源 vim /etc/apt/sources.list 在原有源的基础上添加国内 ...