ECharts的使用与总结
ECharts的使用与总结
一,介绍与需求
1.1,介绍
ECharts商业级数据图表,一个纯Javascript的图表库,可以流畅的运行在PC和移动设备上,兼容当前绝大部分浏览器(IE6/7/8/9/10/11,chrome,firefox,Safari等),底层依赖轻量级的Canvas类库ZRender,提供直观,生动,可交互,可高度个性化定制的数据可视化图表。创新的拖拽重计算、数据视图、值域漫游等特性大大增强了用户体验,赋予了用户对数据进行挖掘、整合的能力。
支持折线图(区域图)、柱状图(条状图)、散点图(气泡图)、K线图、饼图(环形图)、雷达图(填充雷达图)、和弦图、力导向布局图、地图、仪表盘、漏斗图、事件河流图等12类图表,同时提供标题,详情气泡、图例、值域、数据区域、时间轴、工具箱等7个可交互组件,支持多图表、组件的联动和混搭展现
1.2,需求
可视化展示数据
二,常规使用
以常规饼图为例
第一步:获取 ECharts
cnpm install echarts --save
第二步:按需引入 ECharts
 // 引入 ECharts 主模块

 var echarts = require('echarts/lib/echarts');

 // 引入饼图

 require('echarts/lib/chart/pie');

 // 引入提示框和标题组件

 require('echarts/lib/component/tooltip');

 require('echarts/lib/component/title');
第三步:图表的容器
必须设置宽高(width,height),否则没有效果
<div id='main' style={{ width: '100%', height: 360 }}></div>
第四步:绘制图表
配置数据选项:
 var option={

                             title:{},//图表的标题

                             tooltip:{},//应用的组件

                             legend:{},//图例组件包括颜色、朝向、位置等

                             xAxis:[{}],//直角坐标系中x轴需要配置的

                             yAxis:[{}],//直角坐标系中y轴需要配置的

                             series:[{}],//系列列表,包括列表类型、颜色、数据等

             }
图表的绘制:
 let chartDate= [{

             value: 3661,

             name: '三角函数的图象与性质'

         }, {

             value: 5713,

             name: '空间向量及其运算'

         },

         {

             value: 4563,

             name: '直线与圆锥曲线的位置关系'

         }, {

             value: 9938,

             name: '复数代数形式的四则运算'

         }, {

             value: 17623,

             name: '集合'

         }, {

             value: 3299,

             name: '公式的联系'

         }]

 var mainPieChart = eCharts.init(document.getElementById('main'));

         // 绘制图表

         mainPieChart .setOption({

             backgroundColor: '#fff',

             title: {

                 text: '三角函数',

                 x: 'center',

                 y: '38%',

                 textStyle: {

                     fontWeight: 'bold',

                     fontSize: 16

                 }

             },

             tooltip: {

                 show: true,

                 trigger: 'item',

                 formatter: "{b}: {c} ({d}%)"

             },

             legend: {

                 orient: 'horizontal',

                 top: '74%',

                 // data: ['<10w', '10w-50w', '50w-100w', '100w-500w', '>500w']

                 data: [{

                     name: '三角函数的图象与性质',

                     // 强制设置图形为圆。

                     icon: 'circle',

                 },

                 {

                     name:  '空间向量及其运算',

                     // 强制设置图形为圆。

                     icon: 'circle',

                 },

                 {

                     name:  '直线与圆锥曲线的位置关系',

                     // 强制设置图形为圆。

                     icon: 'circle',

                 },

                 {

                     name:'复数代数形式的四则运算',

                     // 强制设置图形为圆。

                     icon: 'circle',

                 },

                 {

                     name: '集合',

                     // 强制设置图形为圆。

                     icon: 'circle',

                 },

                 {

                     name: '公式的联系',

                     // 强制设置图形为圆。

                     icon: 'circle',

                 }],

             },

             series: [{

                 type: 'pie',

                 selectedMode: 'single',

                 zlevel:1,

                 center:['50%', '40%'],//饼图的中心(圆心)坐标,数组的第一项是横坐标,第二项是纵坐标。

                 radius: ['36%', '58%'],

                 color: ['#86D560', '#AF89D6', '#59ADF3', '#FF999A', '#FFCC67'],

                 symbolOffset: [0, 120],

                 label: {

                     normal: {

                         position: 'outside',

                         formatter: '{d}%',

                         textStyle: {

                             color: '#999999',

                             fontWeight: 'bold',

                             fontSize: 14

                         }

                     },

                     emphasis: {

                         color: '#57B3FE',

                     }

                 },

                 labelLine: {

                     normal: {

                         show: false

                     }

                 },

                 data: chartDate

             }]

         });
选中第一个高亮
  mainPieChart.dispatchAction({

                 type: 'highlight',          //高亮指定的数据图形。通过seriesName或者seriesIndex指定系列。如果要再指定某个数据可以再指定dataIndex或者name。

                 seriesIndex: 0,  // 可选,系列 index,可以是一个数组指定多个系列

                 dataIndex: 0,          // 可选,数据的 index

             });
效果如下:

三,特殊使用
3.1,多类图切换保存
工具栏toolbox
   toolbox: {//工具栏配置  默认不显示

                 feature : {

                     dataView : {show: true, readOnly: false},//数据类型

                     magicType : {show: true, type: ['line', 'bar']},//图标类型切换

                     restore : {show: true},//还原

                     saveAsImage : {show: true}//保存图片

                 },

 },
渐变色配置:
使用graphic.LinearGradient接口配置渐变色
  color:new eCharts.graphic.LinearGradient(0, 0, 0, 1, [{

                                 offset: 0,

                                 color: '#FFCFCF'

                             }, {

                                 offset: 1,

                                 color: '#F05353'

                             }]),
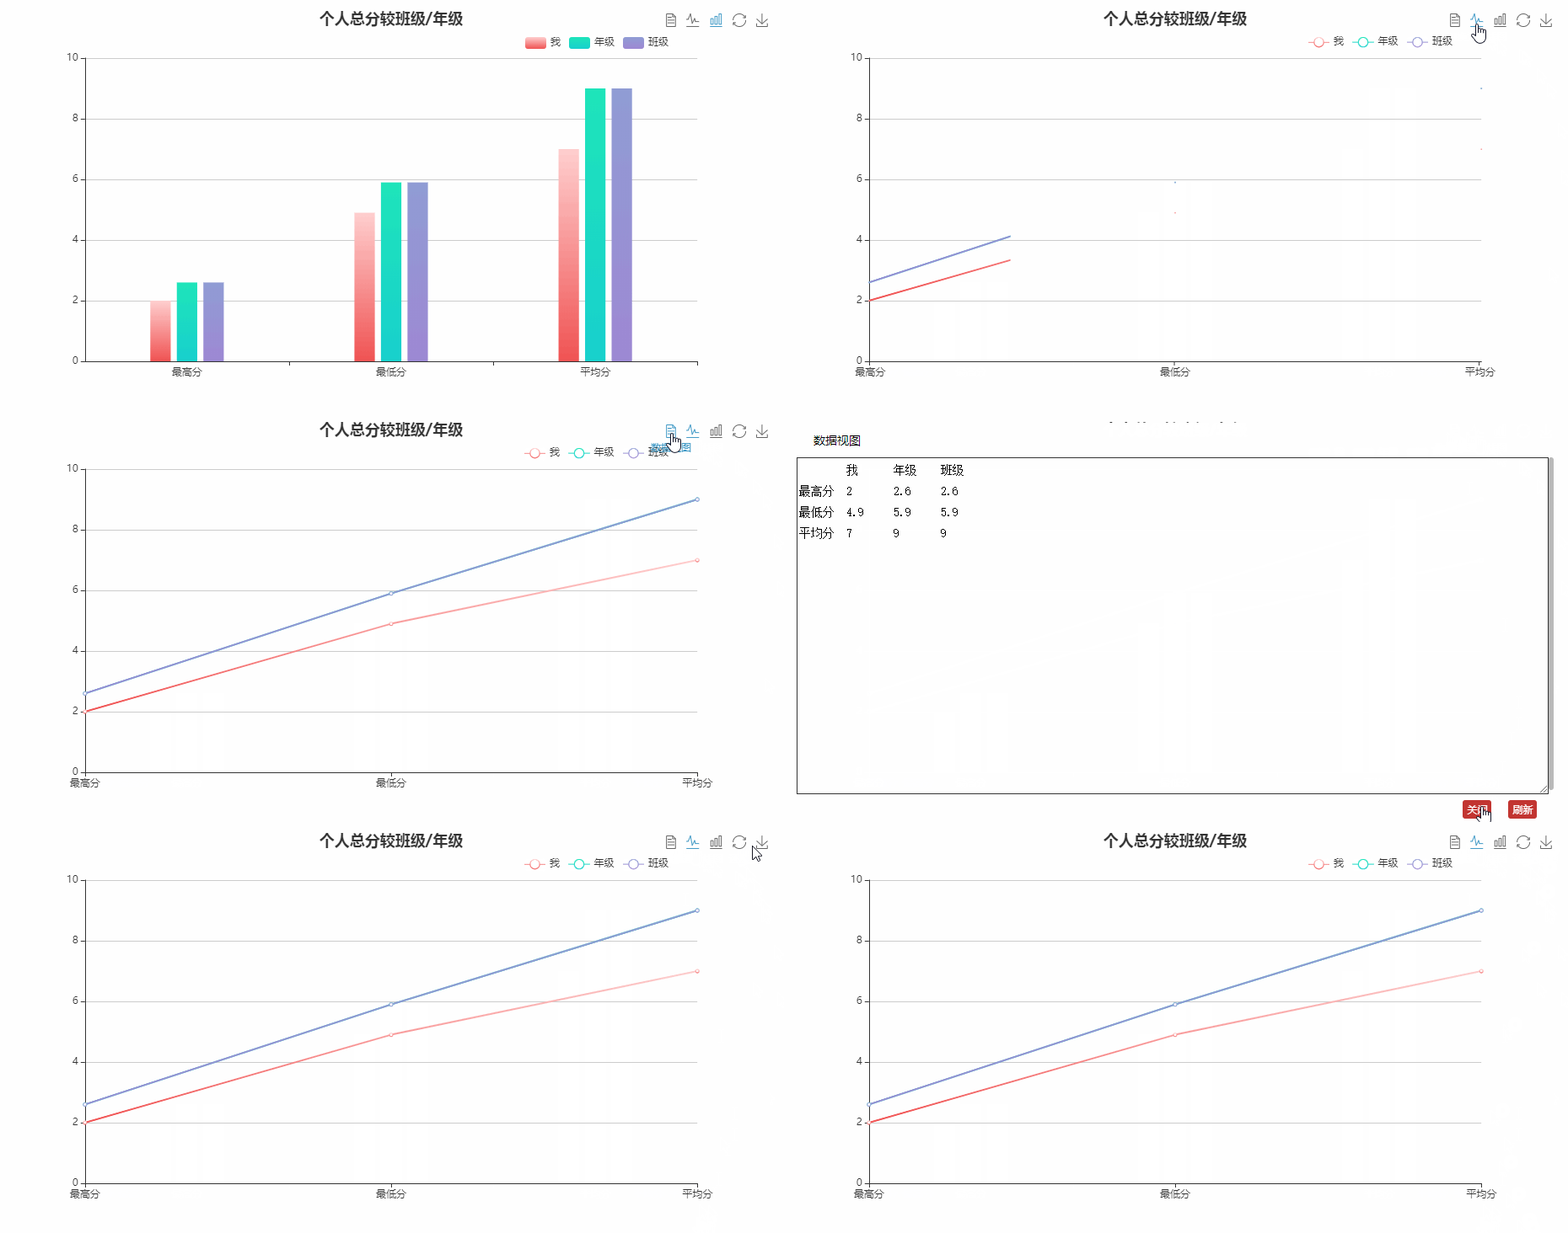
绘制图表完整配置:
 main.setOption({

             title: {

                 text: '个人总分较班级/年级',

                 left: 'center',

             },

             legend: {

                 top: 30,

                 right: 120,

                 bottom: 30,

                 data: ['我', '年级', '班级']

             },

             toolbox: {

                 feature : {

                     dataView : {show: true, readOnly: false},

                     magicType : {show: true, type: ['line', 'bar']},

                     restore : {show: true},

                     saveAsImage : {show: true}

                 },

             },

             calculable: true,

             tooltip: {

                 formatter: function (params) {

                     return params.name + "<br/>" + '分数: ' + params.value;

                 }

             },

             xAxis: [

                 {

                     type : 'category',

                     data: ['最高分', '最低分', '平均分']

                 }

             ],

             yAxis: [

                 {

                     type: 'value'

                 }

             ],

             series: [

                 {

                     name: '我',

                     type: 'bar',

                     barWidth: '10%',

                     itemStyle: {

                         normal: {

                             show: true,

                             color:

                             new eCharts.graphic.LinearGradient(0, 0, 0, 1, [{

                                 offset: 0,

                                 color: '#FFCFCF'

                             }, {

                                 offset: 1,

                                 color: '#F05353'

                             }]),

                         }

                     },

                     data: [2.0, 4.9, 7.0],

                 },

                 {

                     name: '年级',

                     type: 'bar',

                     barWidth: '10%',

                     itemStyle: {

                         normal: {

                             show: true,

                             color:

                             new eCharts.graphic.LinearGradient(0, 0, 0, 1, [{

                                 offset: 0,

                                 color: '#1FE5BA'

                             }, {

                                 offset: 1,

                                 color: '#18D0CE'

                             }]),

                         }

                     },

                     data: [2.6, 5.9, 9.0],

                 },

                 {

                     name: '班级',

                     type: 'bar',

                     barWidth: '10%',

                     itemStyle: {

                         normal: {

                             show: true,

                             color:

                              new eCharts.graphic.LinearGradient(0, 0, 0, 1, [{

                                 offset: 0,

                                 color: '#909DD4'

                             }, {

                                 offset: 1,

                                 color: '#9E88D3'

                             }]),

                         }

                     },

                     data: [2.6, 5.9, 9.0],

                 }

             ]

         });
效果:

3.2,进度图
graphic 是原生图形元素组件。
  graphic: [{

                 type: 'text',

                 left: '42%',

                 top: '48%',

                 style: {

                     text: '4',

                     fill: '#08A0E2',

                     fontSize: 24

                 }

             }, {

                 type: 'text',

                 left: '46%',

                 top: '48%',

                 style: {

                     text: ' /12',

                     fill: '#999',

                     fontSize: 24

                 }

             }],
clockWise: true,//饼图的扇区是否是顺时针排布。默认是false
startAngle:270,//起始角度,支持范围[0, 360]。默认为0
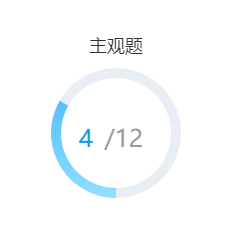
绘制图表完整配置:
 main.setOption({

             backgroundColor: '#fff',

             title: {

                 text: '主观题',

                 left: 'center',

                 textStyle: {

                     color: '#333333',

                     fontWeight: 'normal'

                 },

                 // subtextStyle: {

                 //     color: '#57B3FE'

                 // }

             },

             graphic: [{

                 type: 'text',

                 left: '42%',

                 top: '48%',

                 style: {

                     text: '4',

                     fill: '#08A0E2',

                     fontSize: 24

                 }

             }, {

                 type: 'text',

                 left: '46%',

                 top: '48%',

                 style: {

                     text: ' /12',

                     fill: '#999',

                     fontSize: 24

                 }

             }],

             series: [

                 {

                     name: "",

                     type: "pie",

                     clockWise: true,//饼图的扇区是否是顺时针排布。

                     startAngle:270,//起始角度,支持范围[0, 360]。

                     radius: [55, 65],

                     itemStyle: {

                         normal: {

                             label: {

                                 show: false

                             },

                             labelLine: {

                                 show: false

                             },

                         }

                     },

                     hoverAnimation: false,

                     center: ['50%', '50%'],

                     label: {

                         normal: {

                             show: false,

                             position: "center"

                         }

                     },

                     data: [{

                         value: 4,

                         name: "",

                         label: {

                             normal: {

                                 show: false

                             }

                         },

                         itemStyle: {

                             normal: {

                                 color:colorValue,

                             }

                         }

                     },

                     {

                         value: 8,

                         name: "",

                         label: {

                             normal: {

                                 show: false

                             }

                         },

                         itemStyle: {

                             normal: {

                                 color: "#E9EDF5"

                             }

                         }

                     }

                     ]

                 }

             ]

         })
效果:

3.3,交互柱状图
鼠标事件包括 'click'、'dblclick'、'mousedown'、'mousemove'、'mouseup'、'mouseover'、'mouseout'、'globalout'、'contextmenu'。
组件交互的行为事件,主要通过 on 方法添加事件处理函数:
  main.on('click', setOptionAction);//点击选中 显示对应的name并高亮

         main.on('mouseover',setOptionAction);//鼠标移入选中 显示对应的name并高亮

         function setOptionAction(params) {

             main.setOption({

                 title: {

                     subtext: params.name,

                 },

                 series: [

                     {

                         itemStyle: {

                             normal: {

                                  color: function (param){

                                   return (params.value==chartData[param.dataIndex])?

                                     '#57B3FE':

                                     new eCharts.graphic.LinearGradient(

                                 0, 0, 0, 1,

                                 [

                                     { offset: 0, color: '#909DD4' },

                                     { offset: 1, color: '#9E88D3' }

                                 ]

                             );

                               },

                             },

                         },

                     }

                 ]

             });

         }
label字数太多时,显示点点,如下

  axisLabel: {

                         formatter: function (value) {

                             var ret = "";//拼接加\n返回的类目项

                             var maxLength = 6;//每项显示文字个数

                             var valLength = value.length;//X轴类目项的文字个数

                             var rowN = Math.ceil(valLength / maxLength); //类目项需要换行的行数

                             if (rowN > 1)//如果类目项的文字大于3,

                             {

                                 var temp = "";//每次截取的字符串

                                 var start = 0;//开始截取的位置

                                 var end = maxLength;//结束截取的位置

                                 //这里也可以加一个是否是最后一行的判断,但是不加也没有影响,那就不加吧

                                 temp = value.substring(start, end) + "......";

                                 ret += temp; //凭借最终的字符串

                                 return ret;

                             }

                             else {

                                 return value;

                             }

                         }

                     }
效果:

3.4,怀特图
echarts没有直接画怀特图的配置,实现思路:创建两个坐标轴,隐藏两个X轴,去掉Y轴线,保留一个刻度。
完整配置如下:
  let yAxisMonth = ["NL-3A s1 t1 s1 t1 s3",

         "FE-5A",

         "FE-3AC",

         "GX6",

         "FE-S1",

         "FE-7A",

         "KC-1B",

         "KC-2HB(15TD)",

         "KC-2(15TD)",

         "FE-7",

         "FE-3AD",

         "KC-2HB",

         "FE-4KACK-2",

         "NL-3",

         "FE-6"

     ];

     let barData = [

         84,

         78,

         45,

         40,

         33,

         7,

         100,

         5,

         89,

         76,

         42,

         16,

         11,

         5,

         4

     ];

 let selectValue= 100,

  let ShowPosition= 'KC-1B',

 main.setOption({

             // backgroundColor: "#020e25",

             title: {

                 text: Charttitle,

                 left: 'center',

             },

             legend: null,

             tooltip: {

                 trigger: 'axis',

                 axisPointer: {

                     type: 'line',  // 默认为直线,可选为:'line' | 'shadow'

                     lineStyle: {          // 直线指示器样式设置

                         color: '#48b',

                         width: 2,

                         type: 'solid',

                         shadowOffsetX: -160,

                         shadowColor: '#48b'

                     },

                 },

                 formatter: function (params) {

                     return params[0].name + "<br/>" + '百分比: ' + params[0].value + '%';

                 }

             },

             grid: {

                 containLabel: true,

                 left: "2%",

                 right: "10%",

                 top: "10%",

                 bottom: "5%",

             },

             yAxis: [{

                 data: yAxisMonth,

                 inverse: true,

                 boundaryGap: true, // 类目起始和结束两端空白策略

                 axisLine: {

                     show: true,

                     onZero: true,

                     lineStyle: {        // 属性lineStyle控制线条样式

                         color: '#CFCFCF',

                         width: 0,

                         type: 'solid',

                     }

                 },

                 axisTick: {

                     show: false,

                     length: 8,

                     alignWithLabel: true,

                 },

                 axisLabel: {

                     margin: 60,

                     textStyle: {

                         fontSize: 12,

                         color: '#777777',

                     },

                 },

             },

             {

                 type: 'category',

                 silent: true,

                 position: 'left',// 文字位置

                 boundaryGap: true, // 类目起始和结束两端空白策略

                 offset: 1,

                 data: [0, 0.2, 0.4, 0.6, 0.8, 1, 1.2, 1.4, 1.6, 1.8, 2.0, 2.2, 2.40, 2.60, 2.8, 3],

                 inverse: false,

                 axisLine: {

                     lineStyle: {        // 属性lineStyle控制线条样式

                         color: '#CFCFCF',

                         width: 0,

                         type: 'solid',

                     },

                     show: true,

                 },

                 axisTick: {

                     alignWithLabel: true,

                     length: 12,

                     // secondTick: {

                     //     show: true,//是否显示二级刻度

                     //     interval: 0,//二级刻度间间隔大小

                     //     length: 12,//二级刻度线的长度

                     //     lineStyle: { //刻度线的线条样式

                     //         color: 'red',

                     //         width: 12,

                     //         type: 'solid',

                     //     }

                     // }

                     // lineStyle: {        // 属性lineStyle控制线条样式

                     //     color: '#CFCFCF',

                     //     width: 6,

                     //     type: 'solid',

                     // },

                 },

                 axisPointer: {

                     show: false,

                 },

                 axisLabel: {

                     margin: 20,

                     width: 56,

                     textStyle: {

                         fontSize: 12,

                         color: '#333333',

                     },

                     shadowOffsetX: -4,

                     shadowColor: '#CFCFCF',

                 },

                 splitLine: {

                     show:true,

                     // interval:0,

                     lineStyle: {

                         color: '#fff',

                         shadowOffsetX:-8,

                         shadowColor:'#CFCFCF',

                     }

                 },

             },

             ],

             xAxis: [{

                 type: "value",

                 splitLine: {

                     show: false

                 },

                 axisLabel: {

                     show: false

                 },

                 axisTick: {

                     show: false

                 },

                 axisPointer: {

                     show: false,

                 },

                 axisLine: {

                     show: false

                 }

             },

             {

                 type: "value",

                 splitLine: {

                     show: false

                 },

                 axisLabel: {

                     show: false

                 },

                 axisTick: {

                     show: false

                 },

                 axisPointer: {

                     show: false,

                 },

                 axisLine: {

                     show: false

                 }

             },

             ],

             series: [{

                 z: 10,

                 type: 'pictorialBar',

                 label: {

                     normal: {

                         show: true,

                         formatter: function (param) {

                             return (selectValue == param.value) ? '' : param.value + '%';

                         },

                         position: 'right',// 文字位置

                         textStyle: {

                             fontSize: 12,

                             color: '#666666',

                         }

                     }

                 },

                 symbolRepeat: false,

                 symbolSize: ['100%', 10],// 柱子大小

                 symbolOffset: [10, 0],

                 itemStyle: {

                     normal: {

                         color: '#FF8E71',

                     },

                     emphasis: {

                         color: '#1790FF',

                     }

                 },

                 symbolClip: true,

                 symbolPosition: 'end',

                 symbol: 'rect',

                 markPoint: {

                     symbolSize: 32,

                     symbolOffset: [10, 0],//偏移量

                     symbolRotate: 270,//旋转

                     itemStyle: {

                         normal: {

                             borderColor: '#1790FF',

                             borderWidth: 2, // 标注边线线宽,单位px,默认为1

                             color: '#fff',

                             label: {

                                 position: 'insideRight',

                                 fontSize: 12,

                                 color: '#1790FF'

                             }

                         },

                     },

                     normal: {

                         label: {

                             position: 'insideRight',

                         }

                     },

                     data: [

                         { name: '最高', value: '我', xAxis: selectValue, yAxis: ShowPosition },//通过yAxis来控制markPoint的位置

                         { name: '我', value: '我', xAxis: selectValue, yAxis: ShowPosition },

                     ]

                 },

                 data: barData,

             },

             ]

         });

         main.dispatchAction({

             type: 'highlight',          //高亮指定的数据图形。通过seriesName或者seriesIndex指定系列。如果要再指定某个数据可以再指定dataIndex或者name。

             dataIndex: 6,          // 可选,数据的 index

         });
效果:

3.5,堆叠图
stack数据堆叠,同个类目轴上系列配置相同的stack值可以堆叠放置。
  {

                     name: '「-3-2」',

                     type: 'bar',

                     barWidth: '30%',

                     stack: '总量',

                     color:'#9B65FF',

                     label: {

                         normal: {

                             show: true,

                             formatter: function (param) {

                                 return param.value + '%';

                             },

                             position: 'top'

                         }

                     },

                     itemStyle: {

                         normal: {

                             barBorderRadius: [12, 0, 0,12]

                         },

                     },

                     data: [32, 30]

                 }
markPoint:图表标注。详细点击查看
效果:

ECharts的使用与总结的更多相关文章
- 一起来玩echarts系列(一)------箱线图的分析与绘制
一.箱线图 Box-plot 箱线图一般被用作显示数据分散情况.具体是计算一组数据的中位数.25%分位数.75%分位数.上边界.下边界,来将数据从大到小排列,直观展示数据整体的分布情况. 大部分正常数 ...
- Webstorm+Webpack+echarts构建个性化定制的数据可视化图表&&两个echarts详细教程(柱状图,南丁格尔图)
Webstorm+Webpack+echarts ECharts 特性介绍 ECharts,一个纯 Javascript 的图表库,可以流畅的运行在 PC 和移动设备上,兼容当前绝大部分浏览器(I ...
- ASP.NET MVC5+EF6+EasyUI 后台管理系统(67)-MVC与ECharts
系列目录 ECharts 特性介绍 ECharts,一个纯 Javascript 的图表库,可以流畅的运行在 PC 和移动设备上,兼容当前绝大部分浏览器(IE8/9/10/11,Chrome,Fire ...
- echarts+php+mysql 绘图实例
最近在学习php+mysql,因为之前画图表都是直接在echart的实例demo中修改数据,便想着两相结合练习一下,通过ajax调用后台数据画图表. 我使用的是echart3,相比较第二版,echar ...
- 数据图表插件Echarts(一)
一.引言 最近做一个智慧城市项目,项目中需要图表和报表进行数据分析,从网上找了很多,最后找到了百度开放的echarts,一个很强大的插件. 二.介绍 ECharts,缩写来自Enterprise Ch ...
- ECharts数据图表系统? 5分钟上手!
目录: 前言 简介 方法一:模块化单文件引入(推荐) 方法二:标签式单文件引入 [前言] 最近在捣鼓各种插件各种框架,发现这个ECharts还是比较不错的,文档也挺全的,还是中文的,给大家推荐一下. ...
- knockout+echarts实现图表展示
一.需要学习的知识 knockout, require, director, echarts, jquery.简单的入一下门,网上的资料很多,最直接就是进官网校习. 二.效果展示 三.require的 ...
- ECharts 初识(基于MVC+jQuery+Angularjs实现的Demo)
一.背景: 我们这行做web开发的,很多时候都需要做数据统计报表,现在我所使用的是来自百度团队的ECharts.官方网址:http://echarts.baidu.com/ 我们知 ...
- Ionic2系列——在Ionic2中使用ECharts
在群里看到有人问怎么在Ionic2中集成ECharts来显示图表.当时答应说写个blog,简单写下步骤. 在TypeScript中如果要使用第三方库,必须要有d.ts,也就是定义文件,没有这个文件的话 ...
- ECharts的简单使用过程
网页中经常要使用图表,以前使用的是highcharts插件,现在发现echarts使用起来和highcharts差不多,但是个人感觉echarts更酷炫,以下是echarts的使用过程,其实highc ...
随机推荐
- 使用JDBC CallableStatements执行存储过程
Using JDBC CallableStatements to Execute Stored Procedures Connector / J完全实现了 java.sql.CallableState ...
- [PyTorch入门之60分钟入门闪击战]之入门
深度学习60分钟入门 来源于这里. 本文目标: 在高层次上理解PyTorch的Tensor库和神经网络 训练一个小型的图形分类神经网络 本文示例运行在ipython中. 什么是PyTorch PyTo ...
- kubernetes集群中的pause容器
昨天晚上搭建好了k8s多主集群,启动了一个nginx的pod,然而每启动一个pod就伴随这一个pause容器,考虑到之前在做kubelet的systemd unit文件时有见到: 1 2 3 4 5 ...
- java里面的设计模式
文章目录 Creational(创建模式) 1. Abstract factory: 2. Builder: 3. Factory: 4. Prototype: 5. Singleton: 6. Ch ...
- IdentityServer4.FreeSql 持久化实现
前言 故事是这样开始的: 然后突然又来了句... 扪心自问自从不知道怎么当了 FreeSql 开发群 () 的管理以来, 几乎没有给 FreeSql 做过什么贡献...惭愧惭愧. 借此机会, 似乎可以 ...
- JMeter-临界部分控制器
前言 临界部分控制器根据锁名来控制并发,同一个锁名之下,在同一时间点只能存在一个运行中,适用于控制并发的场景 锁名类型: 锁名为空,认为每个锁为不同的锁 锁名相同,多个锁认为是同一个锁,同一个时间点只 ...
- 常见WAF绕过思路
WAF分类 0x01 云waf 在配置云waf时(通常是CDN包含的waf),DNS需要解析到CDN的ip上去,在请求uri时,数据包就会先经过云waf进行检测,如果通过再将数据包流给主机. 0x02 ...
- html+css+js+Hbuilder开发一款安卓APP,根本不用学Android开发!
我们知道,要做一款安卓APP,咱们得先学安卓开发语言,例如java,前端后端.那么没有这些开发语言基础,咱们怎么做呢?其实现在有比较好的开发方案就是做webAPP,咱们可以用web前端知识构建安卓客户 ...
- 零基础JavaScript编码(三)总结
任务目的 在上一任务基础上继续JavaScript的体验 接触一下JavaScript中的高级选择器 学习JavaScript中的数组对象遍历.读写.排序等操作 学习简单的字符串处理操作 任务描述 参 ...
- 使用nestjs集成grpc具体操作
两个程序中, 提供grpc服务的称为服务端, 调用grpc服务的为客户端, 以下是grpc服务端和客户端的代码编写 1. 创建两个nestjs项目demo1(端口: 3000)和demo2(端 ...
