|
The Economic Value of Rapid Response Time
This paper was published in November, 1982 and was written by:
- Walter J. Doherty, Manager of Systems Performance and Technology Transfer for the Computing Systems Department at IBM's Thomas J. Watson Research Center
- Ahrvind J. Thadani, Advisory Engineer at IBM's General Products Division headquarters, San Jose, California.
Note: Click on any small graphic to see the full size version. |
When a computer and its users interact at a pace that ensures that neither has to wait on the other, productivity soars, the cost of the work done on the computer tumbles, employees get more satisfaction from their work, and its quality tends to improve. Few online computer systems are this well balanced; few executives are aware that such a balance is economically and technically feasible.
In fact, at one time it was thought that a relatively slow response, up to two seconds, was acceptable because the person was thinking about the next task. Research on rapid response time now indicates that this earlier theory is not borne out by the facts: productivity increases in more than direct proportion to a decrease in response time. This brief describes some of this research and the implications for increasing productivity and cutting costs that are among the chief challenges of business today.
Background
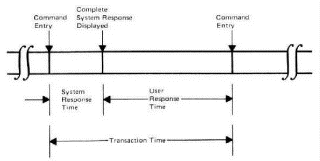
A transaction consists of a user command from a terminal and the system's reply. It is the fundamental unit of work for online system users. It can be divided into two time sequences (Figure 1):
User Response Time. This is the time span between the moment a user receives a complete reply to one command and enters the next command. People often refer to this as think time.
System Response Time. This is the time span between the moment the user enters a command and the moment a complete response is displayed on the terminal. System response time can be further divided into:
- Computer response time, the time the computer actually spends processing and servicing the user's command
- Communication time, the transit time for a command to go to the computer and the time for the reply to come back
When online systems first began to spread throughout the business world, psychologists such as Robert B. Miller, then of IBM's Poughkeepsie laboratory, argued that two seconds was the longest a person should wait for a response from the computer. This interval became a challenge that designers and managers of online systems strove to meet. With those early online systems, this was not easy, but people comforted themselves with the thought that the user was thinking out the next step in the transaction stream while waiting for the computer to reply. Implicit was the belief that users were thinking as rapidly as they could, uninfluenced by how long the system took to respond.
Today's online systems, easily performing many millions of instructions per second with memories far larger than the largest available with the most powerful of IBM's System/360 machines, can now respond to hundreds of users in less than two seconds each. Walter J. Doherty, of IBM's Thomas J. Watson Research Center, was one of the first to see the significance of this rapid improvement in system capability.
He and Richard P. Kelisky, Director of Computing Systems for IBM's Research Division, wrote about their observations in 1979, "...each second of system response degradation leads to a similar degradation added to the user's time for the following [command]. This phenomenon seems to be related to an individual's attention span. The traditional model of a person thinking after each system response appears to be inaccurate. Instead, people seem to have a sequence of actions in mind, contained in a short-term mental memory buffer. Increases in SRT [system response time] seem to disrupt the thought processes, and this may result in having to rethink the sequence of actions to be continued." 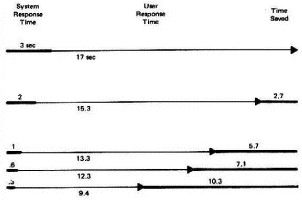 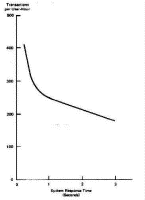
In a pioneering article, inspired by Doherty's work, Arvind J. Thadhani, of IBM's San Jose Laboratory, suggests that the number of transactions a programmer completes in an hour increases noticeably as system response time falls, and rises dramatically once system response time falls below one second. To illustrate (Figure 2), with system response of three seconds, Thadhani found that a programmer executes about 180 transactions per hour. But, bring system response time down to 0.3 seconds and the number of transactions the programmer can execute in an hour jumps to 371, an increase of 106 percent. Put another way, a reduction of 2.7 seconds in system response saves 10.3 seconds of the user's time (Figure 3). This seemingly insignificant time saving is the springboard for sizable increases in productivity.
Benefits
The potential benefits for an organization in providing improved and ultimately subsecond response time for online computing include substantial cost savings, improved individual productivity, shortened project schedules, and a better quality of work. These benefits are inherent in the computing situation; they do not depend on the type of work being done, as will be demonstrated by the diversity of the environments in which they have been demonstrated. Let us look at these benefits in more detail.
Substantial Cost Savings
Saving a few seconds of a person's time here and there may seem to be of little matter, but these seconds accumulate rapidly and build quickly to represent large dollar amounts, large enough to more than justify the cost of installing a larger processor if one is needed to provide more rapid system response. The National Institutes of Health (NIH) provides an outstanding illustration.
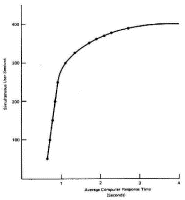
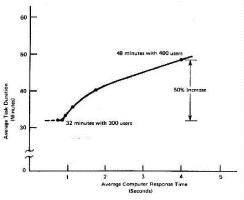
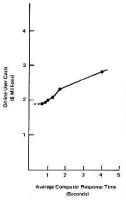
In 1979 their installed system was designed to offer 300 simultaneous users word processing, programming, computing, and remote job entry capabilities, with the response to 80 percent of the transactions being processed in .5 seconds or less. Terminal work sessions, called tasks throughout this brief, averaged 95,000 per month. At its design level, the system had functioned to the satisfaction of its users, but increasing demand was threatening its ability to continue providing an acceptable level of service (Figure 4). The number of simultaneous users had grown to almost 400 and was projected to be 500 in 18 months. With 390 users, the computer response time had deteriorated to an average of 4 seconds and the time to complete an average task had increased 50%, from 32 minutes to 48 minutes (Figure 5). To solve this problem, Joseph D. Naughton, Chief of the NIH Computer Center, proposed to upgrade the processor. He had observed that system deterioration was causing the NIH's users to spend an additional 22,500 hours at their terminals each month, yet they were accomplishing the same number of tasks. The system and user cost for this time were estimated at $900,000 monthly (Figure 6), 15 times the incremental cost of a new processor capable of providing subsecond response time to 500 simultaneous users. For the National Institutes of Health, the cost of upgrading their processor was more than justified by the savings in user time and the restoration of their low task costs.
Improved Individual Productivity
Improved individual productivity is perhaps the most significant benefit to be obtained from rapid response time. After the publication of Thadhani's findings, a number of IBM projects sprang up to confirm his and Doherty's work and determine what effect improved and subsecond response would have on individual productivity. One such study involved the System Products Division (SPD). Among other online applications, SPD laboratories provide high-function graphics to assist their engineers in the physical design of boards, cards and chips, all components in today's computers. The engineers use display terminals specifically designed for the high transaction rates necessary to manipulate graphic images. 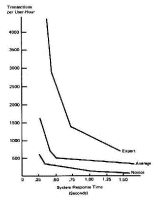
The SPD study measured 75 work sessions of 15 engineers at graphic display terminals as they performed various physical design tasks. Their transaction rate data confirmed Thadhani's curve, (Figure 7). Indeed, it showed considerably more. All users benefited from subsecond response time. In addition, an average, experienced engineer working with subsecond response was as productive as an expert with slower response. A novice's performance became as good as the experienced professional and the productivity of the expert was dramatically enhanced.
SPD conducted an additional series of tests at different laboratories to see whether the actual elapsed time to do a particular task would decrease with subsecond response time and increased transaction rates. For these tests, a group of engineers were acquainted with a card wiring task and then asked to perform it under conditions that made system response time the dominant variable. SPD correlated the elapsed time each engineer needed to wire the card with the system response time being provided during the session.
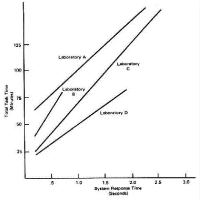
The findings from the four laboratories all showed significant reductions in the time to perform the card wiring task (Figure 8). In laboratory A, task time was reduced by 4.5 minutes for every 0.1 second reduction in system response time. Card wiring time went from 82 minutes to 66 minutes, an improvement of 20%, as response time decreased from 6 seconds to .25 seconds. In laboratory D, task time was reduced 3.6 minutes for every 0.1 second improvement in system response time. Correspondingly, card wiring time went from 36 to 23.5 minutes for a productivity gain of 35 percent when system response time was brought down from 0.6 second to 0.25 seconds.
Shortened Project Schedules
Management at IBM's program development facility in Portsmouth, England, saw the potential in Doherty's and Thadhani's work. In order to make their own test, they provided each programmer in an upcoming project with individual terminals and subsecond system response. The people in this facility measure, as a matter of accepted practice, the output of individual programmers and programming groups and have, over the years, developed rather accurate techniques for estimating the time and resources that a project requires. Therefore, any substantial deviation from one of their estimates can be considered a true variance and valid comparisons of group performance are possible.
Most of the facility's terminals operate over a communication network using comparatively low-speed data communications, rather than through high-speed lines that are connected directly to the system. Each terminal in the test project was connected to the system by high-speed local communication lines. This change brought system response time for the project team down from the 2.3 seconds that was common throughout the facility to 0.84 seconds.
Based on the expected number of function points in the program, a measure that considers both the size and complexity of the program, it was estimated that the project would require 30.8 months of programmer time, spread over 19 weeks. It was actually completed four weeks early and required only 18.7 months of programmer time, 39 percent less than expected.
The team's productivity was also compared with their performance on a similar project six months earlier, using function points as the basis for the comparison. With subsecond system response, the average programmer produced 14.4 function points per month, 58 percent more output than the 9.1 function points per month the average programmer had produced on the earlier project.
Improved Quality
Given a level of service that was much better than they were accustomed to receiving, the programmers on this project explored a wider range of problem solutions than they would normally pursue and increased the scope of their online work. Their professional enthusiasm was justified by subsequent reports from quality assurance. Tests there uncovered only 3.0 trouble reports per hundred function points, compared to 6.9 trouble reports per hundred function points for the team's earlier project.
Broad Applicability
The studies described up to this point involved scientists, engineers, and programmers. A test conducted with administrative professionals indicates that the same benefits can be realized with subsecond response time in data base applications. Component forecasters at IBM's Poughkeepsie facility make frequent reference to an online data base when estimating requirements for electronic parts. The work involves the maintenance of part inventories, bills of materials, and timetables of production and delivery, all tasks similar to those handled by production planners in many organizations.
Five component forecasters were provided subsecond response time for a half-day experiment during which their transaction rate productivity was measured. In their normal working environment they had a system response time of five or more seconds and an average individual productivity rate of 99 transactions per hour. During the test they worked at an average of 336 transactions per hour, a productivity increase of 339%.
Effect on Other Computing
Response time improvements do not lessen the demand for processing; they speed up the performance of tasks by compressing computing into a shorter time span. It follows that as more of these tasks can be performed in the course of a normal business day, the computer will have to handle a significantly increased amount of online work, both batch and transaction processing, if the momentum generated by the faster response is not to be lost.
An example will illustrate. Assume the online entry, batch compilation, and debugging of a program requires the execution of 100 million instructions. Further assume that this is accomplished in one day by an online programmer working with several-second response time and two-hour batch turnaround time. To increase productivity, provide this programmer with subsecond response and a batch turnaround time of one hour. Completion of the program may now be reduced to four hours. Execution of 100 million instructions will now be done in half the time.
Data from the National Institutes of Health and IBM's Portsmouth study support this conclusion. At NIH there was an average of 90 transactions and two batch submissions per work session. This did not vary, even though work session length varied with the computer response time. At Portsmouth, processing time as measured by the amount consumed per function point was approximately constant. Hence, daily processor time consumed by the programmers with subsecond response time went up because each was producing more output.
Thus, to realize the full productivity benefits of improved system response time, the computing center must also be prepared to increase all levels of service. This may be done by expanding the size of the system or by distributing part of the online workload to smaller local systems. The specifics of the solution depend on the organization's total computing environment.
Cost/Benefit Illustration
To bring the potential benefits of rapid system response into perspective, consider an illustration. Based on the data Thadhani published (Figure 2), the average user can complete 180 transactions per hour at three second response time (Figure 9). For simplicity, then, assume a task that involves 180 transactions and takes an hour to complete. Any one user can complete eight such tasks in a day. Further, assume the burdened value of the user's time is $35 per hour. These numbers will be held constant for the purposes of this illustration.
Figure 9. Computation of the Time a User Saves in a Day as System Response Time Improved from 3.0 Seconds to 0.3 Seconds
| System Response Time (Seconds) |
Transactions per Hour* |
Task Time (Minutes) |
Time Saved per Task (Minutes) |
Time Saved per Day (Minutes) |
| 3.0 |
180 |
60.0 |
- |
- |
| 2.0 |
208 |
51.9 |
8.1 |
64.8 |
| 1.0 |
252 |
42.9 |
17.1 |
136.8 |
| 0.6 |
279 |
37.7 |
22.3 |
178.4 |
| 0.3 |
371 |
29.1 |
30.9 |
247.2 |
* Based on Thadani's data (Figure 3)
As system response time improves, the time required to complete a task drops from the original 60 minutes to only 29.1 minutes. Since the average user completes eight such tasks in a day, the maximum amount of time that can be saved is 247.2 minutes, or 4.1 hours. In a month of 21 work days, the value of these saved minutes is $3,028. 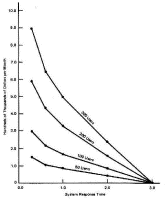
The number of simultaneous users an online system supports varies from organization to organization as does the amount of improvement in response time which is needed. But, in all cases in this illustration (Figure 10), the financial incentive for bringing system response time from three seconds into the subsecond range is substantial, ranging from $150,000 per month when only 50 people use a system at any one time to $908,000 when 300 people use the system simultaneously.
Conclusion
Rapid system response time, ultimately reaching subsecond values and implemented with adequate system support, offers the promise of substantial improvements in user productivity. IBM and others have verified this and demonstrated that lower unit job costs can result. Other organizations may want to pursue studies similar to those mentioned in this brief and go on to implement subsecond system response for their own online systems.
© Copyright IBM Corporation 1982, 1997. All rights reserved.
|


