CoreSight™ Technology
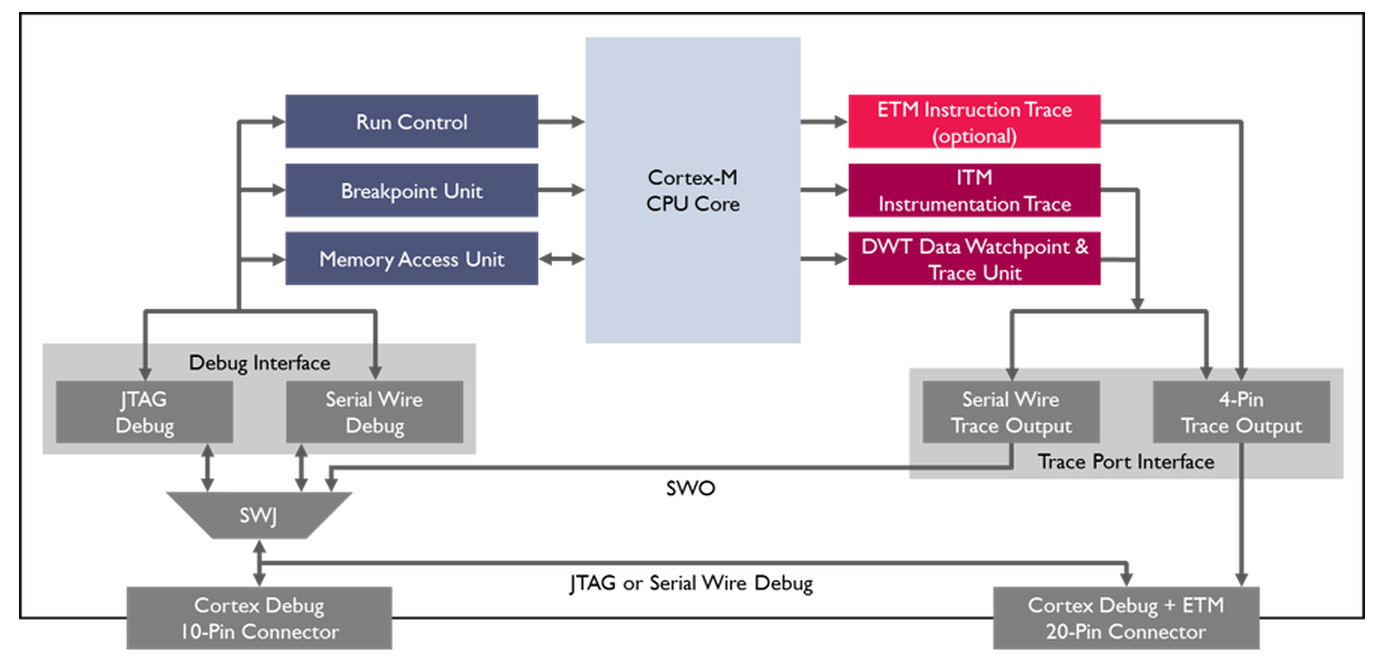
ARM Cortex-M processor-based devices use the ARM CoreSight technology
which introduces powerful new debug and trace capabilities.
Debug features:
- Run Control of the processor allowing you to start and stop programs
- Single Step one source or assembler line
- Set breakpoints while the processor is running
- Read/write memory contents and peripheral registers on-the-fly
- Program internal and external FLASH memory
Trace features:
- Serial Wire Viewer (SWV) provides program counter (PC) sampling, data trace, event trace, and instrumentation trace information
- Instruction (ETM) Trace streamed directly to your PC enabling debugging of historical sequences, software profiling, and code coverage analysis
The CoreSight features are available via JTAG and Serial Wire Debug interfaces using standard low-cost target connectors.

JTAG
JTAG is the industry-standard interface used to download and debug programs on a target processor,
as well as many other functions. It offers a convenient and easy way to connect to devices and is available
on all ARM processor-based devices.
The JTAG interface can be used with Cortex-M based devices to access the CoreSight debug capabilities.
Serial Wire Debug : SWD
The Serial Wire Debug (SWD) mode is an alternative to the standard JTAG interface.
It uses only two pins to provide the same debug functionality as JTAG with no performance penalty,
and introduces data trace capabilities with the Serial Wire Viewer (SWV).
The SWD interface pins can be overlaid with JTAG signals, allowing the standard target connectors to be used:
- TCLK - SWCLK (Serial Wire Clock)
- TMS - SWDIO (Serial Wire Data Input/Output)
- TDO - SWO (Serial Wire Output - required for SWV)
JTAG and SWD modes are fully supported by ULINK2, ULINK-ME, and ULINKpro.
Serial Wire Viewer : SWV
Cortex-M3, Cortex-M4, and Cortex-M7 based devices are able to provide high-speed data trace information
in a number of ways depending on the type of information or analysis you require.
The Serial Wire Serial (SWV) provides real-time data trace information from various sources within a Cortex-M3/M4/M7 device.
It is transmitted via the SWO pin while your system processor continues to run at full speed.
Information is available from the ITM (Instrumentation Trace Macrocell) and DWT (Data Watchpoint and Trace) units, providing:
- PC (Program Counter) sampling
- Event counters that show CPU cycle statistics
- Exception and Interrupt execution with timing statistics
- Trace data - data reads and writes used for timing analysis
- ITM trace information used for simple printf-style debugging
SWV data trace is available via the SWO pin in two output formats:
- UART style (1Mb/s) - supported by ULINK2 and ULINK-ME
- Manchester encoded (100Mb/s) - supported by ULINKpro
 Note
Note
- Data trace via SWV is not available using the JTAG interface.
- SWV is only available when using Serial Wire Debug mode.
Embedded Trace Macrocell
The Embedded Trace Macrocell (ETM) provides high bandwidth instruction trace
via four dedicated trace pins accessible on the 20-pin Cortex Debug + ETM connector.
This enhanced trace capability records a program's execution instruction-by-instruction which can be used for:
- Debugging historical sequences leading up to events of interest
- Software profiling and algorithm optimization
- Code coverage analysis
 Note
Note
- ETM instruction trace is only supported by ULINKpro.
- ETM is optionally available on Cortex-M3, Cortex-M4, and Cortex-M7 processor-based microcontrollers.
- It is not available on Cortex-M0, M0+ and M1.
CoreSight™ Technology的更多相关文章
- 如何在 arm 官网上找到合适的手册
http://infocenter.arm.com/help/advanced/help.jsp 在这里输入合适的版号即可 这样就可以不用去 CSDN 了 100000_0000_00_EN - AR ...
- How Will Java Technology Change My Life?
How Will Java Technology Change My Life? We can't promise you fame, fortune, or even a job if you le ...
- What Can Java Technology Do?
What Can Java Technology Do? The general-purpose(多用途的), high-level Java programming language is a po ...
- 【译】About the Java Technology
About the Java Technology Java technology is both a programming language and a platform. The Java Pr ...
- Process Kill Technology && Process Protection Against In Linux
目录 . 引言 . Kill Process By Kill Command && SIGNAL . Kill Process By Resource Limits . Kill Pr ...
- Overview and Evaluation of Bluetooth Low Energy: An Emerging Low-Power Wireless Technology
转自:http://www.mdpi.com/1424-8220/12/9/11734/htm Sensors 2012, 12(9), 11734-11753; doi:10.3390/s12091 ...
- EBS Technology Codelevel Checker (ETCC)
ETCC提供了两个脚本,用来帮助用户检测 E-Business Suite Release 12.2数据库和中间层是否安装了必须的补丁.官方强烈推荐使用. 1.checkDBpatch.sh 这个脚本 ...
- Toward Scalable Systems for Big Data Analytics: A Technology Tutorial (I - III)
ABSTRACT Recent technological advancement have led to a deluge of data from distinctive domains (e.g ...
- iOS Technology Overview_Introduction
关于iOS技术 iOS是运行在iPad,iPhone和iPod touch设备上的操作系统.这个操作系统管理着这些设备的硬件并且提供了实现原生APP所需的技术.这个操作系统也附带许多系统APP,例如P ...
随机推荐
- 01 uni-app框架学习:项目创建及底部导航栏tabBar配置
1.创建一个项目类型选择uniapp 2. pages里新建3个页面如下 3.在pages.json中配置底部导航tabBar 效果展示:
- Expression Tree Build
The structure of Expression Tree is a binary tree to evaluate certain expressions.All leaves of the ...
- mysql5.7执行sql语句报错:In aggregated query without GROUP BY, expression #1 of SELECT list contains nonagg
mysql5.7执行sql语句报错:In aggregated query without GROUP BY, expression #1 of SELECT list contains nonagg ...
- 远程不能访问CentOS的tomcat 8080端口
一般认为是CentOS的iptabls防火墙的问题,方法如下: ps -ef | grep tomcat ker 4399 1 6 21:46 pts/1 00:00:01 /usr/java/jdk ...
- 使用css实现移动端导航条滚动
<div class="tab"> <div class="table-item"> <span class="tab- ...
- 【linux】shell中命令替换$(cmd)和符号`cmd`
来源:https://zhidao.baidu.com/question/485498670.html 作用: $(cmd)和`cmd`的作用是相同的,在执行一条命令时,会先将其中的 ``,或者是$( ...
- Windows下安装Python requests模块
在使用自己写的或者别人的python小工具时可能会出现类似ImportError: No module named Requests的问题: D:\tool\python\fuzz>Fuzz.p ...
- 【AtCoder】ARC085
C - HSI 题解 \(E = 1900 * (N - M) + 100 * M + \frac{1}{2^{M}} E\) \(E = 2^{M}(1900 * (N - M) + 100 * M ...
- Mysql介绍,与将脚本导入新数据库
一:介绍 1.介绍 Mysql是最流行的关系型数据库管理系统,在WEB应用方面MySQL是最好的RDBMS(Relational Database Management System:关系数据库管理系 ...
- js数组遍历some、foreach、map、filter、every、lastIndexOf、indexOf对比
1. [...].some(ck)函数 对数组中每个元素执行一次ck函数,知道某个元素返回true,则直接返回true.如果都返回false,则返回false 检查整个数组中是否有满足ck函数的元素. ...
