matplotlib-折线图、散点图
(一)折线图小结
1、设置图片大小(想要一个高清无码大图)
# 图大小

plt.figure(figsize=(20, 8), dpi=80)
2、保存到本地
# 设置图片大小

plt.figure(figsize=(20, 8), dpi=180)

# 绘制图形,plot折线图

plt.plot(x, y)

# 保存图形

plt.savefig("14.png")

# 展示图形

plt.show()
3、描述信息,比如x轴和y轴表示什么,这个图表示什么
# 设置x轴的刻度

plt.xticks(range(0,25))

# 设置y轴的刻度

max_y=max(y)

min_y=min(y)

yticks_labels=list(range(min_y,max_y+1))[::2]

plt.yticks(yticks_labels)
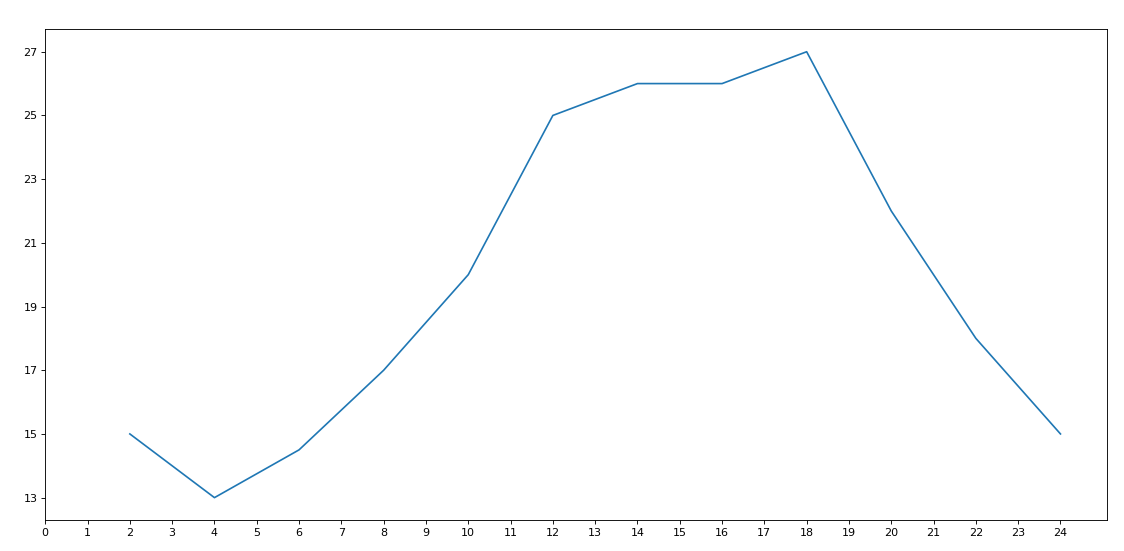
4、调整x或者y的刻度的间距
# x轴线刻度

_xticks_labels = ["10时{}分".format(i) for i in range(1, 61)]

_xticks_labels += ["11时{}分".format(i) for i in range(1, 61)]

# print(_xticks_labels)

# plt.xticks(list(x)[::10],_xticks_labels[::10],rotation=30,fontproperties=my_font)

plt.xticks(list(x)[::10], _xticks_labels[::10], rotation=30)
# 设置x轴的label

plt.xlabel("时间",fontproperties=my_font)

# 设置y轴的label

plt.ylabel("温度(℃)",fontproperties=my_font)

# 设置标题

plt.title("10点到12点每分钟的时间变化情况",fontproperties=my_font)
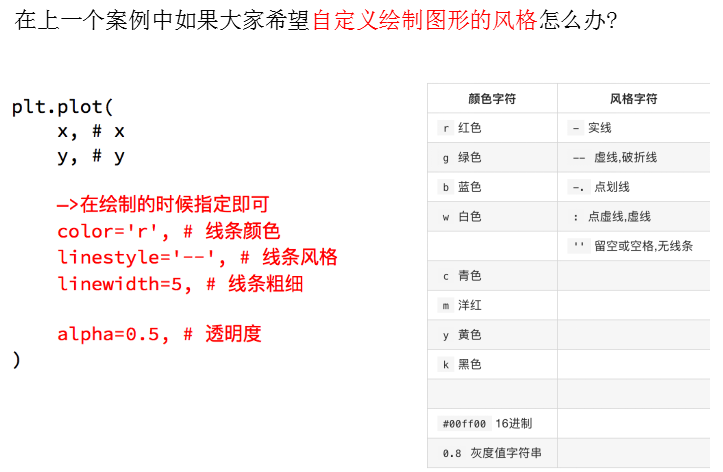
5、线条的样式(比如颜色,透明度等)
6、标记出特殊的点(比如告诉别人最高点和最低点在哪里)
plt.annotate(

    '这里转折',  # 显示字符串

    fontproperties='SimHei',  # 中文字体

    xy=(3, 4),  # 箭头位置

    xytext=(3.5, 4.5),  # 文本位置

    arrowprops=dict(facecolor='red', shrink=0.1, width=2)  # facecolor:箭头颜色;shrink:箭头的起始和结束位置两侧的空白大小;width:箭头宽度

)
7、给图片添加一个水印(防伪,防止盗用)
# 水印  任意文本的x,y坐标值(15,3)(可用latex语法),旋转角度

plt.text(15, 3, '我的花花世界', fontproperties='SimHei', fontsize='60', rotation=45,

         alpha=0.4)
8、设置字体
# 设置全局字体

# fc-list查看字体

font = {'family': 'Microsoft Yahei',

'weight': 'bold',

}

matplotlib.rc("font", **font)

# 设置局部字体

my_font = font_manager.FontProperties(fname="C:\Windows\Fonts\STSONG.TTF")

plt.xticks(list(x)[::10],_xticks_labels[::10],rotation=30,fontproperties=my_font)
import matplotlib #载入matplotlib完整库

matplotlib.rcParams['font.family']='Microsoft Yahei' #字体,改为微软雅黑,默认 sans-serif

matplotlib.rcParams['font.size']=32 #字体大小,整数字号,默认10
9、随机种子:10和9不一样,随便写
random.seed(10)  # 设置随机种子,让不同的随机得到相同的结果

y = [random.randint(20, 35) for i in range(120)]
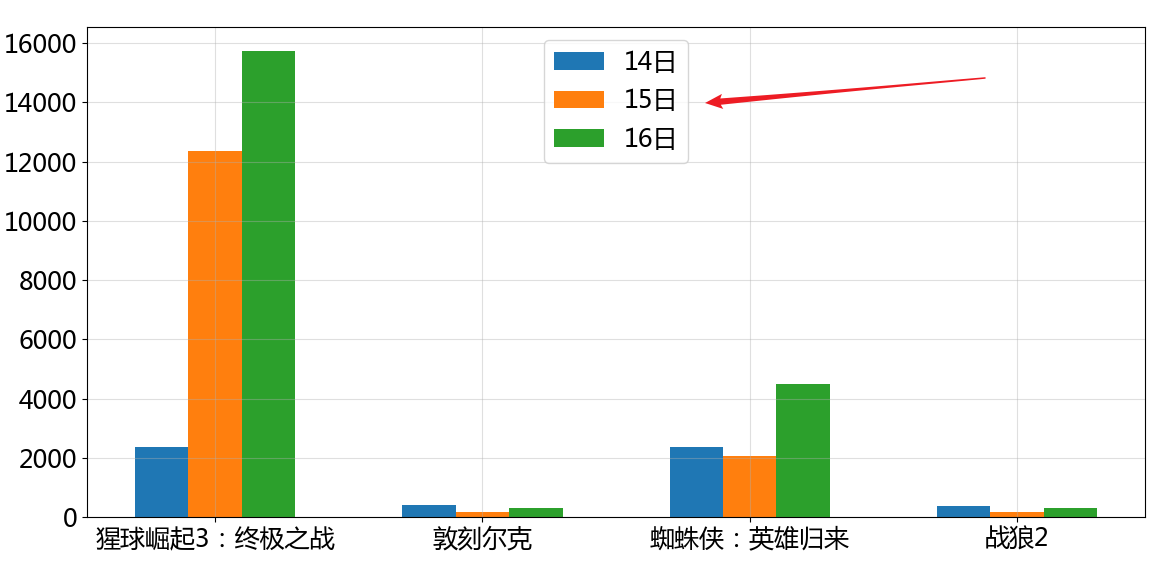
10、添加图例:
# coding=utf-8

from matplotlib import pyplot as plt

import matplotlib  # 载入matplotlib完整库

# from matplotlib import font_manager

matplotlib.rcParams['font.family'] = 'Microsoft Yahei'  # 字体,改为微软雅黑,默认 sans-serif

matplotlib.rcParams['font.size'] = 18  # 字体大小,整数字号,默认10

# my_font = font_manager.FontProperties(fname="/System/Library/Fonts/PingFang.ttc",size="xx-small")

a = ["猩球崛起3:终极之战", "敦刻尔克", "蜘蛛侠:英雄归来", "战狼2"]

b_16 = [15746, 312, 4497, 319]

b_15 = [12357, 156, 2045, 168]

b_14 = [2358, 399, 2358, 362]

bar_width = 0.2

_x_14 = range(4)

_x_15 = [i + bar_width for i in _x_14]

_x_16 = [i + bar_width * 2 for i in _x_14]

plt.bar(_x_14, b_14, width=bar_width, label="14日")

plt.bar(_x_15, b_15, width=bar_width, label="15日")

plt.bar(_x_16, b_16, width=bar_width, label="16日")

plt.xticks(_x_15, a)

# 添加居中图例

plt.legend(loc=9)

plt.grid(alpha=0.4)

plt.show()
输出
其他:
#### 1.数据分析是什么

  - 从大量的数据中寻找规律和结论,为后续的决策提供依据

#### 2.数据分析的流程

  - 问题 ---》准备数据---》分析数据---》得出结存---》图形化的展示出来

#### 3.matplotlib如何绘制折线图,和散点图,折线图和散点图分别能表示的什么

  - x是所有的坐标的x值的一个列表(的可迭代对象)

  - y是所有的坐标的y值的一个列表(的可迭代对象)

  - pyplot.plot(x,y) #绘制折线图 (变化)

  - pyplot.scatter(x,y) #绘制散点图  (关系和联系,呈现离群点)

#### 4.matplotlib如何显示中文

  ```python

  from matplotlib import font_manager

  my_font = font_manager.FontProperties(fname="")

  pyplot.xticks(fontproperties=my_font)

  pyplot.legend(prop=my_font)

  ```

#### 5.matplotlib如何在x轴和y轴上显示我们自定义的内容

  - 当刻度太稀疏或者是太密集

    - pyplot.xticks()

  - x轴和y轴显示字符串

    - pyplot.xticks([1,2,3,4,],["str1","str2","str3","str4"])

#### 6.matplotlib如何设置图片的大小和保存图片到本地

  - pyplot.figure(figsize = (20,8),dpi=80)

  - pyplot.savefig("./a.png")

#### 7.设置图例

  - 每次绘制的时候需要给label这个参数传值

  - pyplot.legend(loc,prop=my_font)

#### 8.设置网格

  - pyplot.grid(alpha=0.4)
(二)代码演示
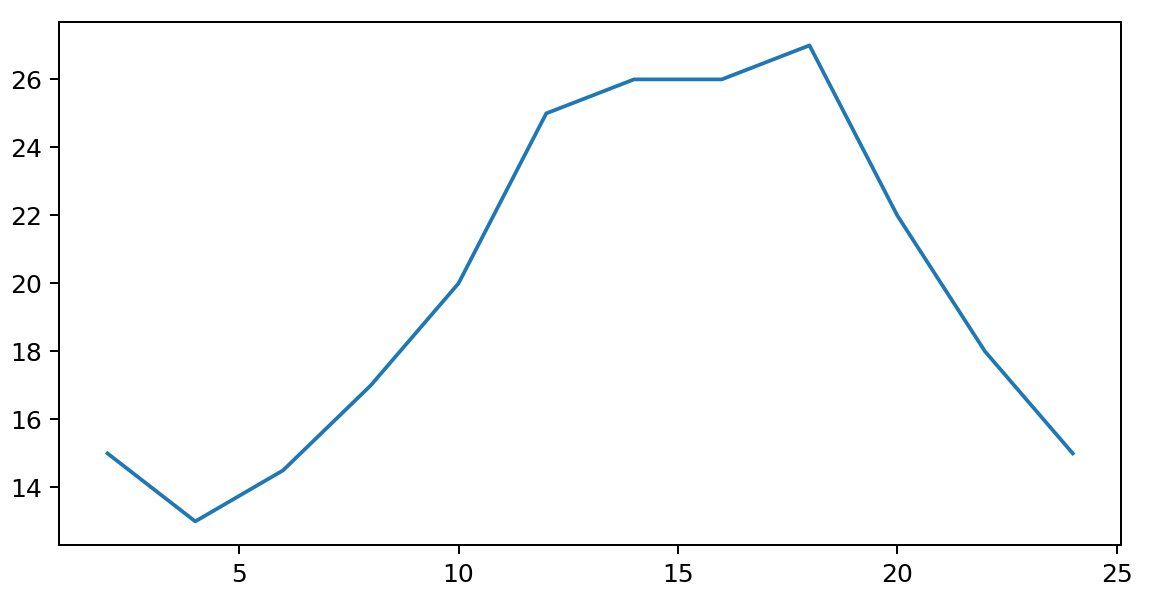
1、plot绘制折线图
from matplotlib import pyplot as plt

x = range(2, 26, 2)

y = [15, 13, 14.5, 17, 20, 25, 26, 26, 27, 22, 18, 15]

# 设置图片大小

plt.figure(figsize=(20, 8), dpi=180)

# 绘制图形,plot折线图

plt.plot(x, y)

# 保存图形

plt.savefig("14.png")

# 展示图形

plt.show()
2、plot图片的相关设置
from matplotlib import pyplot as plt

x = range(2, 26, 2)

y = [15, 13, 14.5, 17, 20, 25, 26, 26, 27, 22, 18, 15]

# 设置图片大小

plt.figure(figsize=(20, 8), dpi=80)

# 绘制图形,plot折线图

plt.plot(x, y)

# 设置x轴的刻度

plt.xticks(range(0, 25))

# 设置y轴的刻度

max_y = max(y)

min_y = min(y)

yticks_labels = list(range(min_y, max_y + 1))[::2]

plt.yticks(yticks_labels)

plt.show()
3、plot相关设置2
import matplotlib

from matplotlib import pyplot as plt

import random

from matplotlib import font_manager

# 设置局部字体

my_font = font_manager.FontProperties(fname="C:\Windows\Fonts\STSONG.TTF")

# 设置全局字体

# fc-list查看字体

font = {'family': 'Microsoft Yahei',

        'weight': 'bold',

        }

matplotlib.rc("font", **font)

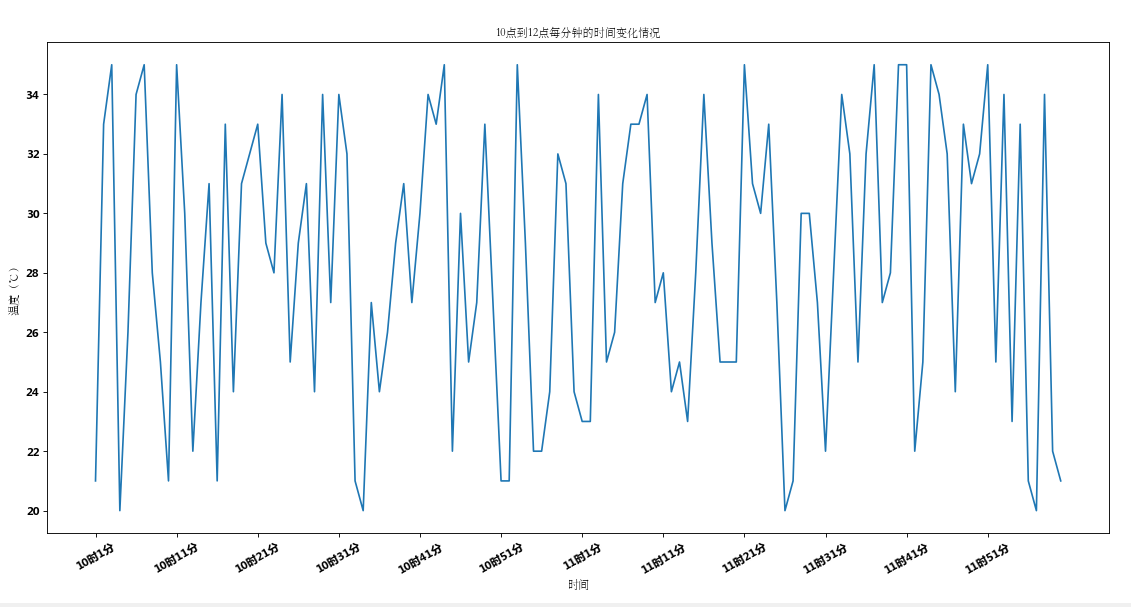
x = range(120)

random.seed(10)  # 设置随机种子,让不同的随机得到相同的结果

y = [random.randint(20, 35) for i in range(120)]

# 图大小

plt.figure(figsize=(20, 8), dpi=80)

# 绘制折线图

plt.plot(x, y)

# x轴线刻度

_xticks_labels = ["10时{}分".format(i) for i in range(1, 61)]

_xticks_labels += ["11时{}分".format(i) for i in range(1, 61)]

# print(_xticks_labels)

# plt.xticks(list(x)[::10],_xticks_labels[::10],rotation=30,fontproperties=my_font)

plt.xticks(list(x)[::10], _xticks_labels[::10], rotation=30)

# 设置x轴的label

plt.xlabel("时间",fontproperties=my_font)

# 设置y轴的label

plt.ylabel("温度(℃)",fontproperties=my_font)

# 设置标题

plt.title("10点到12点每分钟的时间变化情况",fontproperties=my_font)

plt.show()
4、折线图-添加图例、线条样式等
from matplotlib import pyplot as plt

from matplotlib import font_manager

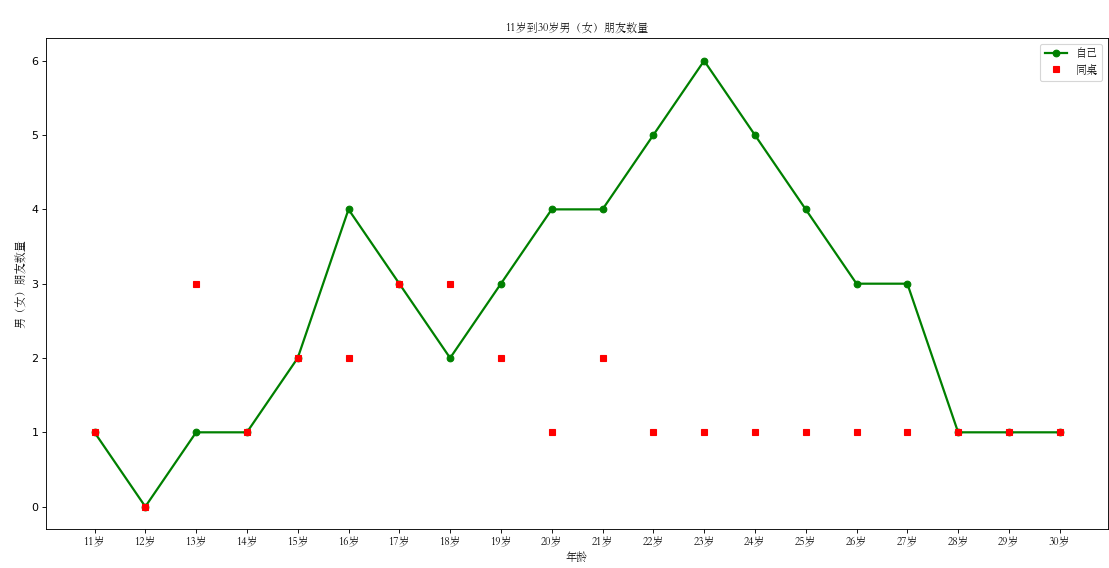
a = [1, 0, 1, 1, 2, 4, 3, 2, 3, 4, 4, 5, 6, 5, 4, 3, 3, 1, 1, 1]

b = [1, 0, 3, 1, 2, 2, 3, 3, 2, 1, 2, 1, 1, 1, 1, 1, 1, 1, 1, 1]

x = [i for i in range(11, 31)]

y = a

y_1 = b

# 设置局部字体

my_font = font_manager.FontProperties(fname="C:\Windows\Fonts\STSONG.TTF")

# 图大小

plt.figure(figsize=(20, 8), dpi=80)

# 折线图

plt.plot(x, y, "go-", label="自己", linewidth=2)

plt.plot(x, y_1, "rs", label="同桌")

# 添加图例,label和legend要同时使用。legend添加字体用prop=字体

plt.legend(prop=my_font, loc="best")

# 设置x轴刻度

_xticks_labels = ["{}岁".format(i) for i in range(11, 31)]

plt.xticks(x, _xticks_labels, fontproperties=my_font)

# x轴标签

plt.xlabel("年龄", fontproperties=my_font)

# y轴标签

plt.ylabel("男(女)朋友数量", fontproperties=my_font)

# 标题

plt.title("11岁到30岁男(女)朋友数量", fontproperties=my_font)

# 展示图形

plt.show()
延伸:
区别各个常用图形
折线图:以折线的上升或下降来表示统计数量的增减变化的统计图
特点:能够显示数据的变化趋势,反映事物的变化情况。(变化)
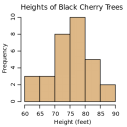
直方图:由一系列高度不等的纵向条纹或线段表示数据分布的情况。
一般用横轴表示数据范围,纵轴表示分布情况。
特点:绘制连续性的数据,展示一组或者多组数据的分布状况(统计)
条形图:排列在工作表的列或行中的数据可以绘制到条形图中。
特点:绘制连离散的数据,能够一眼看出各个数据的大小,比较数据之间的差别。(统计)

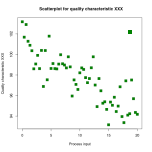
散点图:用两组数据构成多个坐标点,考察坐标点的分布,判断两变量
之间是否存在某种关联或总结坐标点的分布模式。
特点:判断变量之间是否存在数量关联趋势,展示离群点(分布规律)
更多图形
https://matplotlib.org/gallery/index.html
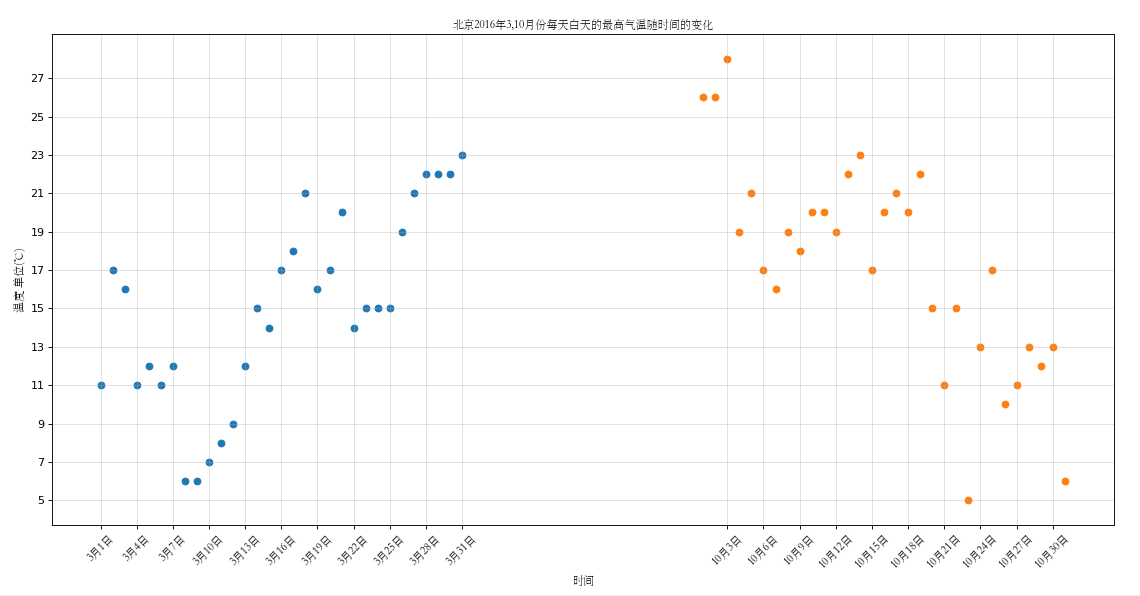
散点图:代码
# coding=utf-8

from matplotlib import pyplot as plt

from matplotlib import font_manager

my_font = font_manager.FontProperties(fname="C:\Windows\Fonts\STSONG.TTF")

month_3 = [11,17,16,11,12,11,12,6,6,7,8,9,12,15,14,17,18,21,16,17,20,14,15,15,15,19,21,22,22,22,23]

month_10 = [26,26,28,19,21,17,16,19,18,20,20,19,22,23,17,20,21,20,22,15,11,15,5,13,17,10,11,13,12,13,6]

x_3 = range(0,31)

x_10 = range(50,81)

#设置图形的大小

plt.figure(figsize=(20,8),dpi=80)

#绘制散点图

plt.scatter(x_3,month_3) #3月

plt.scatter(x_10,month_10) #10月

#实现x轴的刻度的展示

_x = list(x_3) + list(x_10)

_xtick_labels =["3月{}日".format(i+1) for i in x_3]

_xtick_labels+=["10月{}日".format(i+1) for i in x_3]

plt.xticks(_x[::3],_xtick_labels[::3],fontproperties=my_font,rotation=45)

#设置y轴的刻度

max_y = max([max(month_3),max(month_10)])

min_y = min([min(month_3),min(month_10)])

plt.yticks(range(min_y,max_y+1,2))

#实现绘制网格

plt.grid(alpha=0.4)

#设置labels和title

plt.xlabel("时间",fontproperties=my_font)

plt.ylabel("温度 单位(℃)",fontproperties=my_font)

plt.title("北京2016年3,10月份每天白天的最高气温随时间的变化",fontproperties=my_font)

plt.show()
matplotlib-折线图、散点图的更多相关文章
- 练习: bs4 简单爬取 + matplotlib 折线图显示 (关键词,职位数量、起薪)
要看一种技术在本地的流行程度,最简单的就是找招聘网站按关键词搜索. 比如今天查到的职位数量是vue 1296个,react 1204个,angular 721个.国际上比较流行的是react,本地市场 ...
- python matplotlib 折线图
1.绘制折线图,去上和右边框,显示中文 import numpy as np import matplotlib.pyplot as plt #plt.style.use('default') #pl ...
- jqPlot图表插件学习之折线图-散点图-series属性
一.准备工作 首先我们需要到官网下载所需的文件: 官网下载(笔者选择的是jquery.jqplot.1.0.8r1250.zip这个版本) 然后读者需要根据自己的情况新建一个项目并且按照如下的方式加载 ...
- matplotlib折线图
绘制折线图:参考https://baijiahao.baidu.com/s?id=1608586625622704613 (3)近10年GDP变化的曲线图,及三次产业GDP变化的曲 ...
- matplotlib 折线图
1.基本要点 # 导入模块 from matplotlib import pyplot as plt # x轴数据 x = range(2, 26, 2) # y轴数据 y = [15, 13, 14 ...
- Python使用matplotlib模块绘制多条折线图、散点图
用matplotlib模块 #!usr/bin/env python #encoding:utf-8 ''' __Author__:沂水寒城 功能:折线图.散点图测试 ''' import rando ...
- Python交互图表可视化Bokeh:4. 折线图| 面积图
折线图与面积图 ① 单线图.多线图② 面积图.堆叠面积图 1. 折线图--单线图 import numpy as np import pandas as pd import matplotlib.py ...
- 用matplotlib.pyplot画简单的折线图,直方图,散点图
#coding=utf-8 """ 用matplotlib.pyplot画简单的折线图,直方图,散点图 """ import matplot ...
- 06. Matplotlib 2 |折线图| 柱状图| 堆叠图| 面积图| 填图| 饼图| 直方图| 散点图| 极坐标| 图箱型图
1.基本图表绘制 plt.plot() 图表类别:线形图.柱状图.密度图,以横纵坐标两个维度为主同时可延展出多种其他图表样式 plt.plot(kind='line', ax=None, figsiz ...
- matplotlib常见绘图基础代码小结:折线图、散点图、条形图、直方图、饼图
一.折线图 二.散点图 三.条形图 四.直方图 五.饼图 一.折线图折线图用于显示随时间或有序类别的变化趋势 from matplotlib import pyplot as plt x = rang ...
随机推荐
- 创建SQL语句_面试
创建一个表:create table if not exists Teachaers(tea_id integer primary key autoincrement,tea_name text,t ...
- delphi中设置listview行高的方法
第一步.在form中放置一个ImageList: 第二步.将ListView的SmallImages设置为第一步中放置的ImageList: 第三部.将imageList的height设置成自己需要的 ...
- 对ChemDraw Professional 16.0你了解多少
ChemDraw Professional 16.0组件为科学家提供了最新的科学智能应用程序组件,绘制化学结构图和分析生物路径图. ChemDraw Professional 16.0 ChemDr ...
- [转] CSocket 和CAsyncSocket类介绍
微软的MFC把复杂的WinSock API函数封装到类里,这使得编写网络应用程序更容易. CAsyncSocket类逐个封装了WinSock API,为高级网络程序员提供了更加有力而灵活的方法.这个类 ...
- Effective C++ Item 13 Use object to manage resources
1. Always use object to manage resource! If you delete a pointer or release a handler manually by yo ...
- divmod()
divmod() 接收两个数值,然后以元组的形式返回这两个数值的商和余数 In [1]: divmod(5, 2) Out[1]: (2, 1) In [2]: divmod(10, 7) Out[2 ...
- (使用lua++)Lua脚本和C++交互(四)
上一篇中,你已经可以在Lua里面用C++的函数了,那么咱们再增加一点难度,比如,我有一个CTest对象,要作为一个参数,传输给func_Add()执行,怎么办?很简单,如果你对上面的代码仔细阅读,你会 ...
- BNU4208:Bubble sort
冒泡排序(BubbleSort)的基本概念是:依次比较相邻的两个数,将小数放在前面,大数放在后面.即首先比较第1个和第2个数,将小数放前,大数放后.然后比较第2个数和第3个数,将小数放前,大数放后,如 ...
- cookie带来的致命危险
1.危险:当记录了过多的cookie时,可能导致http header过大,进而导致服务器端发生错误,导致用户无法打开页面. 2.cookie限制: 各浏览器对单cookie键的限制基本都在4kb左右 ...
- setTimeout原来有这种用途
setTimeout有两个参数,第一个是需要执行的函数,第二个是将该函数推入UI队列的时间. 需要注意的两点: 1.第二个参数中设置的时间,是从执行setTimeout开始计算,而不是从整个函数执行完 ...
