Prometheus+Grafana监控部署实践
参考文档:
- Prometheus github:https://github.com/prometheus
- grafana github:https://github.com/grafana/grafana
- Prometheus getting_started:https://prometheus.io/docs/prometheus/latest/getting_started/
- Prometheus node_exporter:https://github.com/prometheus/node_exporter
- Prometheus部署(docker,optional):https://prometheus.io/docs/prometheus/latest/installation/
- Prometheus配置文件详解:https://prometheus.io/docs/prometheus/latest/configuration/configuration/
- grafana 部署:http://docs.grafana.org/installation/rpm/
一.环境
1. 拓扑
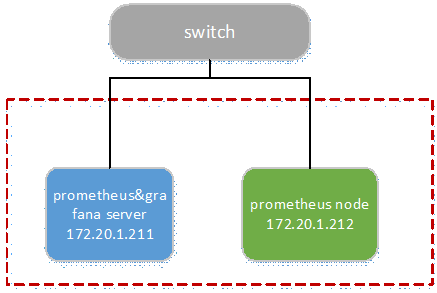
2. 节点
|
Node |
OS |
Hostname |
IP |
Remark |
|
prometheus& grafana server |
centos 7.4 |
prometheus |
172.20.1.211 |
|
|
prometheus node |
centos 7.4 |
node1 |
172.20.1.212 |
3. 版本(截止20171130)
|
Soft/Node |
Version |
Download |
|
prometheus |
2.0.0 |
|
|
node_exporter |
v0.15.1 |
|
|
grafana |
4.6.2-1 |
https://s3-us-west-2.amazonaws.com/grafana-releases/release/grafana-4.6.2-1.x86_64.rpm |
二.部署prometheus
在prometheus& grafana server节点部署prometheus服务。
1. 下载&部署
# 下载
[root@prometheus src]# cd /usr/local/src/
[root@prometheus src]# wget https://github.com/prometheus/prometheus/releases/download/v2.0.0/prometheus-2.0.0.linux-amd64.tar.gz # 部署到/usr/local/目录
# promethus不用编译安装,解压目录中有配置文件与启动文件
[root@prometheus src]# tar -zxvf prometheus-2.0.0.linux-amd64.tar.gz -C /usr/local/
[root@prometheus src]# cd /usr/local/
[root@prometheus local]# mv prometheus-2.0.0.linux-amd64/ prometheus/ # 验证
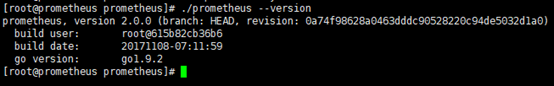
[root@prometheus local]# cd prometheus/
[root@prometheus prometheus]# ./prometheus --version
2. 配置文件
# 解压目录中的prometheus.yml

# 简单验证,主要配置采用默认文件配置,有修改/新增处用红色标示

[root@prometheus prometheus]# vim prometheus.yml

# 全局配置

global:

  scrape_interval:     15s # 设置抓取(pull)时间间隔,默认是1m

  evaluation_interval: 15s # 设置rules评估时间间隔,默认是1m

  # scrape_timeout is set to the global default (10s).

# 告警管理配置,暂未使用,默认配置

alerting:

  alertmanagers:

  - static_configs:

    - targets:

      # - alertmanager:9093

# 加载rules,并根据设置的时间间隔定期评估,暂未使用,默认配置

rule_files:

  # - "first_rules.yml"

  # - "second_rules.yml"

# 抓取(pull),即监控目标配置

# 默认只有主机本身的监控配置

scrape_configs:

  # 监控目标的label(这里的监控目标只是一个metric,而不是指某特定主机,可以在特定主机取多个监控目标),在抓取的每条时间序列表中都会添加此label

  - job_name: 'prometheus'

    # metrics_path defaults to '/metrics'

    # scheme defaults to 'http'.

    # 可覆盖全局配置设置的抓取间隔,由15秒重写成5秒。

    scrape_interval: 5s

    # 静态指定监控目标,暂不涉及使用一些服务发现机制发现目标

static_configs:

      - targets: ['localhost:9090']

        # (opentional)再添加一个label,标识了监控目标的主机

labels:

          instance: prometheus

  - job_name: 'linux'

    scrape_interval: 10s

static_configs:

  # 采用node_exporter默认开放的端口

      - targets: ['172.20.1.212:9100']

labels:

          instance: node1
3. 设置用户
# 添加用户,后期用此账号启动服务

[root@prometheus prom etheus]# groupadd prometheus

[root@prometheus prometheus]# useradd -g prometheus -s /sbin/nologin prometheus

# 赋权

[root@prometheus prometheus]# cd ~

[root@prometheus ~]# chown -R prometheus:prometheus /usr/local/prometheus/

# 创建prometheus运行数据目录

[root@prometheus ~]# mkdir -p /var/lib/prometheus

[root@prometheus ~]# chown -R prometheus:prometheus /var/lib/prometheus/
4. 设置开机启动
[root@prometheus ~]# touch /usr/lib/systemd/system/prometheus.service

[root@prometheus ~]# chown prometheus:prometheus /usr/lib/systemd/system/prometheus.service

[root@prometheus ~]# vim /usr/lib/systemd/system/prometheus.service

[Unit]

Description=Prometheus

Documentation=https://prometheus.io/

After=network.target

[Service]

# Type设置为notify时,服务会不断重启

Type=simple

User=prometheus

# --storage.tsdb.path是可选项,默认数据目录在运行目录的./dada目录中

ExecStart=/usr/local/prometheus/prometheus --config.file=/usr/local/prometheus/prometheus.yml --storage.tsdb.path=/var/lib/prometheus

Restart=on-failure

[Install]

WantedBy=multi-user.target

# 设置开机启动

[root@prometheus ~]# systemctl enable Prometheus

[root@prometheus ~]# systemctl start prometheus
5. 设置iptables
[root@prometheus ~]# vim /etc/sysconfig/iptables

-A INPUT -p tcp -m state --state NEW -m tcp --dport 9090 -j ACCEPT

[root@prometheus ~]# service iptables restart
6. 启动并验证
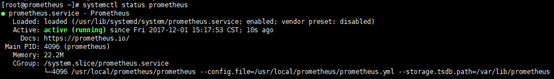
1)查看服务状态
[root@prometheus ~]# systemctl status prometheus
[root@prometheus ~]# netstat -tunlp | grep 9090

2)web ui
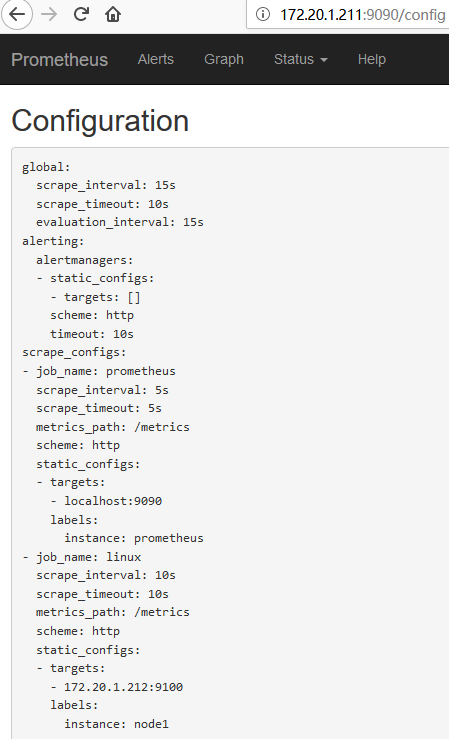
Prometheus自带有简单的UI,http://172.20.1.211:9090
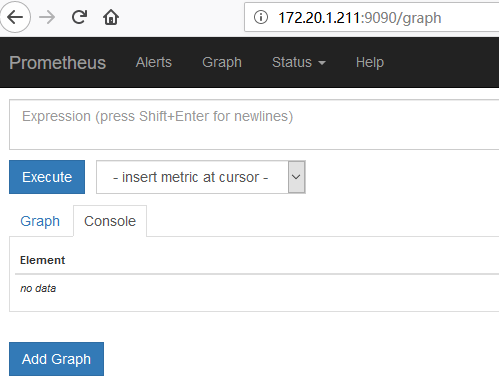
在Status菜单下,Configuration,Rule,Targets等,
Statu-->Configuration展示prometheus.yml的配置,如下:
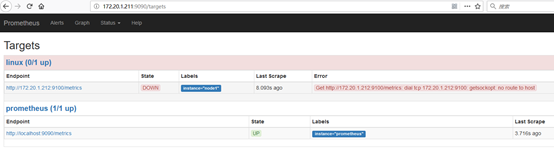
Statu-->Targets展示监控具体的监控目标,这里监控目标"linux"暂未设置node_exporter,未scrape数据,如下:
7. 绘图
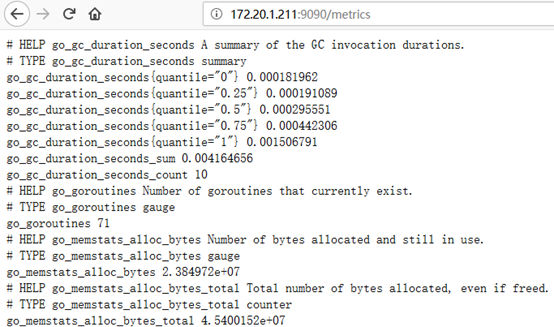
访问:http://172.20.1.211:9090/metrics,查看从exporter具体能抓到的数据,如下:
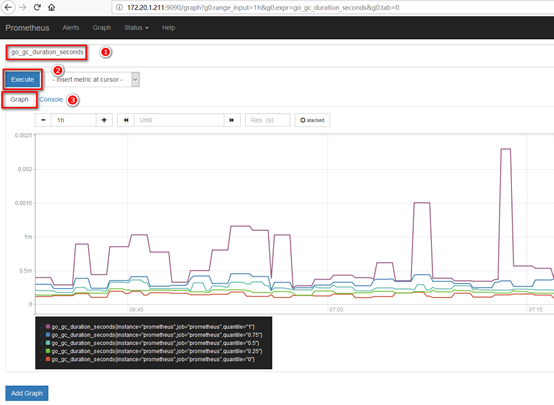
访问:http://172.20.1.211:9090,在输入框中任意输入1个exporter能抓取得值,点击"Execute"与"Execute"按钮,即可见相应抓取数据的图形,同时可对时间与unit做调整,如下:
三.部署node_exporter
Node_exporter收集机器的系统数据,这里采用prometheus官方提供的exporter,除node_exporter外,官方还提供consul,memcached,haproxy,mysqld等exporter,具体可查看官网。
这里在prometheus node节点部署相关服务。
1. 下载&部署
# 下载

[root@node1 ~]# cd /usr/local/src/

[root@node1 src]# wget https://github.com/prometheus/node_exporter/releases/download/v0.15.1/node_exporter-0.15.1.linux-amd64.tar.gz

# 部署

[root@node1 src]# tar -zxvf node_exporter-0.15.1.linux-amd64.tar.gz -C /usr/local/

[root@node1 src]# cd /usr/local/

[root@node1 local]# mv node_exporter-0.15.1.linux-amd64/ node_exporter/
2. 设置用户
[root@node1 ~]# groupadd prometheus

[root@node1 ~]# useradd -g prometheus -s /sbin/nologin prometheus

[root@node1 ~]# chown -R prometheus:prometheus /usr/local/node_exporter/
3. 设置开机启动
[root@node1 ~]# vim /usr/lib/systemd/system/node_exporter.service

[Unit]

Description=node_exporter

Documentation=https://prometheus.io/

After=network.target

[Service]

Type=simple

User=prometheus

ExecStart=/usr/local/node_exporter/node_exporter

Restart=on-failure

[Install]

WantedBy=multi-user.target

[root@node1 ~]# systemctl enable node_exporter

[root@node1 ~]# systemctl start node_exporter
4. 设置iptables
# 官方node_exporter默认使用9100端口

[root@node1 ~]# vim /etc/sysconfig/iptables

-A INPUT -p tcp -m state --state NEW -m tcp --dport 9100 -j ACCEPT

[root@node1 ~]# service iptables restart
5. 验证
访问:http://172.20.1.211:9090,可见node1主机已经可被监控,如下:

四.部署grafana
在prometheus& grafana server节点部署grafana服务。
1. 下载&安装
# 下载

[root@prometheus ~]# cd /usr/local/src/

[root@prometheus src]# wget https://s3-us-west-2.amazonaws.com/grafana-releases/release/grafana-4.6.2-1.x86_64.rpm

# 安装

[root@prometheus src]# yum localinstall grafana-4.6.2-1.x86_64.rpm
2. 配置文件
配置文件位于/etc/grafana/grafana.ini,这里暂时保持默认配置即可。
3. 设置开机启动
[root@prometheus src]# systemctl enable grafana-server

[root@prometheus src]# systemctl start grafana-server
4. 设置iptables
# grafana-server默认使用3000端口

[root@prometheus src]# vim /etc/sysconfig/iptables

-A INPUT -p tcp -m state --state NEW -m tcp --dport 3000 -j ACCEPT

[root@prometheus src]# service iptables restart
5. 添加数据源
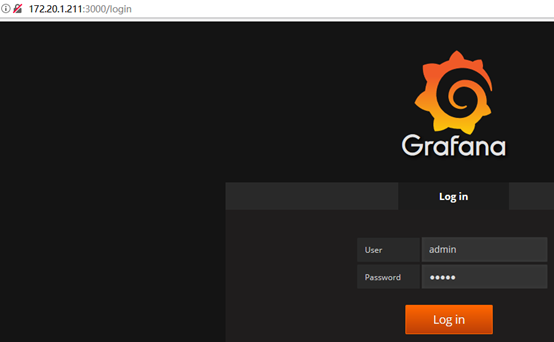
1)登陆
访问:http://172.20.1.211:3000,默认账号/密码:admin/admin
2)添加数据源
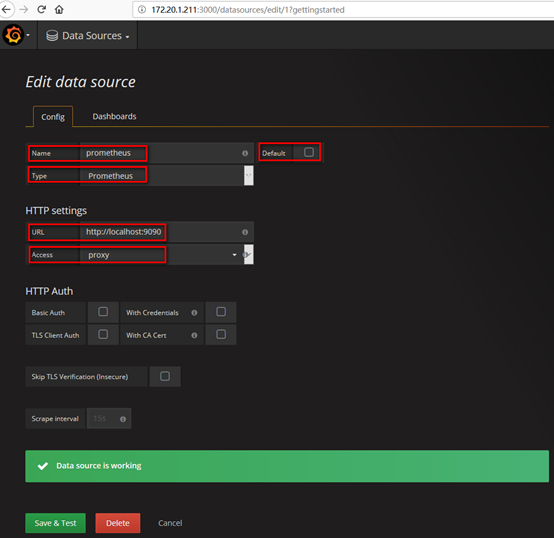
在登陆首页,点击"Add data source"按钮,跳转到添加数据源页面,配置如下:
Name: prometheus
Type: prometheus
URL: http://localhost:9090/
Access: proxy
取消Default的勾选,其余默认,点击"Add",如下:
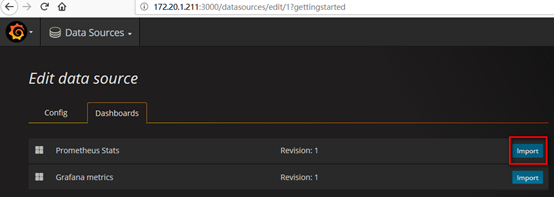
在"Dashboards"页签下"import"自带的模版,如下:
6. 导入dashboard
从grafana官网下载相关dashboaed到本地,如:https://grafana.com/dashboards/405
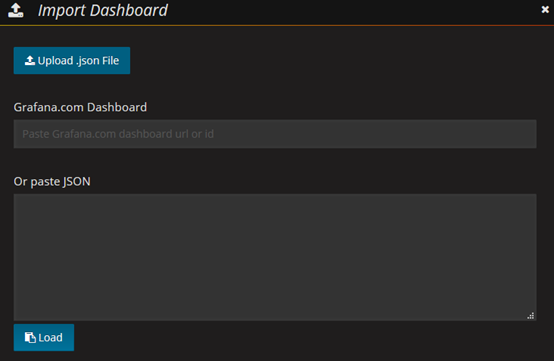
Grafana首页-->左上角图标-->Dashboard-->import
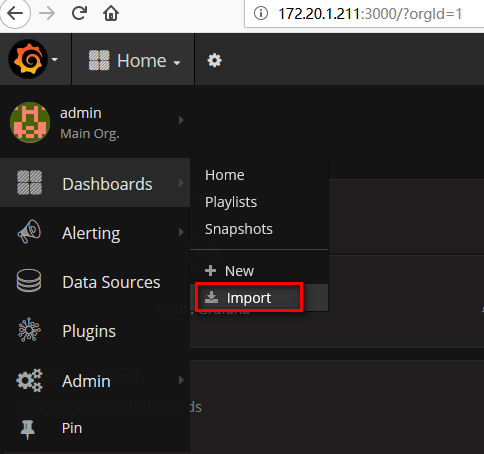
Upload已下载至本地的json文件(或者使用dashboard id,如这里的405),如下:
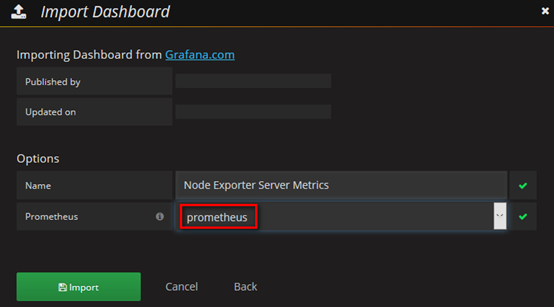
数据源选择"prometheus",即添加的数据源name,点击"Import"按钮,如下:
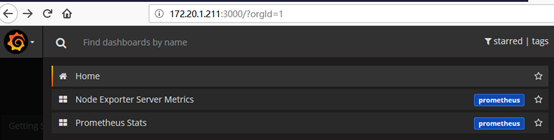
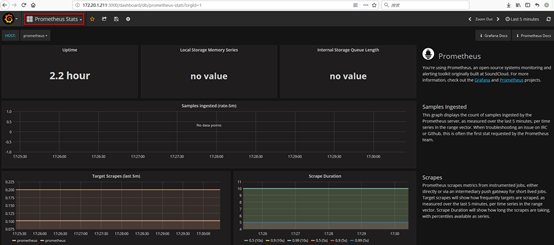
7. 查看dashboard
Grafana首页-->左上角图标-->Dashboard-->Home,Home下拉列表中可见有已添加的两个dashboard,"Prometheus Stats"与"Node Exporter Server Metrics",选择1个即可,如下:

Prometheus+Grafana监控部署实践的更多相关文章
- 使用Prometheus+Grafana监控MySQL实践
一.介绍Prometheus Prometheus(普罗米修斯)是一套开源的监控&报警&时间序列数据库的组合,起始是由SoundCloud公司开发的.随着发展,越来越多公司和组织接受采 ...
- Prometheus Grafana监控全方位实践
这次就不用 docker 部署服务了,这样大家会更容易接受.欢迎阅读. 引言 Prometheus 是一个监控系统,也是一个时间序列数据库,用Go语言开发的,官方文档.通过从某些特定的目标如主机,My ...
- 部署Prometheus+Grafana监控
Prometheus 1.不是很友好,各种配置都手写 2.对docker和k8s监控有成熟解决方案 Prometheus(普罗米修斯) 是一个最初在SoudCloud上构建的监控系统,开源项目,拥有非 ...
- [转帖]Prometheus+Grafana监控Kubernetes
原博客的位置: https://blog.csdn.net/shenhonglei1234/article/details/80503353 感谢原作者 这里记录一下自己试验过程中遇到的问题: . 自 ...
- Prometheus + Grafana 监控系统搭
本文主要介绍基于Prometheus + Grafana 监控Linux服务器. 一.Prometheus 概述(略) 与其他监控系统对比 1 Prometheus vs. Zabbix Zabbix ...
- Prometheus+Grafana监控Kubernetes
涉及文件下载地址:链接:https://pan.baidu.com/s/18XHK7ex_J0rzTtfW-QA2eA 密码:0qn6 文件中需要下载的镜像需要自己提前下载好,eg:prom/node ...
- cAdvisor+Prometheus+Grafana监控docker
cAdvisor+Prometheus+Grafana监控docker 一.cAdvisor(需要监控的主机都要安装) 官方地址:https://github.com/google/cadvisor ...
- prometheus+grafana监控redis
prometheus+grafana监控redis redis安装配置 https://www.cnblogs.com/autohome7390/p/6433956.html redis_export ...
- prometheus+grafana监控mysql
prometheus+grafana监控mysql 1.安装配置MySQL官方的 Yum Repository(有mysql只需设置监控账号即可) [root@localhost ~]# wget - ...
随机推荐
- IIS - 虚拟目录与应用程序的异同
在Windows 7 IIS7中,对服务器建立站点后,有二种添加子站点的方式 A. 虚拟目录 B. 应用程序 简单总结下二者之间的异同 A.虚拟目录 虚拟目录是指在站点下建立一个虚拟子目录 ...
- 生成二维码的 jQuery 插件:jquery.qrcode.js的中文乱码问题
在使用jquery.qrcode.js这个插件生成二维码的时候发现并不能识别中文. 原因在于:jquery-qrcode是采用charCodeAt()方式进行编码转 换的. 而这个方法默认会获取它的U ...
- HTTPweb服务器——HTTP基本知识
对于HTTP来说,我们不需要说太多,HTTP又叫做超文本传输协议,现如今利用最多的版本是1.1版本. HTTP的特点:C/S模式,B/S模式 简单快速:基于请求和响应,请求只需要传送请求方法和路径. ...
- OO 第三次博客总结
调研规格化设计 1950年代,第一次分离,主程序和子程序的分离程序结构模型是树状模型,子程序可先于主程序编写.通过使用库函数来简化编程,实现最初的代码重用.产生基本的软件开发过程:分析—设计—编码—测 ...
- DP学习笔记
DP学习笔记 可是记下来有什么用呢?我又不会 笨蛋你以后就会了 完全背包问题 先理解初始的DP方程: void solve() { for(int i=0;i<;i++) for(int j=0 ...
- MongoDB的高级使用
MongoDB的高级使用 1. Mongdb的索引备份以及和python交互 t255为mongodb中的集合 1.1 创建索引 索引的特点:提高查找的效率 不创建索引的情况下的查询: for(i=0 ...
- Sql主从同步服务
主服务器A:192.168.1.102从服务器B:192.168.1.103 先关掉主服务器phpstudy,把数据库备份到从服务器 1.授权用户:在A服务器新建一个从账号锁定IP GRANT REP ...
- WOT干货大放送:大数据架构发展趋势及探索实践分享
WOT大数据处理技术分会场,PingCAP CTO黄东旭.易观智库CTO郭炜.Mob开发者服务平台技术副总监林荣波.宜信技术研发中心高级架构师王东及商助科技(99Click)顾问总监郑泉五位讲师, ...
- Python3 透明网桥算法
import time #定义网桥1 b1 = {} port_list1 = [1, 2] #主机列表 L1 = ['a','b','c'] L2 = ['d','e'] L = [L1,L2] d ...
- Asp.Net实现在线人数统计 (转)
原文件:http://blog.csdn.net/wxd_860825/article/details/4589292 利用Application对象和Session对象可以统计当前在线用户数量. 注 ...