plot与legend画图与图例
画图与图例:
legend(x, y = NULL, legend, fill = NULL, col = par("col"),
border = "black", lty, lwd, pch,
angle = 45, density = NULL, bty = "o", bg = par("bg"),
box.lwd = par("lwd"), box.lty = par("lty"), box.col = par("fg"),
pt.bg = NA, cex = 1, pt.cex = cex, pt.lwd = lwd,
xjust = 0, yjust = 1, x.intersp = 1, y.intersp = 1,
adj = c(0, 0.5), text.width = NULL, text.col = par("col"),
text.font = NULL, merge = do.lines && has.pch, trace = FALSE,
plot = TRUE, ncol = 1, horiz = FALSE, title = NULL,
inset = 0, xpd, title.col = text.col, title.adj = 0.5,
seg.len = 2)
|
x, y |
X,y用于定位图例,也可用单键词"bottomright", "bottom", "bottomleft", "left", "topleft", "top", "topright", "right" and "center" |
|
legend |
字符或表达式向量 |
|
fill |
用特定的颜色进行填充 |
|
col |
图例中出现的点或线的颜色 |
|
border |
当fill = 参数存在的情况下,填充色的边框 |
|
lty, lwd |
图例中线的类型与宽度 |
|
pch |
点的类型 |
|
angle |
阴影的角度 |
|
density |
阴影线的密度 |
|
bty |
图例框是否画出,o为画出,默认为n不画出 |
|
bg |
bty != "n"时,图例的背景色 |
|
box.lty, box.lwd, box.col |
bty = "o"时,图例框的类型,box.lty决定是否为虚线,box.lwd决定粗线,box.col决定颜色 |
|
pt.bg |
点的背景色 |
|
cex |
字符大小 |
|
pt.cex |
点的大小 |
|
pt.lwd |
点的边缘的线宽 |
|
x.intersp |
图例中文字离图片的水平距离 |
|
y.intersp |
图例中文字离图片的垂直距离 |
|
adj |
图例中字体的相对位置 |
|
text.width |
图例字体所占的宽度 |
|
text.col |
图例字体的颜色 |
|
text.font |
图例字体 |
|
merge |
logical, if TRUE,合并点与线,但不填充图例框,默认为TRUE |
|
trace |
logical; if TRUE显示图例信息. |
|
plot |
logical. If FALSE不画出图例 |
|
ncol |
图例中分类的列数 |
|
horiz |
logical; if TRUE,水平放置图例 |
|
title |
给图例加标题 |
|
inset |
当图例用关键词设置位置后,inset = 分数,可以设置其相对位置 |
|
xpd |
xpd=FALSE,即不允许在作图区域外作图,改为TRUE即可,与par()参数配合使用。 |
|
title.col |
标题颜色 |
|
title.adj |
图例标题的相对位置,0.5为默认,在中间。0最左,1为最右。 |
|
seg.len |
lty 与lwd的线长,长度单位为字符宽度 |
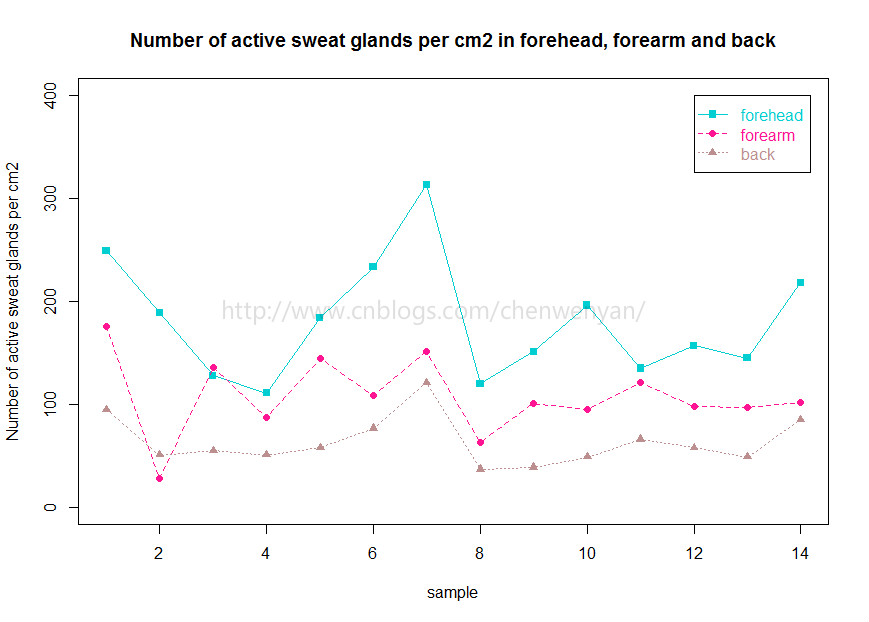
先画出每个样本的forehead位置的sweat gland 数量
|
1
|
plot(forehead~sample,pch=15,col="DarkTurquoise",ylim=c(0,400),ylab="Number of active sweat glands per cm2",main="Number of active sweat glands per cm2 in forehead, forearm and back")#pch表示散点用什么形状表示,col表示颜色,ylim表示Y轴范围,ylab表示Y轴标题,main表示图片标题 |
接着画出每个样本forearm位置的sweat gland 数量
注意,这里不用plot函数画forearm和sample之间的关系,因为会把上面forehead和sample的图覆盖住,为了实现多个因变量和一个自变量在同一个图片里,我们要用points或者lines函数画其他因变量和自变量的值
|
1
|
points(sample,forearm,pch=16,col="DeepPink",cex=1)#cex表示散点的大小 |
画出back位置的sweat gland 数量
|
1
|
points(sample,back,pch=17,col="RosyBrown",cex=1) |
把14个样本在forehead,forearm和back不同位置的sweat gland 数量用线连起来
|
1
2
3
|
lines(forehead,col="DarkTurquoise",lty=1)#lty=1表示用实线连起来lines(forearm,col="DeepPink",lty=2)#lty=2表示用虚线连起来lines(back,col="RosyBrown",lty=3)#lty=3表示用点线连起来 |
legend函数,图例说明:
|
1
|
legend(12,400,c("forehead","forearm","back"),col=c("DarkTurquoise","DeepPink","RosyBrown"),text.col=c("DarkTurquoise","DeepPink","RosyBrown"),pch=c(15,16,17),lty=c(1,2,3))#12表示x轴坐标为12,400表示y轴坐标为400,意思为图例的左边和上边界限,text.col表示图例文本颜色 |
最后,画出来的图片效果如下:
plot与legend画图与图例的更多相关文章
- matlab画图函数plot()/set/legend
简单plot()/legend/XY轴范围axis 除了坐标轴信息外还可以添加其它的信息,如所画曲线的信息等:测试代码如下 x=0:pi/20:2*pi; y1=sin(x); y2=cos(x); ...
- matplotlib中的legend()——用于显示图例
legend()的一个用法: 当我们有多个 axes时,我们如何把它们的图例放在一起呢?? 我们可以这么做: import matplotlib.pyplot as plt import numpy ...
- 增加图例 Legend和删除图例
private void button1_Click(object sender, System.EventArgs e) { //Get the GraphicsContainer IGraphic ...
- matplotlib中的legend()—显示图例
源自 matplotlib中的legend()——用于显示图例 -- 博客园 http://www.cnblogs.com/yinheyi/p/6792120.html legend()的一个用法: ...
- ggplot2 legend图例的修改
ggplot2中的legend包括四个部分: legend.tittle, legend.text, legend.key, legend.backgroud.针对每一部分有四种处理方式: eleme ...
- echart 饼图图例legend支持滑动
ps: 以下针对option操作 文章目录 图例过多加上滚动条图例形状图例自定义显示图例过多加上滚动条 legend:{ top:'50', bottom:'50', type:'scroll',} ...
- matlab的legend用法
用Matlab画图时,有时候需要对各种图标进行标注,例如,用“+”代表A的运动情况,“*”代表B的运动情况. legend函数的基本用法是: LEGEND(string1,string2,string ...
- Matlab设置Legend横排、分块
高级用法1:指定legend显示的位置: legend({'str1','str2','strn'},'Location','SouthEast'); 比较鸡肋,画好图后树手动拖动就好了 高级用法2: ...
- matlab 初级画图
matlab 初级画图 1.plot() plot(x,y) plots each vector pairs (x,y) 画图函数画出每个点 每组变量 plot (y) plots eac ...
随机推荐
- 《Linux内核分析》第四周学习总结
<Linux内核分析>第四周学习总结 ——扒开系统调用的三层皮 姓名:王玮怡 学号:20135116 理论总结部分: 第一节 用户态.内核 ...
- 《Linux课本》读书笔记 第四章
- mapreduce 中 map数量与文件大小的关系
学习mapreduce过程中, map第一个阶段是从hdfs 中获取文件的并进行切片,我自己在好奇map的启动的数量和文件的大小有什么关系,进过学习得知map的数量和文件切片的数量有关系,那文件的大小 ...
- git 使用ssh密钥
一.查看仓库支持的传输协议 1.1查看仓库支持的传输协议 使用命令 git remote -v 查看你当前的 remote url root@zengyue:/home/yuanGit# git re ...
- Prism6下的MEF:基于微软企业库的Cache
通常,应用程序可以将那些频繁访问的数据,以及那些需要大量处理时间来创建的数据存储在内存中,从而提高性能.基于微软的企业库,我们的快速创建一个缓存的实现. 新建PrismSample.Infrastru ...
- Test Scenarios for a window
1 check if default window size is correct2 check if child window size is correct3 check if there is ...
- 二本毕业,我是如何逆袭成为BAT年薪40W的Java工程师的?
身边的师弟师妹经常问到:非计算机专业出身,你是在2年内如何逆袭成BAT年薪40W的资深开发工程师的.其实很简单——努力! 我16年毕业于普通的二本学校,非计算机专业出身,只因为对软件开发感兴趣,所以找 ...
- 【转载】JAVA消息服务JMS规范及原理详解
转载:https://www.cnblogs.com/molao-doing/articles/6557305.html 作者: moyun- 一.简介 JMS即Java消息服务(Java Messa ...
- python之enumerate函数:获取列表中每个元素的索引和值
源码举例: def enumerate_fn(): ''' enumerate函数:获取每个元素的索引和值 :return:打印每个元素的索引和值 ''' list = ['] for index, ...
- python---集合及深浅copy
一.集合 相信大家都在数学中接触过集合,在python中集合也是有这相同的性质,1.去重,集合会将内部元素自定去重 2.关系测试,类似数学中的交集并集子集一样 1.1如何创建集合 集合在python中 ...