Chi-Square Statistic/Distribution
、
1、What is a Chi Square Test?
卡方检验有两种类型。两者使用卡方统计量和分布的目的不同。
第一种:卡方拟合优度检验确定样本数据是否与总体匹配。(这里不介绍)
第二种:独立性的卡方检验比较列联表中的两个变量,看看它们是否相关。在更一般的意义上,它测试分类变量的分布是否不同。
一个非常小的x平方分布测试统计量意味着您观察到的数据非常适合您的预期数据。换句话说,之间有关系。
非常大的x平方分布测试统计量意味着数据不太适合。换句话说,之间没有关系。
There are two types of chi-square tests. Both use the chi-square statistic and distribution for different purposes:
A chi-square goodness of fit test determines if a sample data matches a population. For more details on this type, see: Goodness of Fit Test.

A chi-square test for independence compares two variables in a contingency table to see if they are related. In a more general sense, it tests to see whether distributions of categorical variables differ from each another.

    A very small chi square test statistic means that your observed data fits your expected data extremely well. In other words, there is a relationship.

    A very large chi square test statistic means that the data does not fit very well. In other words, there isn’t a relationship.
2、What is a Chi-Square Statistic(卡方统计)?

下标c是自由度。O是观测值,E是期望值。很少有人想用这个公式来求临界卡方值。求和符号意味着您必须对数据集中的每一个数据项执行计算。正如您可能想象的那样,计算可能非常、非常冗长和乏味。相反,你可能想要使用技术。
The subscript “c” are the degrees of freedom. “O” is your observed value and E is your expected value. It’s very rare that you’ll want to actually use this formula to find a critical chi-square value by hand. The summation symbol means that you’ll have to perform a calculation for every single data item in your data set. As you can probably imagine, the calculations can get very, very, lengthy and tedious. Instead, you’ll probably want to use technology
卡方统计量是表示两个分类变量之间关系的一种方法。在统计学中,有两种类型的变量:数值(可数)变量和非数值(分类)变量。卡方统计量是一个单独的数字,它告诉你观察到的数量和你预期的数量之间有多大的差异,如果在总体中没有任何关系的话。
A chi-square statistic is one way to show a relationship between two categorical variables. In statistics, there are two types of variables: numerical (countable) variables and non-numerical (categorical) variables. The chi-squared statistic is a single number that tells you how much difference exists between your observed counts and the counts you would expect if there were no relationship at all in the population.
卡方统计量有一些变化。你使用哪种方法取决于你如何收集数据,以及哪种假设正在被检验。然而,所有的变化都使用相同的思想,即您正在将期望值与实际收集的值进行比较。最常见的表格之一可用于列联表:

O : observed value,
E :expected value
i: the “ith” position in the contingency table.
There are a few variations on the chi-square statistic. Which one you use depends upon how you collected the data and which hypothesis is being tested. However, all of the variations use the same idea, which is that you are comparing your expected values with the values you actually collect. One of the most common forms can be used for contingency tables:
卡方值越低,表示两组数据之间的相关性越高。从理论上讲,如果你的观测值和期望值相等(“没有差异”),那么卡方为零——这是现实生活中不太可能发生的事情。决定卡方检验统计量是否足够大以表明统计上的显著差异并不像看起来那么容易。如果我们能说卡方检验统计量>10表示差异,那就太好了,但不幸的是事实并非如此
A low value for chi-square means there is a high correlation between your two sets of data. In theory, if your observed and expected values were equal (“no difference”) then chi-square would be zero — an event that is unlikely to happen in real life. Deciding whether a chi-square test statistic is large enough to indicate a statistically significant difference isn’t as easy it seems. It would be nice if we could say a chi-square test statistic >10 means a difference, but unfortunately that isn’t the case.
您可以将计算出的卡方值与卡方表中的临界值进行比较。如果卡方值大于临界值,则有显著性差异。
You could take your calculated chi-square value and compare it to a critical value from a chi-square table. If the chi-square value is more than the critical value, then there is a significant difference.
你也可以用p值。首先陈述原假设和替代假设。然后为结果生成卡方曲线和p值(参见:计算卡方p值Excel)。较小的p值(低于5%)通常表示差异显著(或“足够小”)
You could also use a p-value. First state the null hypothesis and the alternate hypothesis. Then generate a chi-square curve for your results along with a p-value (See: Calculate a chi-square p-value Excel). Small p-values (under 5%) usually indicate that a difference is significant (or “small enough”).
提示:卡方统计只能用于数字。它们不能用于百分比、比例、平均值或类似的统计值。例如,如果200人中有10%的人,则需要将其转换为数字(20),然后才能运行测试统计数据。
Tip: The Chi-square statistic can only be used on numbers. They can’t be used for percentages, proportions, means or similar statistical value. For example, if you have 10 percent of 200 people, you would need to convert that to a number (20) before you can run a test statistic.
3、Chi Square P-Values.
卡方检验会给你一个p值。p值将告诉您测试结果是否显著。为了执行卡方检验并得到p值,需要两条信息:
1、自由度。这就是类别的数量减1。
2、阿尔法(α)水平。这是由你或研究人员选择的。通常的alpha值是0.05(5%),但是你也可以有其他的值,比如0.01或0.10。
A chi square test will give you a p-value. The p-value will tell you if your test results are significant or not. In order to perform a chi square test and get the p-value, you need two pieces of information:

    Degrees of freedom. That’s just the number of categories minus 1.

    The alpha level(α). This is chosen by you, or the researcher. The usual alpha level is 0.05 (5%), but you could also have other levels like 0.01 or 0.10.
在基本统计或AP统计中,自由度(df)和alpha级别通常在问题中给出。你通常不需要知道它们是什么。您可能需要自己计算出df,但它非常简单:计算类别并减去1
In elementary statistics or AP statistics, both the degrees of freedom(df) and the alpha level are usually given to you in a question. You don’t normally have to figure out what they are. You may have to figure out the df yourself, but it’s pretty simple: count the categories and subtract 1
Degrees of freedom (自由度通常为下标):are placed as a subscriptafter the chi-square (Χ2) symbol. For example, the following chi square shows 6 df: Χ26.
And this chi square shows 4 df:Χ24.
4、The Chi-Square Distribution
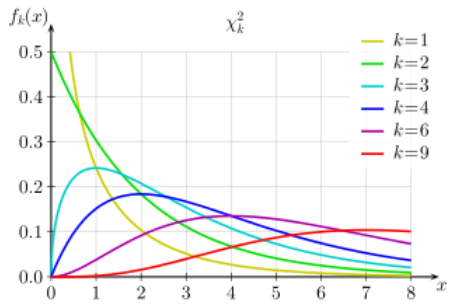
卡方分布(也称为卡方分布)是gamma distribution的一种特殊情况;卡方分布与n自由度等于伽马分布= n / 2和b = 0.5(或β= 2)。
The chi-square distribution (also called the chi-squared distribution) is a special case of the gamma distribution; A chi square distribution with n degrees of freedom is equal to a gamma distribution with a = n / 2 and b = 0.5 (or β = 2).
假设有一个正态分布的随机样本值。x²分布是这些随机样本的和的平方分布。自由度(k)等于被求和的样本个数。例如,从正态分布中取10个样本值,则df = 10。x平方分布中的自由度也是其均值。在这个例子中,这个特定分布的均值是10。卡方分布总是右偏的。然而,自由度越大,卡方分布看起来越像正太分布.
Let’s say you have a random sample taken from a normal distribution. The chi square distribution is the distribution of the sum of these random samples squared . The degrees of freedom (k) are equal to the number of samples being summed. For example, if you have taken 10 samples from the normal distribution, then df = 10. The degrees of freedom in a chi square distribution is also its mean. In this example, the mean of this particular distribution will be 10. Chi square distributions are always right skewed. However, the greater the degrees of freedom, the more the chi square distribution looks like a normal distribution.
5、Uses
卡方分布在统计学中有很多用途,包括:
1、正态分布总体标准差与样本标准差的置信区间估计。
2、定性变量分类的两个独立标准。
3、分类变量(列联表)之间的关系。
4、样本方差研究时的基本分布是正常的。
5、期望频率和观测频率差异偏差的测试(单向表)。
6、卡方检验(拟合优度检验)。
    Confidence interval estimation for a population standard deviation of a normal distribution from a sample standard deviation.

    Independence of two criteria of classification of qualitative variables.

    Relationships between categorical variables (contingency tables).

    Sample variance study when the underlying distribution is normal.

    Tests of deviations of differences between expected and observed frequencies (one-way tables).

    The chi-square test (a goodness of fit test).
6、手动计算理解原理
卡方公式是一个很难处理的公式。这主要是因为您需要添加大量的数字。解这个公式最简单的方法是做一个表格。
The chi-square formula is a difficult formula to deal with. That’s mostly because you’re expected to add a large amount of numbers. The easiest way to solve the formula is by making a table.
举例:
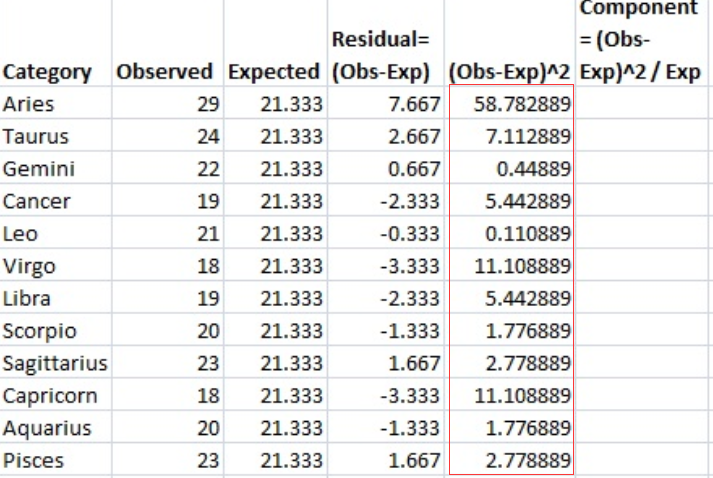
样本问题:调查了256位视觉艺术家,以找出他们的星座。结果显示:白羊座(29位)、金牛座(24位)、双子座(22位)、巨蟹座(19位)、狮子座(21位)、处女座(18位)、天秤座(19位)、天蝎座(20位)、射手座(23位)、摩羯座(18位)、水瓶座(20位)、双鱼座(23位)。验证黄道十二宫分布均匀的假说
步骤1:列一个表包含“分类”、“观察”、“预期”、“(os -Exp)”、“(os -Exp)2”和“组件(os -Exp)2 / Exp”。我们将在下面的步骤中对此进行介绍。

第二步:填写你的分类。问题中应该给你分类。有12个星座,所以:
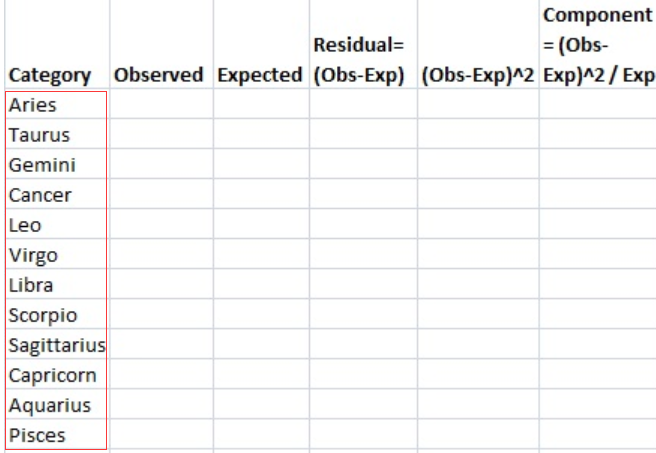
Step 3:写下你的数量。计数是列2中每个类别中的每个项目的数量。在这个问题中,你得到了计数:

步骤4:计算列3的期望值。在这个问题中,我们希望12个星座在256个人中是均匀分布的,所以256/12=21.333。把这个写在第三栏。
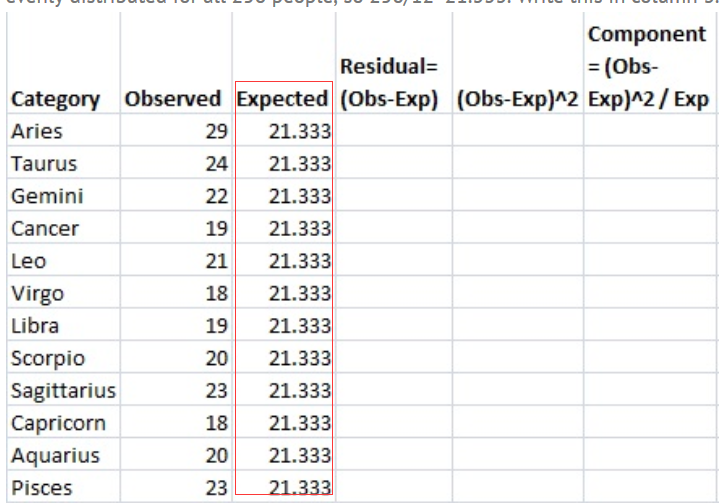
步骤5:从观测值(步骤3)中减去期望值(步骤4),将结果放入“残差”列。例如,第一行是Aries: 29-21.333=7.667。
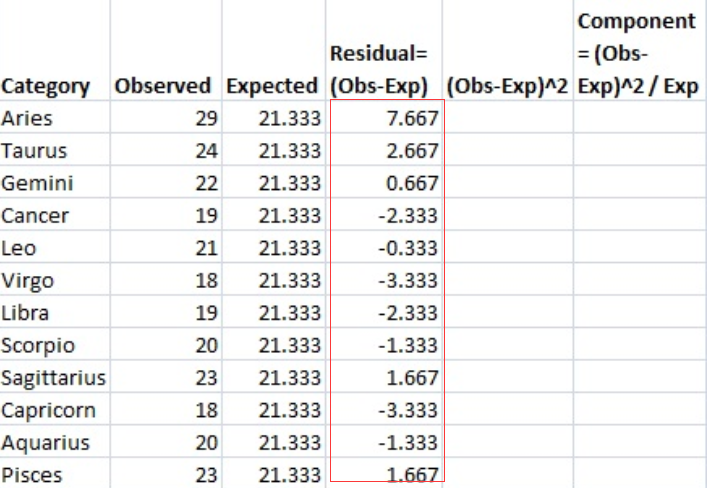
Step 6: 将步骤5的结果平方,并将数量放入(os - exp)2列
步骤7:用步骤6中的金额除以期望值(步骤4),并将这些结果放在最后一列。
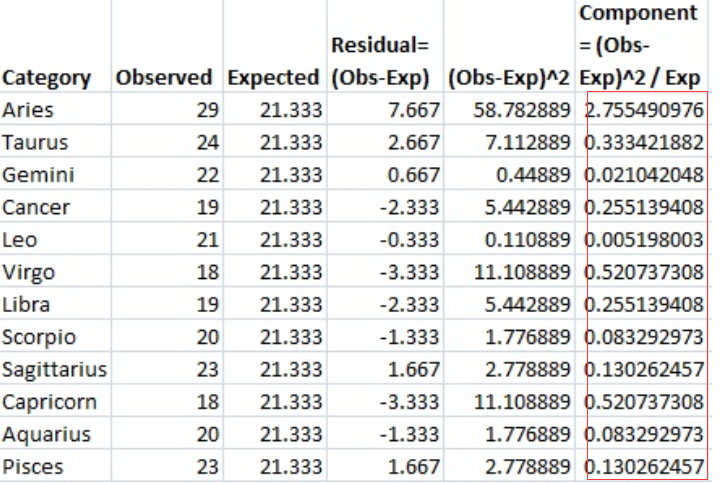
步骤8:将最后一列中的所有值相加(和)。

This is the chi-square statistic: 5.094.
参考文献:
https://www.statisticshowto.datasciencecentral.com/probability-and-statistics/chi-square/
Chi-Square Statistic/Distribution的更多相关文章
- Chi Square Distance
The chi squared distance d(x,y) is, as you already know, a distance between two histograms x=[x_1,.. ...
- BendFord's law's Chi square test
http://www.siam.org/students/siuro/vol1issue1/S01009.pdf bendford'law e=log10(1+l/n) o=freq of first ...
- 用R进行市场调查和消费者感知分析
// // 问题到数据 理解问题 理解客户的问题:谁是客户(某航空公司)?交流,交流,交流! 问题要具体 某航空公司: 乘客体验如何?哪方面需要提高? 类别:比较.描述.聚类,判别还是回归 需要什么样 ...
- 人脸识别经典算法二:LBP方法
与第一篇博文特征脸方法不同,LBP(Local Binary Patterns,局部二值模式)是提取局部特征作为判别依据的.LBP方法显著的优点是对光照不敏感,但是依然没有解决姿态和表情的问题.不过相 ...
- Generalized normal distribution and Skew normal distribution
Density Function The Generalized Gaussian density has the following form: where (rho) is the " ...
- Scipy教程 - 统计函数库scipy.stats
http://blog.csdn.net/pipisorry/article/details/49515215 统计函数Statistical functions(scipy.stats) Pytho ...
- scipy.stats
scipy.stats Scipy的stats模块包含了多种概率分布的随机变量,随机变量分为连续的和离散的两种.所有的连续随机变量都是rv_continuous的派生类的对象,而所有的离散随机变量都是 ...
- 加州大学伯克利分校Stat2.3x Inference 统计推断学习笔记: Section 5 Window to a Wider World
Stat2.3x Inference(统计推断)课程由加州大学伯克利分校(University of California, Berkeley)于2014年在edX平台讲授. PDF笔记下载(Acad ...
- Data Visualization – Banking Case Study Example (Part 1-6)
python信用评分卡(附代码,博主录制) https://study.163.com/course/introduction.htm?courseId=1005214003&utm_camp ...
随机推荐
- box-shadow 边框样式
如下 box-shadow: 0 1px 3px 0 rgba(0,0,0,.2), 0 1px 1px 0 rgba(0,0,0,.14), 0 2px 1px -1px rgba(0,0,0,.1 ...
- sqlvarchar后自动填充空格解决办法(SET ANSI_PADDING)
SET ANSI_PADDING http://www.yesky.com/imagesnew/software/tsql/ts_set-set_2uw7.htm http://www.makaido ...
- WPF Demo3
<Window x:Class="Demo3.MainWindow" xmlns="http://schemas.microsoft.com/winfx/2006/ ...
- 【Spring学习笔记-MVC-11--】Spring MVC之表单标签
一.使用方法 1.要使用Spring MVC提供的表单标签,首先需要在视图页面添加: <%@ taglib prefix="form" uri="http://ww ...
- windows平台安装配置Gitblit
1 安装配置jdk环境变量 2下载GitBlit,下载地址:http://www.gitblit.com或者http://gitblit.com 解压即可 3修改gitblit\data下defau ...
- Windows下MySQL免安装版的安装、卸载
一.安装 1.下载 到MySQL官网http://dev.mysql.com/downloads/mysql/ 下载mysql-5.6.15-win32.zip. 2.拷贝 将mysql-5.6.15 ...
- eclipse 常用jar包总结
BeanUtils: DbUtils: FileUpload: IO: Lang: Logging: cglib: mysql-connector: Pool:[datasource] DBCP:[d ...
- django 更新 模板语言
Django模板系统 官方文档 常用语法 只需要记两种特殊符号: {{ }}和 {% %} 变量相关的用{{}},逻辑相关的用{%%}. 变量 在Django的模板语言中按此语法使用:{{ 变量名 ...
- 转载 spring事务增强
1.预备知识 aop概念请参考[http://www.iteye.com/topic/1122401]和[http://jinnianshilongnian.iteye.com/blog/141859 ...
- 如何提取一个转录本的3'UTR区域的序列
庐州月光 如何提取一个转录本的3'UTR区域的序列 在做microRNA 和 mRNA 相互作用预测的时候,大家都知道microRNA 作用的靶点是位于mRNA 的3'UTR取,所以只需要提取mRNA ...
