Confluo: Distributed Monitoring and Diagnosis Stack for High-speed Networks
https://rise.cs.berkeley.edu/blog/confluo-millisecond-level-queries-on-large-scale-streaming-data/
https://ucbrise.github.io/confluo/
confluo要解决的问题,
对于kafka这样大吞吐的系统,无法提供太多的查询功能;而传统数据库提供比较强的查询功能,但是吞吐又比较小
所以是否有一个系统可以,又。。。又。。。
confluo说他行

使用
先看下confluo是怎么用的,有个感性认识
他可以作为lib或standalone的服务来使用,很方便
confluo::confluo_store store("/path/to/data"); //创建store

std::string schema = "{ //定义schema

  timestamp: LONG,

  op_latency_ms: DOUBLE,

  cpu_util: DOUBLE,

  mem_avail: DOUBLE,

  log_msg: STRING(100)

}";

//创建multilog,表的概念

auto storage_mode = confluo::storage::IN_MEMORY;

store.create_atomic_multilog("perf_log", schema, storage_mode);
现在这个数据如果要离线查询,需要加索引,这个和其他数据库一样,可以adhoc的查
confluo::atomic_multilog* mlog = store.get_atomic_multilog("perf_log");

mlog->add_index("op_latency_ms");
同时confluo还需要可以做在线查询,这个怎么做到,空间换时间,这个只能预先定义好进行预算,并没有什么magic
confluo可以定义如下的操作,
Filter
mlog->add_filter("low_resources", "cpu_util>0.8 || mem_avail<0.1");
Aggregate
mlog->add_aggregate("max_latency_ms", "low_resources", "MAX(op_latency_ms)");
这里aggregate需要加在filter上面,这里在filter low_resources上加了一个aggregate叫max_latency_ms,目的是取出延时的最大值
Trigger
mlog->install_trigger("high_latency_trigger", "max_latency_ms > 1000");
这里的trigger是基于前面的aggregate定义的
现在定义都定义好了,可以写数据了,
size_t off1 = mlog->append({"", "0.5", "0.9",  "INFO: Launched 1 tasks"});

size_t off2 = mlog->append({"", "0.9", "0.05", "WARN: Server {2} down"});

size_t off3 = mlog->append({"", "0.9", "0.03", "WARN: Server {2, 4, 5} down"});
为什么他说他写数据快,因为是append,这个也没什么magic
可以用返回的offset,把数据读出来,
auto record1 = mlog->read(off1);

auto record2 = mlog->read(off2);

auto record3 = mlog->read(off3);
当然对于数据库,可以对建过索引的字段进行查询,
注意这里的execute_filter是lazily evaluated,所以只有在遍历的时候才会真正执行
auto record_stream1 = mlog->execute_filter("cpu_util>0.5 || mem_avail<0.5");

for (auto s = record_stream1; !s.empty(); s = s.tail()) {

  std::cout << s.head().to_string();

}
到这里的使用和普通数据,没有啥不同,
但是他还能查询上面定义的,filter,aggregate,trigger
查询filter,后面两个参数代表,时间范围
auto record_stream2 = mlog->query_filter("low_resources", , UINT64_MAX);

for (auto s = record_stream2; !s.empty(); s = s.tail()) {

  std::cout << s.head().to_string();

}
查询aggregate,
auto value = mlog->get_aggregate("max_latency_ms", , UINT64_MAX);

std::cout << value.to_string();
查询trigger,
auto alert_stream = mlog->get_alerts(, UINT64_MAX, "high_latency_trigger");

for (auto s = alert_stream; !s.empty(); s = s.tail()) {

  std::cout << s.head().to_string();

}
这些数据都是在数据流过的时候已经预算好的,这里只是取出来用而已
原理
架构

coordinator
Confluo’s coordinator interface allows monitoring and diagnosing network-wide events by delegating monitoring responsibilities to Confluo’s individual end-host modules, and by providing the diagnostic information from individual modules to the network operator. An operator submits control programs composed of Confluo API calls to the coordinator, which in turn contacts relevant endhost modules and coordinates the execution of Confluo API calls via RPC. The coordinator API also allows obtaining distributed atomic snapshots of telemetry data distributed across the end-hosts
coordinator可以解决分布式的问题,还支持distributed atomic snapshots
end host
Confluo conducts bulk of monitoring and diagnosis operations at the end-hosts. Confluo captures and monitors packets in the hypervisor, where a software switch could deliver packets between NICs and VMs.
A mirroring module mirrors packet headers to a spray module , that writes these headers to one of multiple ring buffers in a round-robin manner. Confluo currently uses DPDK [37 ] to bypass the kernel stack, and Open vSwitch [38 ] to implement the mirror and spray modules. This choice of implementation is merely to perform our prototype evaluation without the overheads of existing cloud frameworks (e.g. , KVM or Xen); our implementation on OVS trivially allows us to integrate Confluo with these frameworks.
首先论文的题目是,对网络的一个监控和诊断stack,所以这个架构图不光是confluo,而且描述了他是如何用户监控网络数据
vm是通过Hypervisor和NIC(network interface controller)进行通信的,所以confluo首先通过mm,mirroring module,拿到数据,然后发送到sm,spray module
spray module会把数据分发到多个ring buffer,然后会有一堆Confluo writer来把数据从ring buffer写到multilog中
然后confluo提供一组模块,Monitor,Diagnoser,Archiver,来查询multilog完成业务功能
Atomic MultiLog
paper的核心其实就是这个数据结构,
Property 1: Packet headers, once processed by the stack, are not updated and only aggregated over long time scales.
Property 2: Each packet header attribute has a fixed size (number of bits used to represent the attribute)
两个特性, append only和字段固定大小
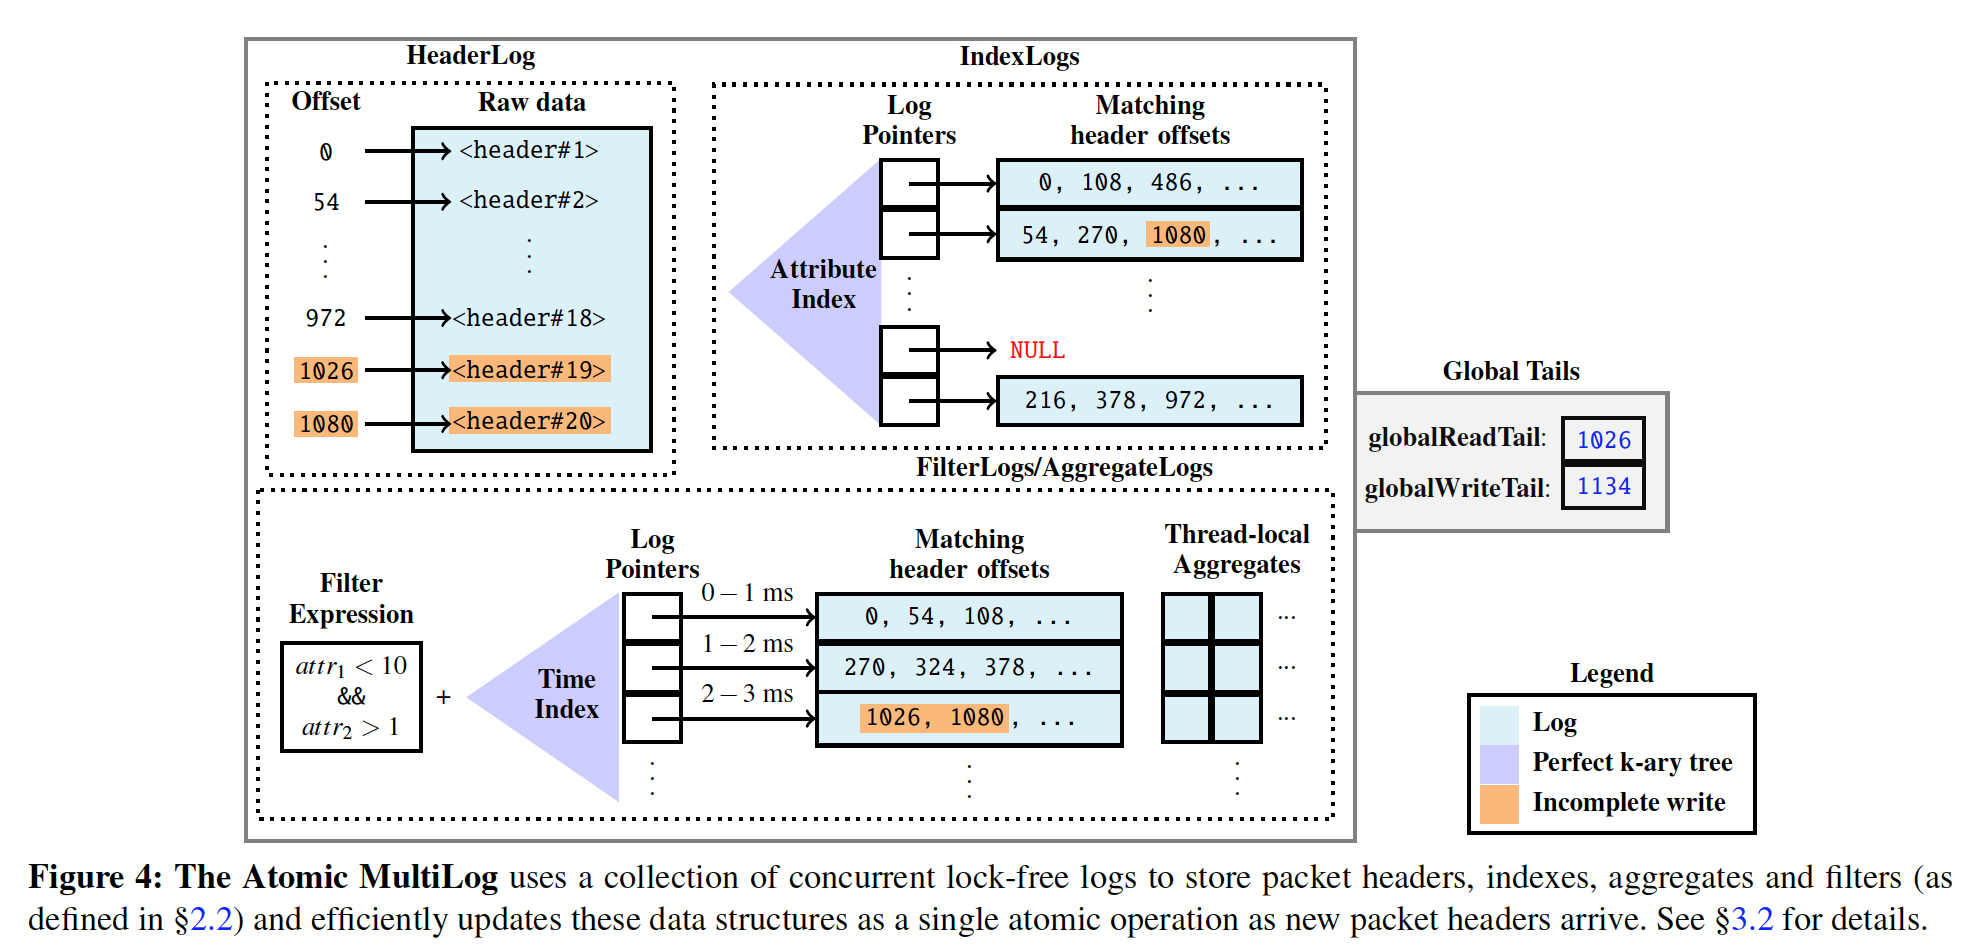
Multilog就是多种log,有哪些log组成,
HeaderLog,原始Log
This concurrent append-only log stores the raw data for all captured packet headers in Confluo. Each packet header in the HeaderLog has an offset, which is used as a unique reference to the packet across all data structures within the Atomic MultiLog.
IndexLog,索引Log
An Atomic MultiLog stores an IndexLog for each indexed packet attribute (e.g., srcIP, dstPort), that maps each unique attribute value (e.g., srcIP=10.0.0.1 or dstPort=80) to corresponding packet headers in Header-Log. IndexLogs efficiently support concurrent, lock-free insertions and lookups using two main ideas.
Protocol-defined fixed attribute widths in packet headers allow IndexLogs to use a perfect k-ary tree [43 ] (referred to as an attribute index in Figure 4 ) for high-throughput insertions upon new data arrival.
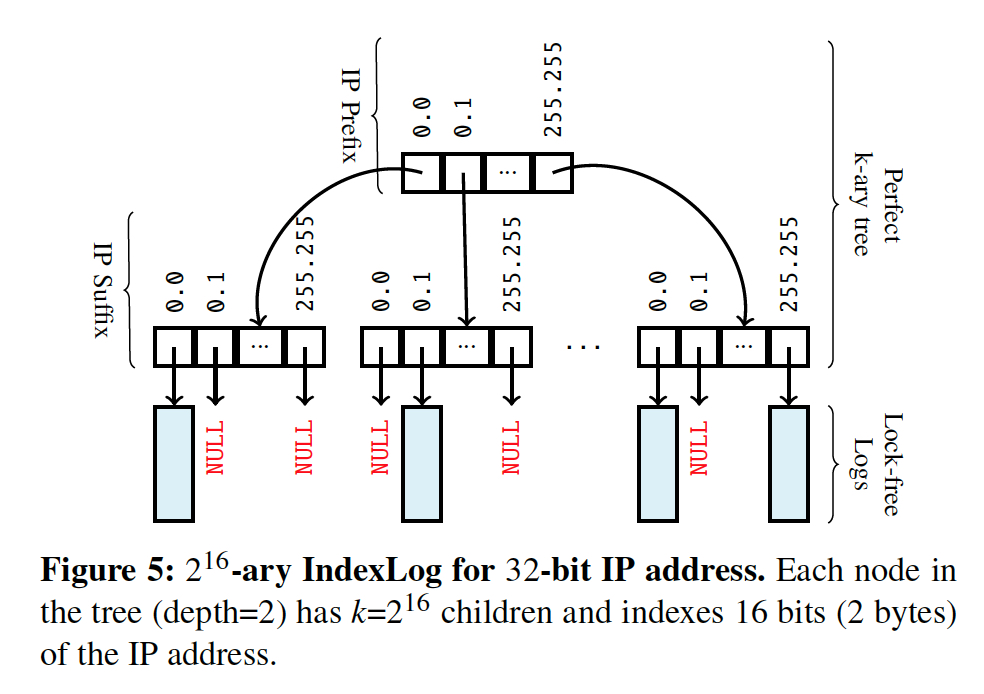
index log就是对attribute的index,索引结构就是上面的这个k叉树,树高取决于k,比如上面的例子,对于ip进行索引,ip一共32bit
如果k= 2的16次方,即对前16位进行全索引,然后在第二层对后16位进行全索引,第二层的节点数也是2的16次方,这个例子的树高就是2,
叶子节点会记录对应包含该ip的所以log的offset
所以对于index log的操作也是append only的,所以也是lock free的
FilterLog
A FilterLog is simply a filter expression (e.g., srcIP==10.0.0.1 && dstPort==80), and a time-indexed collection of logs that store references to headers that match the expression (bucketed along user-specified time intervals). The logs corresponding to different time-intervals are indexed using a perfect k-ary tree, similar to IndexLogs.
Filterlog直觉就是记录下来所有满足该filter条件的log的offset,但是这里加了一个time index,这样就可以满足API中的按时间查询,time index的结构和上面的index一样
AggregateLog
Similar to FilterLogs, an AggregateLog employs a perfect k-ary tree to index aggregates (e.g., SUM(pktSize)) that match a filter expression across userspecified time buckets. However, atomic updates on aggregate values is slightly more challenging — it requires reading the most recent version, modifying it, and writing it back. Maintaining a single concurrent log for aggregates requires handling complex race conditions to guarantee atomicity.
Confluo instead maintains a collection of thread-local logs, with each writer thread executing read-modify-write operations on its own aggregate log. The latest version of an aggregate is obtained by combining the most recent threadlocal aggregate values from individual logs.We note that the use of thread-local logs restricts aggregation to associative, commutative operations, that are sufficient to implement network monitoring and diagnosis functionalities.
和FilterLog不同在于,filter只需要记录下符合条件的offset,aggregate还需要算出并记录下这个offset对应的聚合值;
还有个关键问题是,由于有多个confluo writer,所以如果要同时去更新这个aggregate就一定会有锁,所以这里的做法是会每个writer都是算一个thread local的值,最后做聚合;
问题就是,这样就要求聚合是满足交换结合律的
现在已经知道Multilog有哪些log组成,但是如果保证他们atomic?
机制也比较直觉,通过用两个游标,readTail和writeTail,这样append的时候只需要更新writeTail
但是这不会影响到读,只有在完成原子操作后,才会去设置readTail,这样数据才对用户可见,并且对readTail的更新一定是按顺序的,不能出现hole
Confluo uses HeaderLog as single source of ground truth, and designates its readTail and writeTail as globalReadTail and globalWriteTail for the Atomic MultiLog.
Before packet headers are written to different ring buffers, Confluo first atomically increments globalWriteTail by the size of the packet header using FetchAndAdd .
This atomic instruction resolves potential write-write conflicts, since it assigns a unique HeaderLog offset to each header. When Confluo writers read headers from different ring buffers, they update all relevant logs in Atomic Multi-Log, and finally update the globalReadTail to make the data available to subsequent queries.
The globalReadTail imposes a total order among Atomic MultiLog write operations based on HeaderLog offsets: Confluo only permits a write operation to update the globalReadTail after all write operations writing at smaller HeaderLog offsets have updated the globalReadTail, via repeated CompareAndSwap attempts. This ensures that there are no “holes” in the HeaderLog, and allows Confluo to ensure atomicity for queries via a simple globalReadTail check.
对于aggreage的值,不是只记录一个值,而是记录下每个offset对应的聚合值,这样就可以根据readTail去选择最新可见的aggreate,达到atomic
这样除了可以保障atomic,而且也是append操作,性能更好
The second challenge lies in preserving atomicity for operations on Confluo aggregates, since they are not associated with any single packet header that lies within or outside the
globalReadTail. To this end, aggregate values in AggregateLogs are versioned with the HeaderLog offset of the write operation that updates it. To get the final aggregate value, Confluo obtains the aggregate with the largest version smaller than the current globalReadTail for each of the thread-local aggregates.
Confluo: Distributed Monitoring and Diagnosis Stack for High-speed Networks的更多相关文章
- A Distributed Multichannel MAC Protocol for Multihop Cognitive Radio Networks
2010 这个呢,就是time slotted的DSA网络MAC层协议. 跟上一篇单纯的Multi Channel实现类似,不过这里是CR网络,因为多了嗅探等操作. 简单的说,time slotted ...
- 监控系统 & monitoring & DevOps
监控系统 & monitoring & DevOps https://github.com/topics/monitoring https://github.com/marketpla ...
- Linux系统及应用问题分析排查工具
linux 阿里技术协会 摘要: Linux服务器上经常遇到一些系统和应用上的问题,如何分析排查,需要利器,下面总结列表了一些常用工具.trace tool:最后也列举了最近hadoop社区在开发发展 ...
- zabbix系列之一——简要介绍
参考来源:(官网) https://www.zabbix.com/documentation/3.4/manual/introduction/about 1what’s zabbix? index d ...
- Microservices
Microservices What are Microservices? What are Microservices - microservices.io Microservices - mart ...
- Nagios配置文件详解
首先要看看目前Nagios的主配置路径下有哪些文件.[root@nagios etc]# ll总用量 152-rwxrwxr-x. 1 nagios nagios 1825 9月 24 14:40 ...
- 分布式icinga2安装与使用
目标 配置分布式的icinga2监控系统.分布式监控适用于服务器遍布在多个区域,且需要一个master做统一管理. 搭建环境 服务器 系统: ubuntu 15.04/ubuntu 14.04 ici ...
- 8.HBase In Action 第一章-HBase简介(1.2.2 捕获增量数据)
Data often trickles in and is added to an existing data store for further usage, such as analytics, ...
- zabbix 编译
yum -y install xml* libxml* net-snmp net-snmp* php-bcmath ./configure --enable-server --enable-agent ...
随机推荐
- Node.js使用jszip实现打包zip压缩包
一.前言 最近有这样的一个需求,需要把两个同名的.mtl文件和.obj文件打包成一个同名的.zip压缩包.刚开始文件不多的时候,只有几个,或者十几个,甚至二三十个的时候,还能勉强接受手动修改,但是随着 ...
- python加密
""#line:4 __all__ =[]#line:6 class OO0O0O000O0O0O000 :#line:8 ""#line:9 def __in ...
- Python基础【第一篇】
一.Python简介 Python的创始人(Guido von Rossum 荷兰人),Guido希望有一种语言既能像C一样方便地调用操作系统的功能接口,也能像shell脚本一样,轻松地实现编程,A ...
- iOS 推荐几篇关于Objective-c 动态语言的文章
http://www.cnblogs.com/Mr-Lin/p/5771969.html https://onevcat.com/2012/04/objective-c-runtime/ 我摘抄几句比 ...
- 七天开发进度(六)(微信小程序版(一))
1. 今天主要根据网上教程学习了微信小程序的代码结构,和代码编写-Tabbar配置, 学习了app.js的App和Page方法, 认识了view组件,button组件,input组件,但是还没怎么应用 ...
- CentOS7.6 yum方式安装mysql2.7.25
在CentOS中默认安装有MariaDB,这个是MySQL的分支,但为了需要,还是要在系统中安装MySQL,而且安装完成之后可以直接覆盖掉MariaDB 1 下载并安装MySQL官方的 Yum Rep ...
- django请求生命周期,FBV和CBV,ORM拾遗,Git
一.django 请求生命周期 流程图: 1. 当用户在浏览器中输入url时,浏览器会生成请求头和请求体发给服务端请求头和请求体中会包含浏览器的动作(action),这个动作通常为get或者post, ...
- django第三天
从后台传入一层的字典数据 后台代码 前台代码一 浏览器结果 前台代码二 前台代码三 前台代码四 注意 默认遍历为KEY .values .keys .items 都不加括号
- 加载Assetbundle需要注意的地方
WWW:异步实现,手机上不能用于同步代码,需要监测其完成状态.不用www.dispose. CreateFromFile:阻塞,但是移动平台上面的路径格式有点坑,没时间看,不用. 以下两个方式需要先使 ...
- 探索JavaScript中Null和Undefined的深渊
当讨论JavaScript中的原始数据类型时,大多数人都知道的基本知识,从String,Number到Boolean.这些原始类型相当简单,行为符合常识.但是,本文将更多聚焦独特的原始数据类型Null ...