Performance Tuning Using Linux Process Management Commands
[root@bigdata-server-02 /]# ps --help all
Usage:
ps [options]
Basic options:
-A, -e all processes
-a all with tty, except session leaders
a all with tty, including other users
-d all except session leaders
-N, --deselect negate selection
r only running processes
T all processes on this terminal
x processes without controlling ttys
Selection by list:
-C <command> command name
-G, --Group <GID> real group id or name
-g, --group <group> session or effective group name
-p, p, --pid <PID> process id
--ppid <PID> parent process id
-q, q, --quick-pid <PID>
process id (quick mode)
-s, --sid <session> session id
-t, t, --tty <tty> terminal
-u, U, --user <UID> effective user id or name
-U, --User <UID> real user id or name
The selection options take as their argument either:
a comma-separated list e.g. '-u root,nobody' or
a blank-separated list e.g. '-p 123 4567'
Output formats:
-F extra full
-f full-format, including command lines
f, --forest ascii art process tree
-H show process hierarchy
-j jobs format
j BSD job control format
-l long format
l BSD long format
-M, Z add security data (for SELinux)
-O <format> preloaded with default columns
O <format> as -O, with BSD personality
-o, o, --format <format>
user-defined format
s signal format
u user-oriented format
v virtual memory format
X register format
-y do not show flags, show rss vs. addr (used with -l)
--context display security context (for SELinux)
--headers repeat header lines, one per page
--no-headers do not print header at all
--cols, --columns, --width <num>
set screen width
--rows, --lines <num>
set screen height
Show threads:
H as if they were processes
-L possibly with LWP and NLWP columns
-m, m after processes
-T possibly with SPID column
Miscellaneous options:
-c show scheduling class with -l option
c show true command name
e show the environment after command
k, --sort specify sort order as: [+|-]key[,[+|-]key[,...]]
L show format specifiers
n display numeric uid and wchan
S, --cumulative include some dead child process data
-y do not show flags, show rss (only with -l)
-V, V, --version display version information and exit
-w, w unlimited output width
--help <simple|list|output|threads|misc|all>
display help and exit
For more details see ps(1).
https://likegeeks.com/linux-process-management/
In server administration, it is very important to understand how the running processes work in detail, from high load to slow response time processes. When your server becomes so slow or fails to respond, you should understand the process management or Linux process management in specific to an action.
When it is the time to kill a process or renice it and how to monitor the currently running processes and how these processes affect the system load. Let’s see how Linux process management will help us tune the system.
Memory Management
In server administration, memory management is one of your responsibility that you should care about as a system administrator.
One of most used commands in Linux process management is the free command:
$ free –m
The -m option to show values in megabytes.
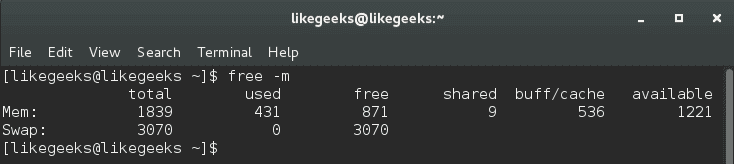
Our main concern in buff/cache.
The output of free command here means 536 megabytes is used while 1221 megabytes is available.
The second line is the swap. Swapping occurs when memory becomes to be crowded.
The first value is the total swap size which is 3070 megabytes.
The second value is the used swap which is 0.
The third value is the available swap for usage which is 3070.
From the above results, you can say that memory status is good since no swap is used, so while we are talking about the swap, let’s discover what proc directory provides us about the swap.
$ cat /proc/swaps
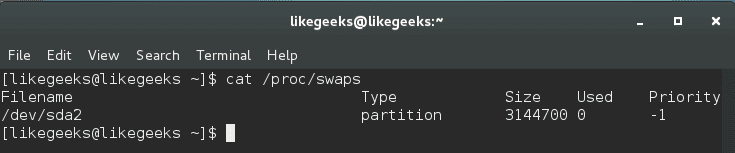
This command shows the swap size and how much is used:
$ cat /proc/sys/vm/swappiness
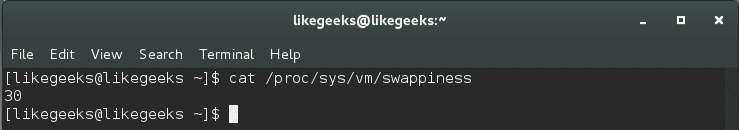
This command shows a value from 0 to 100, this value means the system will use the swap if the memory becomes 70% used.
Notice: the default value for most distros for this value is between 30 and 60, you can modify it like this:
$ echo 50 > /proc/sys/vm/swappiness
Or using sysctl command like this:
$ sudo sysctl -w vm.swappiness=50
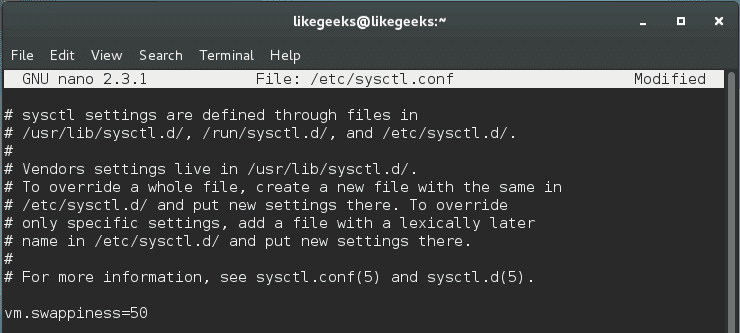
Changing the swappiness value using the above commands is not permanent, you have to write it on /etc/sysctl.conf file like this:
$ nano /etc/sysctl.conf
vm.swappiness=50
Cool!!
The swap level measures the chance to transfer a process from the memory to the swap.
Choosing the accurate swappiness value for your system requires some experimentation to choose the best value for your server.
Managing virtual memory with vmstat
Another important command used in Linux process management which is vmstat. vmstat command gives a summary reporting about memory, processes, and paging.
$ vmstat -a
-a option is used to get all active and inactive processes.
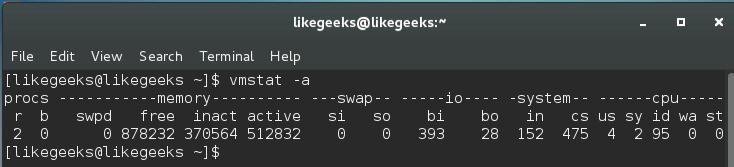
And this is the important column outputs from this command:
si: How much swapped in from disk.
so: How much swapped out to disk.
bi: How much sent to block devices.
bo: How much obtained from block devices.
us: The user time.
sy: The system time.
id: The idle time.
Our main concern is the (si) and (so) columns, where (si) column shows page-ins while (so) column provides page-outs.
A better way to look at these values is by viewing the output with a delay option like this:
$ vmstat 2 5
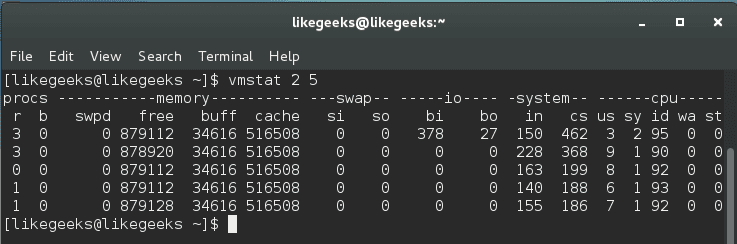
Where 2 is the delay in seconds and 5 is the number of times vmstat is called. It shows five updates of the command and all data is presented in kilobytes.
Page-in (si) happens when you start an application and the information is paged-in. Page out (so) happens when the kernel is freeing up memory.
System Load & top Command
In Linux process management, the top command gives you a list of the running processes and how they are using CPU and memory ; the output is a real-time data.
If you have a dual core system may have the first core at 40 percent and the second core at 70 percent, in this case, the top command may show a combined result of 110 percent, but you will not know the individual values for each core.
$ top -c
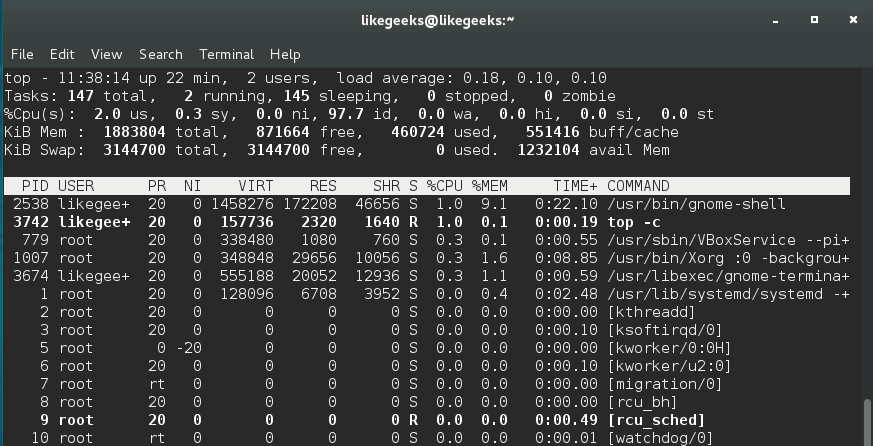
We use -c option to show the command line or the executable path behind that process.
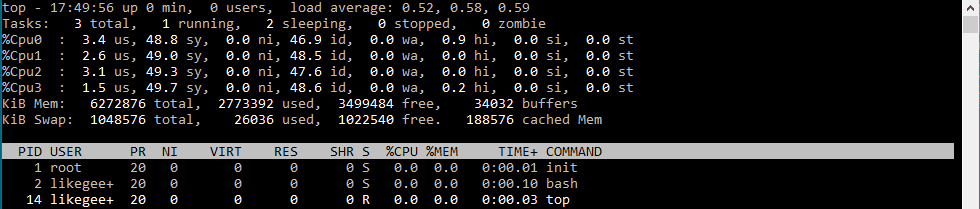
You can press 1 key while you watch the top command statistics to show individual CPU statuses.
Keep in mind that certain processes are spawned like the child processes, you will see multiple processes for the same program like httpd and PHP-fpm.
You shouldn’t rely on top command only, you should review other resources before making a final action.
Monitoring Disk I/O with iotop
The system starts to be slow as a result of high disk activities, so it is important to monitor disk activities. That means figuring out which processes or users cause this disk activity.
The iotop command in Linux process management helps us to monitor disk I/O in real-time. You can install it if you don’t have it:
$ yum install iotop
Running iotop without any options will result in a list all processes.
To view the processes that cause to disk activity, you should use -o option:
$ iotop -o
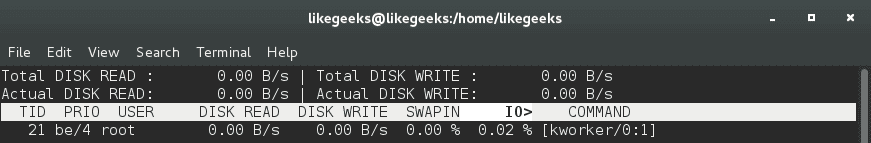
You can easily know what program is impacting the system.
ps command
We’ve talked about ps command before on a previous post and how to order the processes by memory usage and CPU usage.
Monitoring System Health with iostat and lsof
iostat command gives you CPU utilization report; it can be used with -c option to display the CPU utilization report.
$ iostat -c
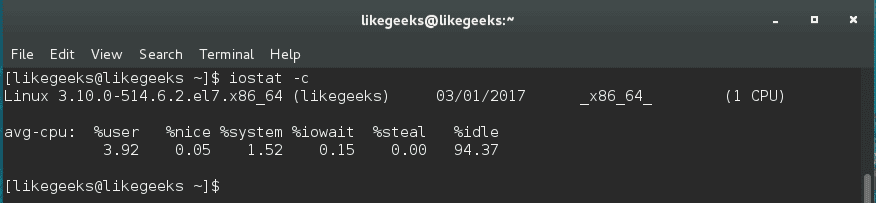
The output result is easy to understand, but if the system is busy, you will see %iowait increases. That means the server is transferring or copying a lot of files.
With this command, you can check the read and write operations, so you should have a solid knowledge of what is hanging your disk and take the right decision.
Additionally, lsof command is used to list the open files:
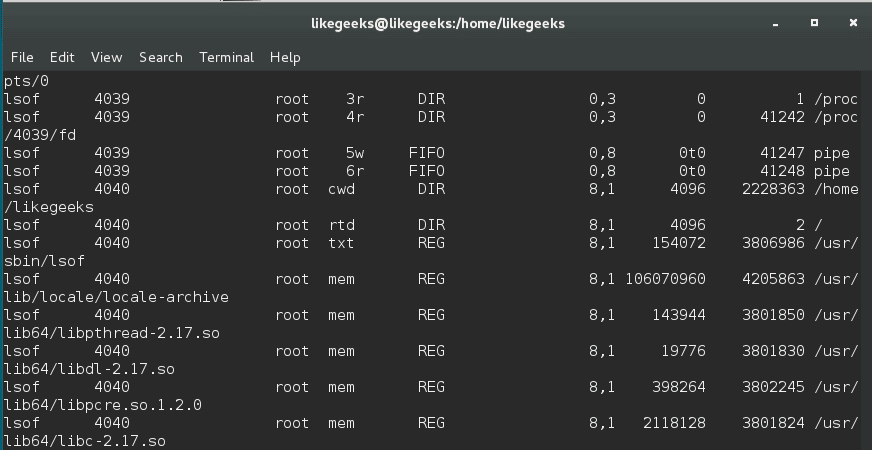
lsof command shows which executable is using the file, the process ID, the user, and the name of the opened file.
Calculating the system load
Calculating system load is very important in Linux process management. The system load is the amount of processing for the system which is currently working. It is not the perfect way to measure system performance, but it gives you some evidence.
The load is calculated like this:
Actual Load = Total Load (uptime) / No. of CPUs
You can calculate the uptime by reviewing uptime command or top command:
$ uptime
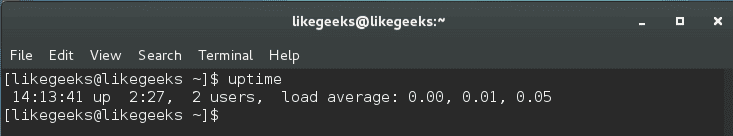
$ top
The server load is shown in 1, 5, and 15 minutes.
As you can see, the average load is 0.00 at the first minute, 0.01 at the fifth minute, and 0.05 at fifteenth minutes.
When the load increases, processors are queued, and if there are many processor cores, the load is distributed equally across the server’s cores to balance the work.
You can say that the good load average is about 1. This does not mean if the load exceeds 1 that there is a problem, but if you begin to see higher numbers for a long time, that means a high load and there is a problem.
pgrep and systemctl
You can get the process ID using pgrep command followed by the service name.
$ pgrep servicename
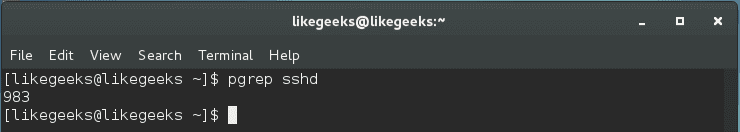
This command shows the process ID or PID.
Note if this command shows more than process ID like httpd or SSH, the smallest process ID is the parent process ID.
On the other hand, you can use the systemctl command to get the main PID like this:
$ systemctl status <service_name>.service
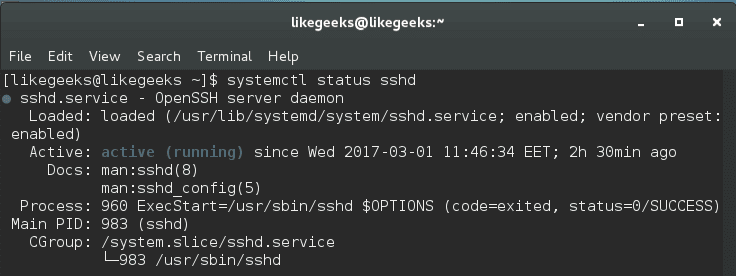
There are more ways to obtain the required process ID or parent process ID, but this one is easy and straight.
Managing Services with systemd
If we are going to talk about Linux process management, we should take a look at systemd. The systemd is responsible for controlling how services are managed on modern Linux systems like CentOS 7.
You can start, stop and check the status like this:
|
1
2
3
4
5
|
$ systemctl status <service_name>.service
$ systemctl stop <service_name>.service
$ systemctl start <service_name>.service
|
Instead of using chkconfig command to enable and disable a service during the boot, you can use the systemctl command:
|
1
2
3
|
$ systemctl enable <service_name>.service
$ systemctl disable <service_name>.service
|
Systemd also ships with its own version of the top command, and in order to show the processes that are associated with a specific service, you can use the system-cgtop command like this:
$ systemd-cgtop
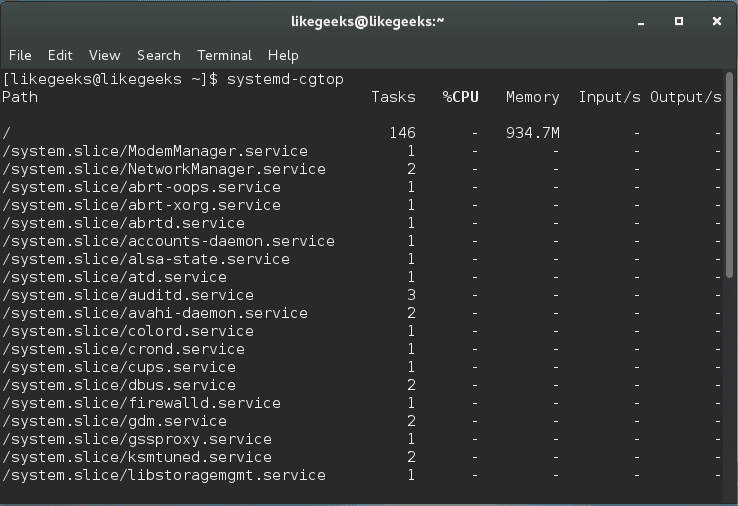
As you can see, all associated processes, path, the number of tasks, the % of CPU used, memory allocation, and the inputs and outputs related.
This command can be used to output a recursive list of service content like this:
$ systemd-cgls

This command gives us very useful information that can be used to make your decision.
Nice and Renice Processes
The process nice value is a numeric indication that belongs to the process and how it’s fighting for the CPU.
A high nice value indicates a low priority for your process, so how nice you are going to be to other users, and from here the name came.
The nice range is from -20 to +19.
nice command sets the nice value for a process at creation time, while renice command adjusts the value later.
$ nice –n 5 ./myscript
This command increases the nice value which means lower priority by 5.
$ sudo renice -5 2213
This command decreases the nice value means increased priority and the number (2213) is the PID.
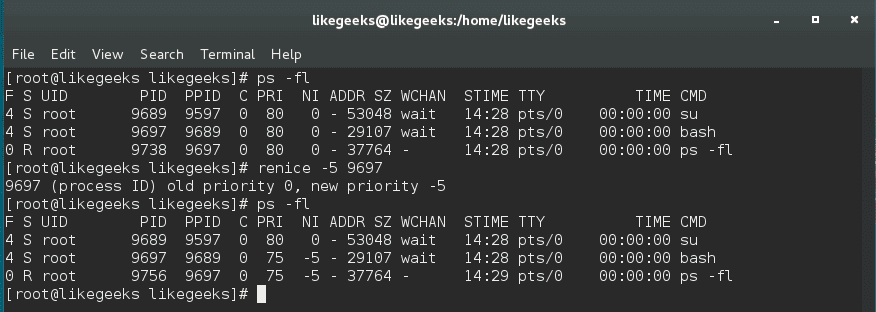
You can increase its nice value (lower priority) but cannot lower it (high priority) while root user can do both.
Sending the kill signal
To kill a service or application that causes a problem, you can issue a termination signal (SIGTERM). You can review the previous post about signals and jobs.
$ kill process ID
This method is called safe kill. However, depending on your situation, maybe you need to force a service or application to hang up like this:
$ kill -1 process ID
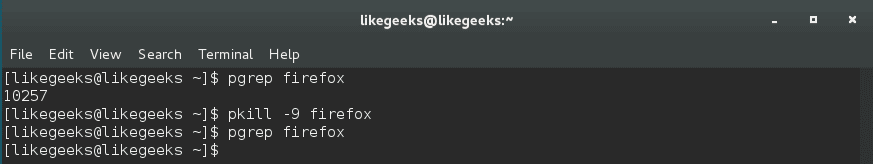
Sometimes the safe killing and reloading fail to do anything, you can send kill signal SIGKILL by using -9 option which is called forced kill.
$ kill -9 process ID
There are no cleanup operations or safe exit with this command and not preferred. However, you can do something more proper by using the pkill command.
$ pkill -9 serviceName
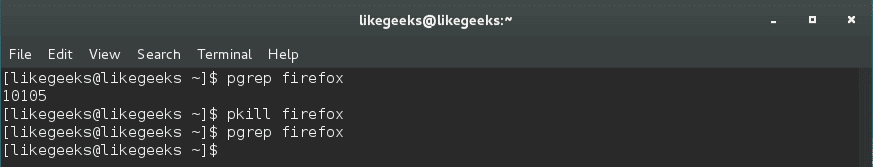
And you can use pgrep command to ensure that all associated processes are killed.
$ pgrep serviceName
I hope you have a good idea about Linux process management and how to make a good action to make the system healthy.
Performance Tuning Using Linux Process Management Commands的更多相关文章
- Linux Process Management && Process Scheduling Principle
目录 . 引言 . 进程优先级 . 进程的生命周 . 进程表示 . 进程管理相关的系统调用 . 进程调度 . 完全公平调度类 . 实时调度类 . 调度器增强 . 小结 1. 引言 在多处理器系统中,可 ...
- linux process management
CREAT PROCESS fork() | clone(參数,决定父子函数的共享内容) | do_fork() | copy_process() | dup_task_struct() 创建子进程的 ...
- PostgreSQL Hardware Performance Tuning
Bruce Momjian POSTGRESQL is an object-relational database developed on the Internet by a group of de ...
- Monitoring and Tuning the Linux Networking Stack: Receiving Data
http://blog.packagecloud.io/eng/2016/06/22/monitoring-tuning-linux-networking-stack-receiving-data/ ...
- MySQL Performance Tuning: Tips, Scripts and Tools
With MySQL, common configuration mistakes can cause serious performance problems. In fact, if you mi ...
- Performance Tuning guide 翻译 || Performance Tuning Guide 11G中新增特性
CSDN 对格式支持比較弱.能够到http://user.qzone.qq.com/88285879/blog/1399382878 看一致的内容. Performance Tuning Guide ...
- 老李分享: Oracle Performance Tuning Overview 翻译下
1.2性能调优特性和工具 Effective data collection and analysis isessential for identifying and correcting perfo ...
- 老李分享: Oracle Performance Tuning Overview 翻译
老李分享: Oracle Performance Tuning Overview 翻译 poptest是国内唯一一家培养测试开发工程师的培训机构,以学员能胜任自动化测试,性能测试,测试工具开发等工 ...
- Performance Tuning
本文译自Wikipedia的Performance tuning词条,原词条中的不少链接和扩展内容非常值得一读,翻译过程中暴露了个人工程学思想和英语水平的不足,翻译后的内容也失去很多准确性和丰富性,需 ...
随机推荐
- 制作不随浏览器滚动的DIV-带关闭按钮
制作不随浏览器滚动的DIV 效果见 http://bbs.csdn.net/topics/90292438 的滚动效果. $(function(){ //获取要定位元素距离浏览器顶部的距离 var ...
- LeetCode OJ--Search for a Range
http://oj.leetcode.com/problems/search-for-a-range/ 要求复杂度为O(lgn),用二分查找的思想. #include <iostream> ...
- js-jquery 中$.ajax -浅显接触
工作了将近2年,终于开始自己写ajax了!!!真紧张的! 当年培训时就没有学ajax,就让我们自己看看,我是那种主动学习的人吗?不是!!!所以搞不懂ajax!!!!! 在工作中,数据的绑定我们之前都是 ...
- HDU6214 Smallest Minimum Cut
题目链接:HDU6214 留一个链式前向星+Dinic模板(希望不要被某人发现,嘿嘿嘿). #include <cstdio> #include <cstring> #incl ...
- HDU 6206 Apple
题目链接:http://acm.hdu.edu.cn/showproblem.php?pid=6206 判断给定一点是否在三角形外接圆内. 给定三角形三个顶点的坐标,如何求三角形的外心的坐标呢? 知乎 ...
- Codeforces Gym101502 I.Move Between Numbers-最短路(Dijkstra优先队列版和数组版)
I. Move Between Numbers time limit per test 2.0 s memory limit per test 256 MB input standard inpu ...
- jenkins发布普通项目、配置自动上线自动部署
1.以root用户运行jenkins是不专业的 刚开始用jenkins时用jenkins这个普通用户运行程序,始终无法连接到gitlab,报错如下: 先是把修改jenkins上的git路径,将git修 ...
- codeforces A. In Search of an Easy Problem
A. In Search of an Easy Problem time limit per test 1 second memory limit per test 256 megabytes inp ...
- Java RSA 加密 解密 签名 验签
原文:http://gaofulai1988.iteye.com/blog/2262802 import java.io.FileInputStream; import java.io.FileOut ...
- iOS开发 CGBitmapContextCreate
最近项目中,需要对图片进行各种操作. 使用CGBitmapContextCreate 创建位图上下文. CG_EXTERN CGContextRefCGBitmapContextCreate(void ...