DSP using MATLAB 示例 Example3.11

用到的性质

上代码:
n = -5:10; x = rand(1,length(n));

k = -100:100; w = (pi/100)*k;                 % freqency between -pi and +pi  ,   [0,pi] axis divided into 101 points.

X = x * (exp(-j*pi/100)) .^ (n'*k);           % DTFT of x

% folding property

y = fliplr(x); m = -fliplr(n);                         % signal folding

Y = y * (exp(-j*pi/100)) .^ (m'*k);           % DTFT of y

magX = abs(X); angX = angle(X); realX = real(X); imagX = imag(X);

magY = abs(Y); angY = angle(Y); realY = real(Y); imagY = imag(Y);

%verification

Y_check = fliplr(X);                                   % X(-w)

error = max(abs(Y-Y_check));                  % Difference

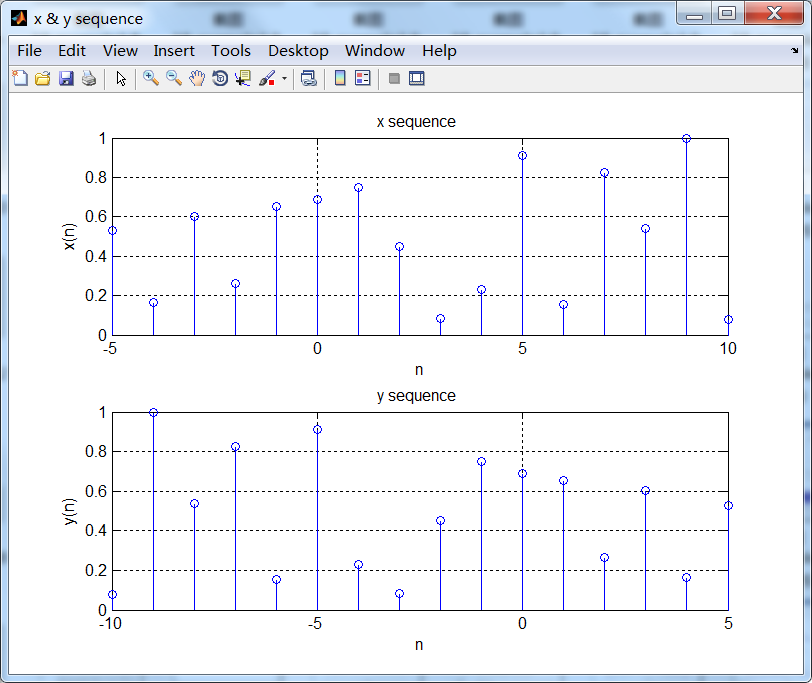
figure('NumberTitle', 'off', 'Name', 'x & y sequence')

set(gcf,'Color','white');

subplot(2,1,1); stem(n,x); title('x sequence ');         xlabel('n'); ylabel('x(n)'); grid on;

%subplot(2,2,2); stem(n,imag(x)); title('x sequence Imaginary Part');    xlabel('n'); ylabel('Imaginary x(n))'); grid on;

subplot(2,1,2); stem(m,y); title('y sequence ');         xlabel('n'); ylabel('y(n)'); grid on;

%subplot(2,2,4); stem(n,imag(y)); title('y sequence Imaginary Part');    xlabel('n'); ylabel('Imaginary y(n))'); grid on;

%% --------------------------------------------------------------

%%        START X's  mag ang real imag

%% --------------------------------------------------------------

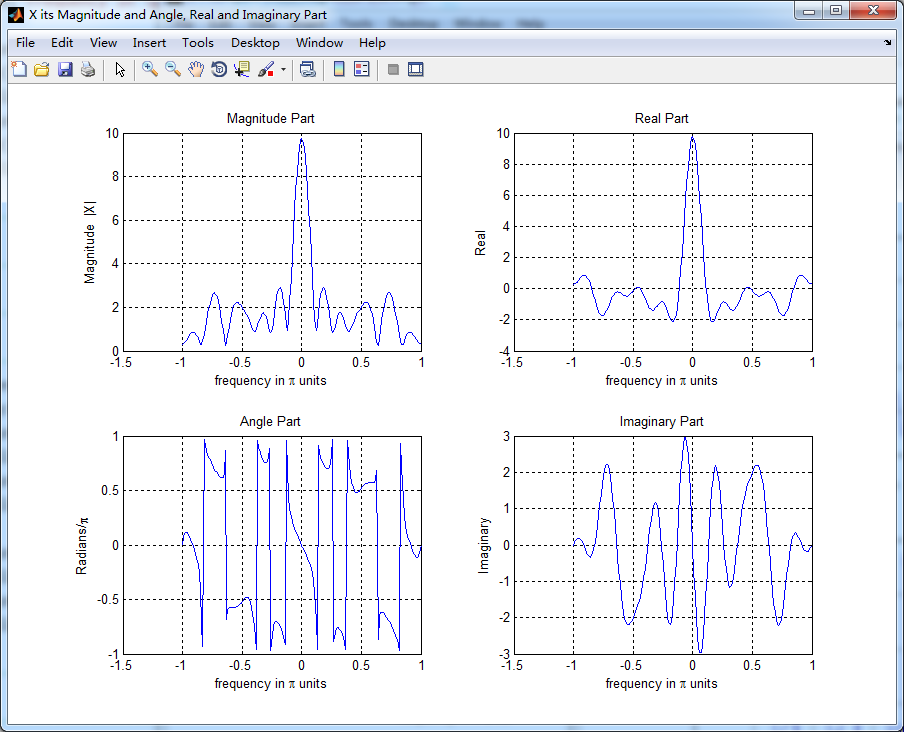
figure('NumberTitle', 'off', 'Name', 'X its Magnitude and Angle, Real and Imaginary Part');

set(gcf,'Color','white');

subplot(2,2,1); plot(w/pi,magX); grid on;  % axis([-2,2,0,15]);

title('Magnitude Part');

xlabel('frequency in \pi units'); ylabel('Magnitude  |X|');

subplot(2,2,3); plot(w/pi, angX/pi); grid on;  % axis([-2,2,-1,1]);

title('Angle Part');

xlabel('frequency in \pi units'); ylabel('Radians/\pi');

subplot('2,2,2'); plot(w/pi, realX); grid on;

title('Real Part');

xlabel('frequency in \pi units'); ylabel('Real');

subplot('2,2,4'); plot(w/pi, imagX); grid on;

title('Imaginary Part');

xlabel('frequency in \pi units'); ylabel('Imaginary');

%% --------------------------------------------------------------

%%        END X's  mag ang real imag

%% --------------------------------------------------------------

%% --------------------------------------------------------------

%%        START Y's  mag ang real imag

%% --------------------------------------------------------------

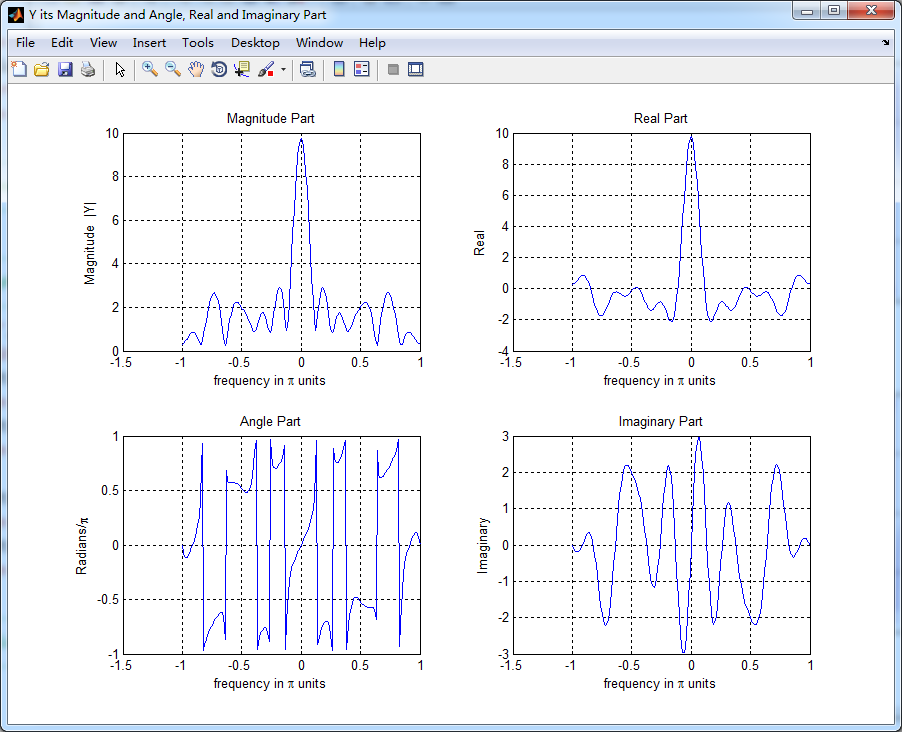
figure('NumberTitle', 'off', 'Name', 'Y its Magnitude and Angle, Real and Imaginary Part');

set(gcf,'Color','white');

subplot(2,2,1); plot(w/pi,magY); grid on;  % axis([-2,2,0,15]);

title('Magnitude Part');

xlabel('frequency in \pi units'); ylabel('Magnitude  |Y|');

subplot(2,2,3); plot(w/pi, angY/pi); grid on;  % axis([-2,2,-1,1]);

title('Angle Part');

xlabel('frequency in \pi units'); ylabel('Radians/\pi');

subplot('2,2,2'); plot(w/pi, realY); grid on;

title('Real Part');

xlabel('frequency in \pi units'); ylabel('Real');

subplot('2,2,4'); plot(w/pi, imagY); grid on;

title('Imaginary Part');

xlabel('frequency in \pi units'); ylabel('Imaginary');

%% --------------------------------------------------------------

%%        END Y's  mag ang real imag

%% --------------------------------------------------------------

%% ----------------------------------------------------------------

%%        START Graphical verification

%% ----------------------------------------------------------------

figure('NumberTitle', 'off', 'Name', 'X Y compare theirs Magnitude and Angle');

set(gcf,'Color','white');

subplot(2,2,1); plot(w/pi,magX); grid on; %axis([-1,1,0,12]);

xlabel('frequency in \pi units'); ylabel('|X|'); title('Magnitude of X ');

subplot(2,2,2); plot(w/pi,angX/pi); grid on; axis([-1,1,-1,1]);

xlabel('frequency in \pi units'); ylabel('Radians/\pi'); title('Angle of X ');

subplot(2,2,3); plot(w/pi,magY); grid on; %axis([-1,1,0,12]);

xlabel('frequency in \pi units'); ylabel('|Y|'); title('Magnitude of Y ');

subplot(2,2,4); plot(w/pi,angY/pi); grid on; axis([-1,1,-1,1]);

xlabel('frequency in \pi units'); ylabel('Radians/\pi'); title('Angle of Y ');

%% ----------------------------------------------------------------

%%        END Graphical verification

%% ----------------------------------------------------------------
运行结果:


DSP using MATLAB 示例 Example3.11的更多相关文章
- DSP using MATLAB 示例Example3.21
代码: % Discrete-time Signal x1(n) % Ts = 0.0002; n = -25:1:25; nTs = n*Ts; Fs = 1/Ts; x = exp(-1000*a ...
- DSP using MATLAB 示例 Example3.19
代码: % Analog Signal Dt = 0.00005; t = -0.005:Dt:0.005; xa = exp(-1000*abs(t)); % Discrete-time Signa ...
- DSP using MATLAB示例Example3.18
代码: % Analog Signal Dt = 0.00005; t = -0.005:Dt:0.005; xa = exp(-1000*abs(t)); % Continuous-time Fou ...
- DSP using MATLAB 示例Example3.23
代码: % Discrete-time Signal x1(n) : Ts = 0.0002 Ts = 0.0002; n = -25:1:25; nTs = n*Ts; x1 = exp(-1000 ...
- DSP using MATLAB示例Example3.16
代码: b = [0.0181, 0.0543, 0.0543, 0.0181]; % filter coefficient array b a = [1.0000, -1.7600, 1.1829, ...
- DSP using MATLAB 示例Example3.8
代码: x = rand(1,11); n = 0:10; k = 0:500; w = (pi/500)*k; % [0,pi] axis divided into 501 points. X = ...
- DSP using MATLAB 示例Example3.7
上代码: x1 = rand(1,11); x2 = rand(1,11); n = 0:10; alpha = 2; beta = 3; k = 0:500; w = (pi/500)*k; % [ ...
- DSP using MATLAB 示例Example3.22
代码: % Discrete-time Signal x2(n) Ts = 0.001; n = -5:1:5; nTs = n*Ts; Fs = 1/Ts; x = exp(-1000*abs(nT ...
- DSP using MATLAB 示例Example3.17
随机推荐
- 【Git】标签管理
来源:廖雪峰 为什么要标签: 发布一个版本时,我们通常先在版本库中打一个标签(tag),这样,就唯一确定了打标签时刻的版本.将来无论什么时候,取某个标签的版本,就是把那个打标签的时刻的历史版本取出来. ...
- 【Git】笔记5 分支管理2
来源:廖雪峰 通常,合并分支时,如果可能,Git会用Fast forward模式,但这种模式下,删除分支后,会丢掉分支信息. 如果要强制禁用Fast forward模式,Git就会在merge时生成一 ...
- 解决ERROR 2003 (HY000): Can't connect to MySQL server on
方案一: .打开cmd; .输入命令:net stop +MySQL的服务名,停止MySQL服务,如果未启动MySQL服务则可跳过该步骤: .输入命令:mysqld --remove卸载MySQL服务 ...
- linux more AND less
================================more================================ more 是我们最常用的工具之一,最常用的就是显示输出的内容, ...
- 模拟赛1103d1
取模(mod) [题目描述] 有一个整数a和n个整数b_1, -, b_n.在这些数中选出若干个数并重新排列,得到c_1,-, c_r.我们想保证a mod c_1 mod c_2 mod - mod ...
- Mysql子查询
1单值(Scalar operand) 只有当外层(Parent)不为空时,才返回相应值:否则返回NULL. note:For the subquery just shown, if t1 were ...
- 类模板的static成员
下列代码可以通过编译吗?如何修改使其通过编译? template <class T> struct sum { static void foo(T op1 , T op2){ c ...
- Java实现颜色渐变效果
RGB色彩,在自然界中肉眼所能看到的任何色彩都可以由红(R).绿(G).蓝(B)这三种色彩混合叠加而成,因此我们只要递增递减的修改其特定值就能得到相应的渐变效果. 运行效果:(图1) 运行5秒后:(图 ...
- Android缓存学习入门(二)
本文主要包括以下内容 内存缓存策略 文件缓存策略 内存缓存策略 当有一个图片要去从网络下载的时候,我们并不会直接去从网络下载,因为在这个时代,用户的流量是宝贵的,耗流量的应用是不会得到用户的青睐的.那 ...
- web项目没有run on server时..
文章转载至:http://blog.csdn.net/hongchangfirst/article/details/7722703 web项目没有run on server 1.首先确保正确安装Tom ...
