Announcing the Updated NGINX and NGINX Plus Plug‑In for New Relic (Version 2)
In March, 2013 we released the first version of the “nginx web server” plug‑in for New Relic monitoring of the open source NGINX software and NGINX Plus. Since then, we’ve received lots of interest from users – we greatly appreciate it! The plug‑in continues to be one of the most popular New Relic plug‑ins, in spite of the few things that (we believe!) could be improved. If you don’t already have a New Relic account, sign up as a NewRelic “Friend with benefits”.
We selected Ruby as the base language for the original plug‑in, because the New Relic platform itself is written in Ruby, the API was not yet published, and many things were changing quickly.
Later, after the launch of the New Relic platform, we continued to work on adding a number of improvements based on users’ feedback and our own vision of how to improve the overall usability of the NGINX monitoring plug‑in, and realized the need for further changes.
What’s New?
Today, we are pleased to announce a major update of the NGINX plug‑in for New Relic, version 2.0, which includes the following changes:
- The plug‑in is rewritten in Python. You no longer need to install Ruby.
- The plug‑in is finally packaged. There are prebuilt packages for RHEL/CentOS‑based and Debian/Ubuntu‑based systems. An included init script enables you to easily set up autostart of the plug‑in.
There are two new sections in the live activity monitoring dashboard, for NGINX Plus customers:
- Servers – Additional summary counters for virtual servers whose
serverconfiguration block includes thestatus_zonedirective - Cache – Cumulative stats for all configured caches
- Servers – Additional summary counters for virtual servers whose
- Verbose logging is enabled by default.
Installation
Download the plug‑in and installation instructions.
Configuring the Plug‑In
The configuration file for the NGINX plug‑in is /etc/nginx-nr-agent/nginx-nr-agent.ini. The minimal configuration includes:
Your New Relic license key in the
newrelic_license_keystatement in theglobalsection.At least one
sourcesection. The name of the section is used in log entries only, and can contain almost any character string you want. Two parameters are required:name– NGINX instance name in the New Relic UI.url– Full URL to the corresponding instance. The plug‑in accepts source data in the format generated when thestub_statusdirective is included in the configuration of NGINX or NGINX Plus. It also supports the JSON‑formatted output generated when thestatusdirective is included in an NGINX Plus configuration.
You can include the optional http_user and http_pass statements to set HTTP basic authentication credentials in cases where the corresponding location is protected by the NGINX auth_basic directive.
The default log file is /var/log/nginx-nr-agent.log.
Running the Plug‑In
You can manage the plug‑in with an init script. Run the service nginx-nr-agent command with the start, stop, or status argument to start, stop, or display the status of the plug‑in, respectively.
When started from an init script, the plug‑in daemon runs as the nobody user.
You can start the plug‑in directly by running /usr/bin/nginx-nr-agent.py, with the following optional parameters:
-c,--config– Path to configuration file-p,--pidfile> – Path to PID file-f,--foreground– Do not detach from terminal (useful for debugging)
If everything is working as expected, the plug‑in appears as a tab in the New Relic UI:

Dashboard Examples
Overview
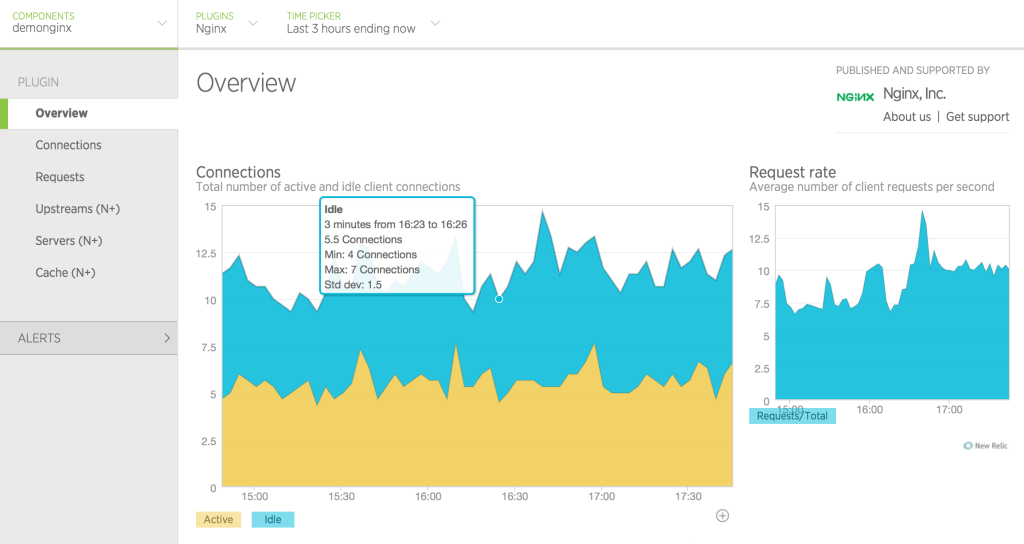
The Overview tab displays the most basic metrics for the whole instance: number of active and idle connections, and request rate.
Connections
The Connections tab displays various metrics about client connections.

Requests
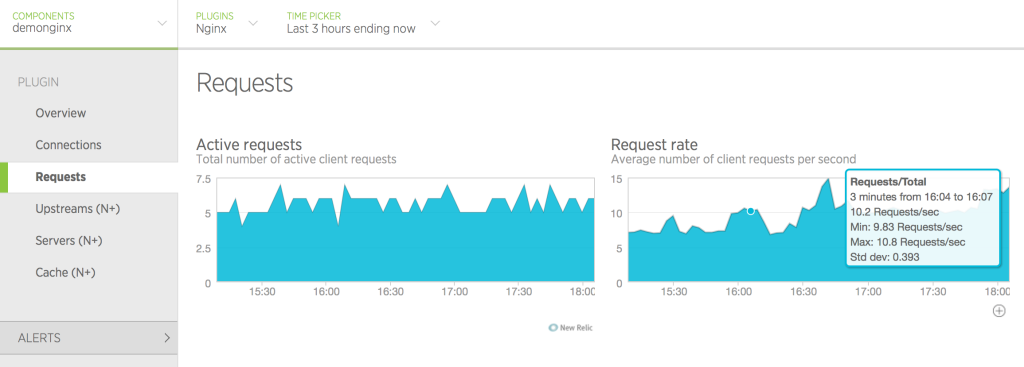
The Requests tab displays the number of requests currently being processed and the overall request rate.
Upstreams (NGINX Plus only)
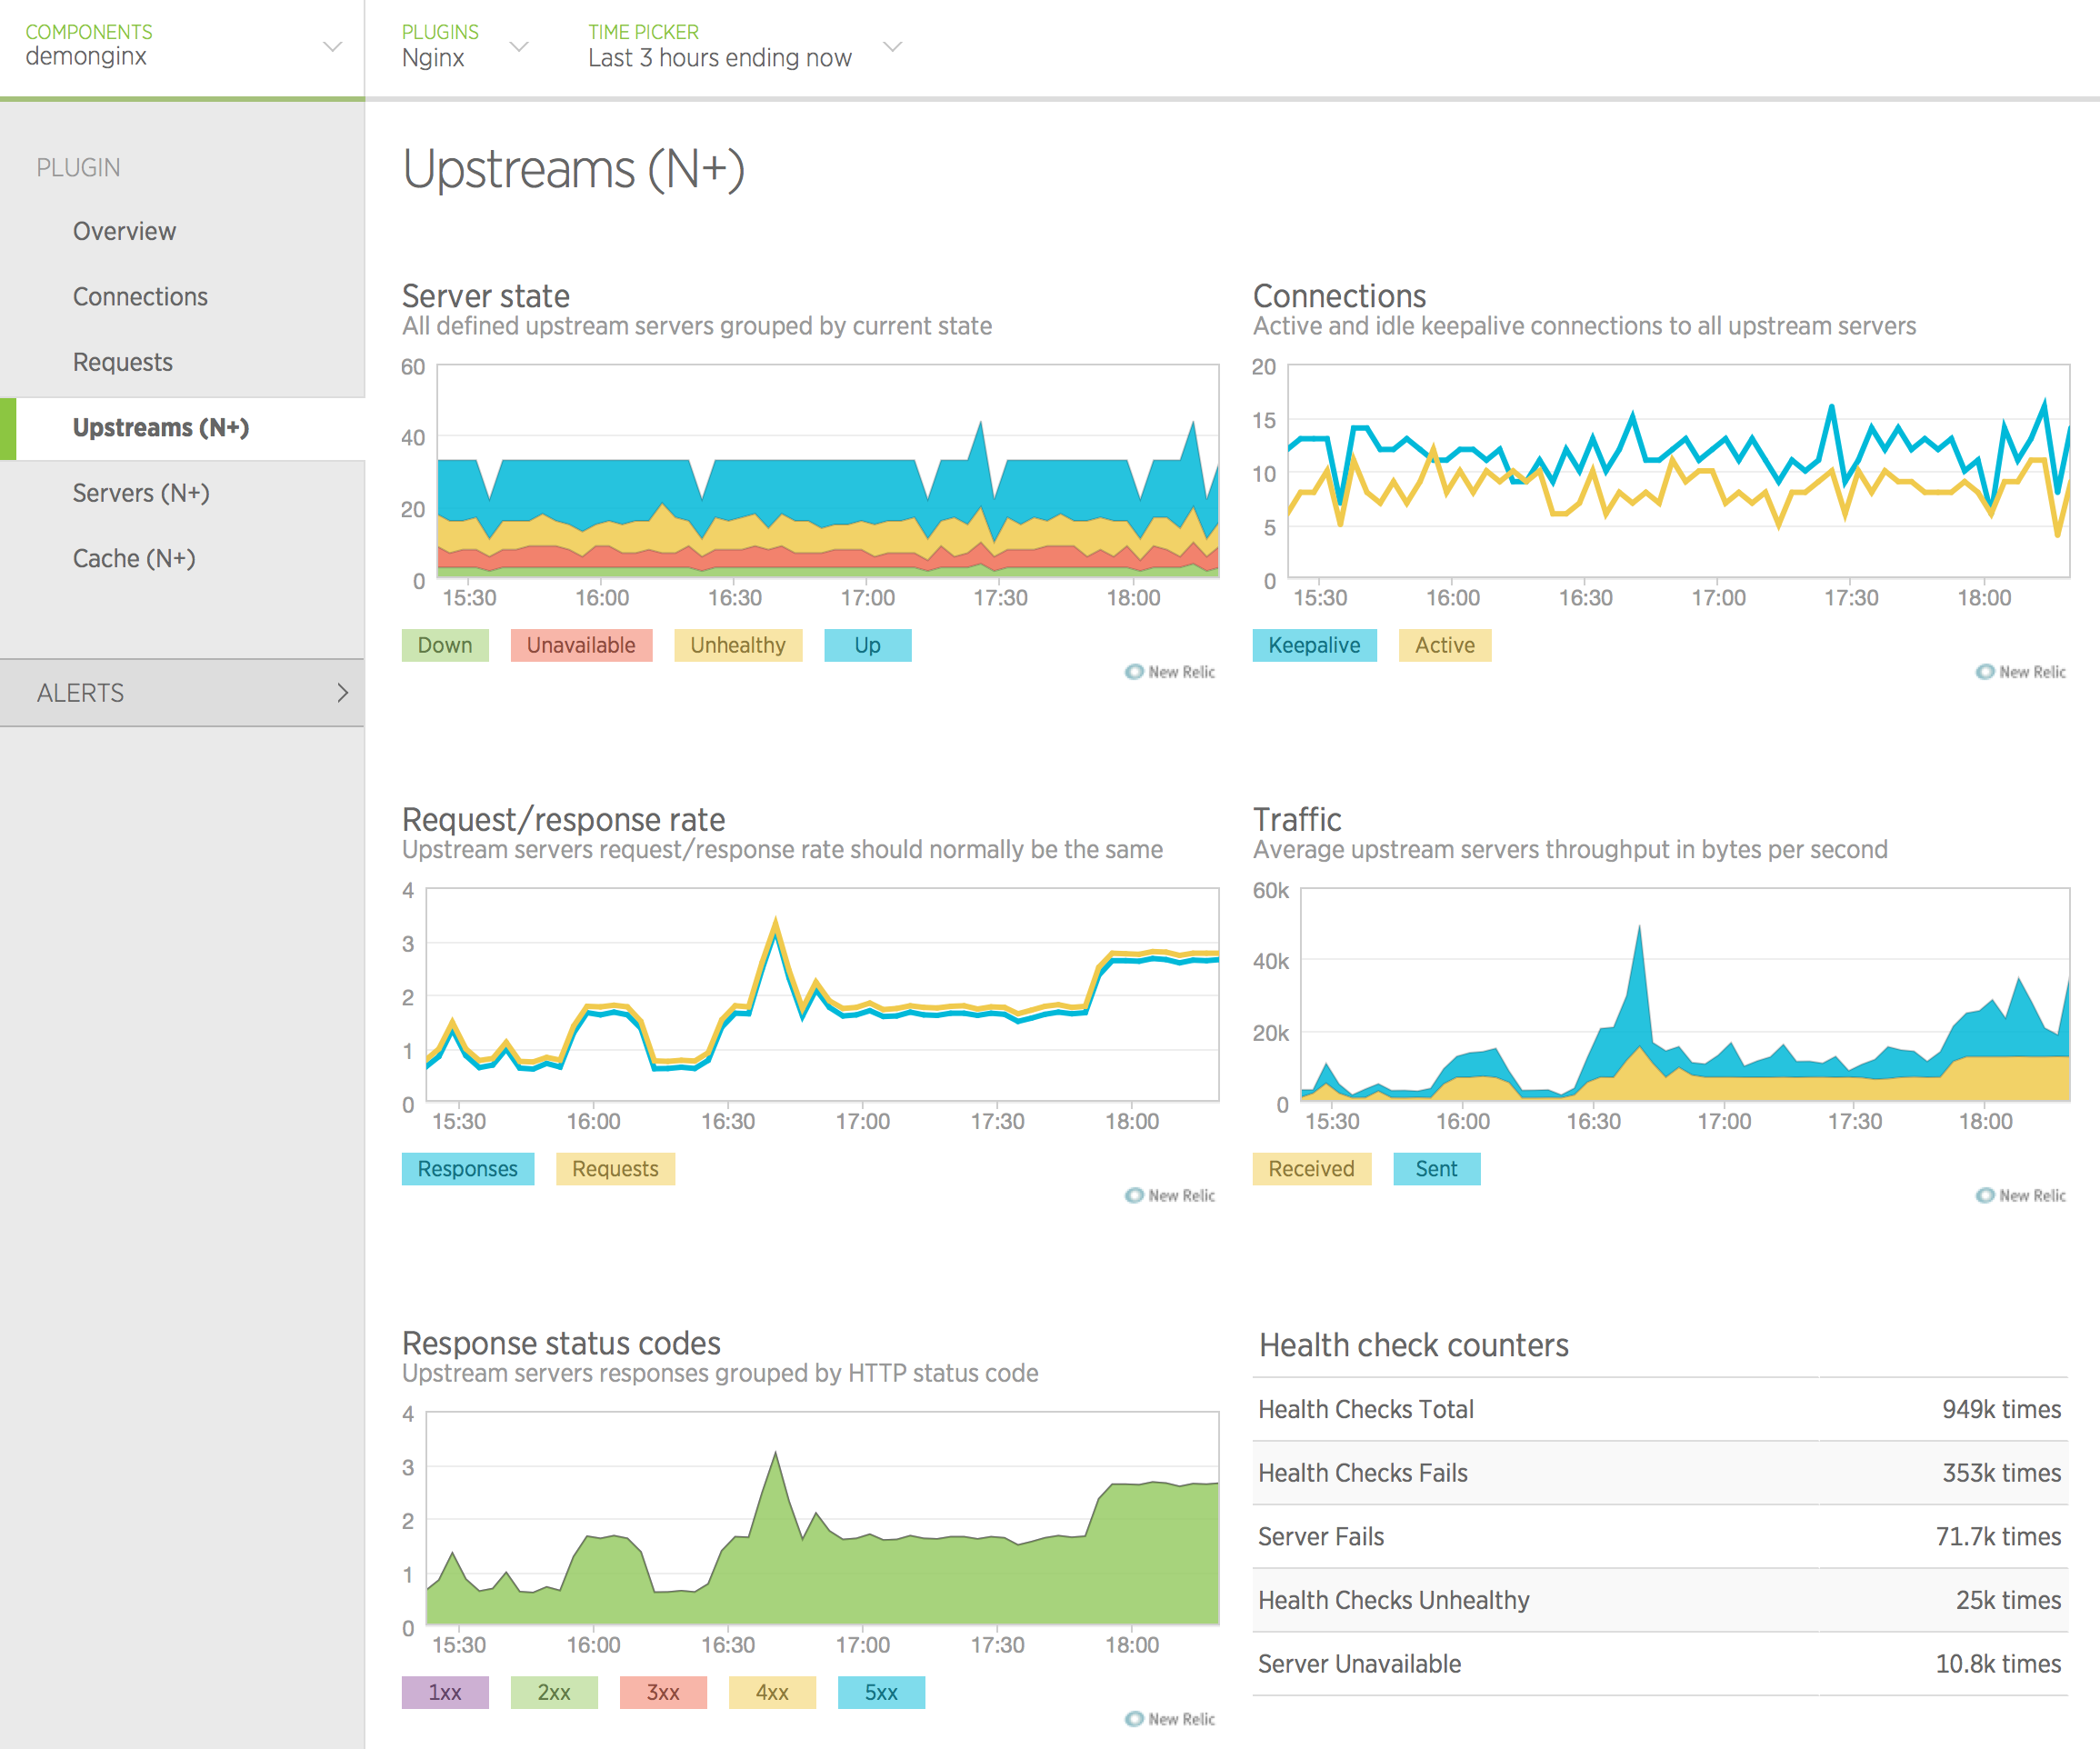
The Upstreams tab displays detailed statistics about all configured upstream groups.
Servers (NGINX Plus only)
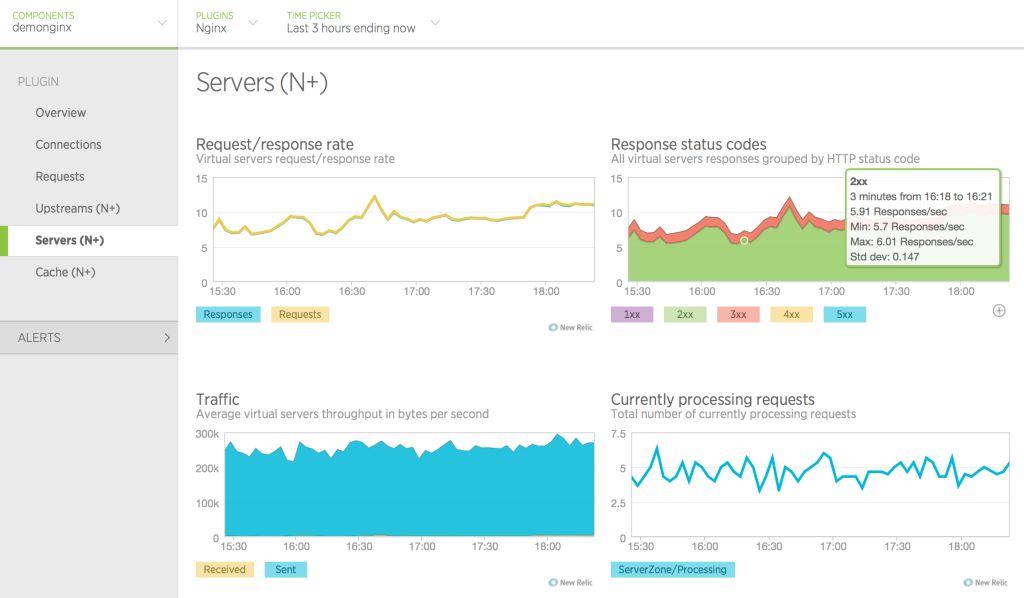
The Servers tab displays detailed statistics about all configured virtual server zones.
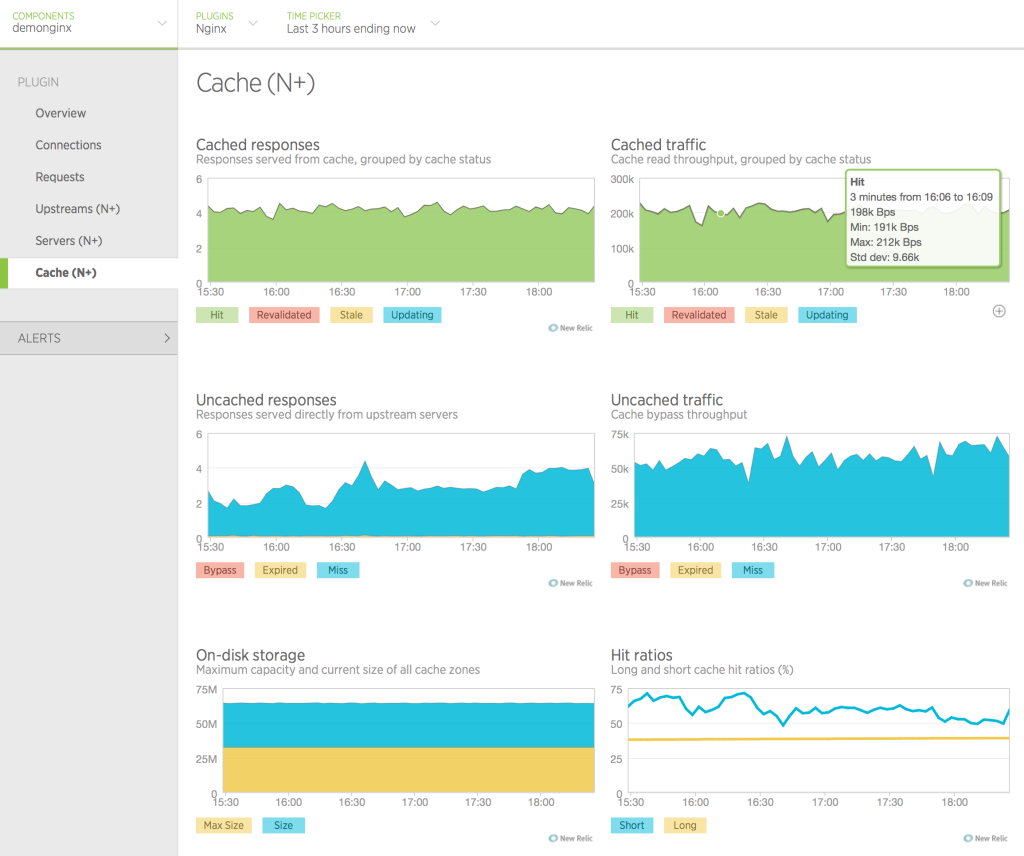
Cache (NGINX Plus only)
The Cache tab displays summary statistics for all configured caches.
What’s Next?
We plan to extend the plug‑in’s functionality with additional metrics for both NGINX and NGINX Plus, and your feedback is very important to us. Ideas, thoughts, questions? Let us know by commenting on this post.
Thanks for using NGINX and NGINX Plus!
To try NGINX Plus, start your free 30-day trial today or contact us.
Announcing the Updated NGINX and NGINX Plus Plug‑In for New Relic (Version 2)的更多相关文章
- Nginx之一:Nginx的编译安装
一.Nginx简介 官方网址:http://nginx.org/ Nginx是由1994年毕业于俄罗斯国立莫斯科鲍曼科技大学的同学为俄罗斯rambler.ru公司开发的,开发工作最早从2002年开始, ...
- Nginx配置文件nginx.conf中文详解(转)
######Nginx配置文件nginx.conf中文详解##### #定义Nginx运行的用户和用户组 user www www; #nginx进程数,建议设置为等于CPU总核心数. worker_ ...
- 苹果下如果安装nginx,给nginx安装markdown第三方插件
用brew install nginx 这样安装的是最新版的nginx, 但是在有些情况下,安装第三方插件需要特定的版本,更高一级的版本可能装不上. 它的原理是下载安装包进行自动安装,建立软链,这样就 ...
- Nginx research, nginx module development
catalog . 初探nginx架构 . handler模块 . Nginx编译.安装.配置 . Hello World模块开发 1. 初探nginx架构 nginx在启动后,在unix系统中会以d ...
- 通过Nginx和Nginx Plus阻止DDoS攻击
分布式拒绝服务攻击(DDoS)指的是通过多台机器向一个服务或者网站发送大量看似合法的数据包使其网络阻塞.资源耗尽从而不能为正常用户提供正常服务的攻击手段.随着互联网带宽的增加和相关工具的不断发布,这种 ...
- 解决Nginx: [error] open() "/usr/local/Nginx/logs/Nginx.pid
重新启动服务器,访问web服务发现无法浏览啦!登陆服务器之后进到nginx使用./nginx -s reload重新读取配置文件,发现报nginx: [error] open() "/usr ...
- nginx: [error] invalid PID number "" in "/usr/local/nginx/logs/nginx.pid"
iwangzheng.com tty:[0] jobs:[0] cwd:[/opt/nginx/conf] 12:45 [root@a02.cmsapi]$ /usr/local/nginx/sbin ...
- Nginx 报错: nginx: [error] open() "/usr/local/nginx/logs/nginx.pid" failed (2: No such file or directory) 的解决方法
今天测试域名访问不了,登陆 Linux(Ubuntu)重启Nginx: nginx -s reload 结果报错: nginx: [error] open() : No such file or di ...
- 解决nginx: [error] open() "/usr/local/nginx/logs/nginx.pid" failed错误
重新启动服务器,访问web服务发现无法浏览,登陆服务器之 后进到nginx使用./nginx -s reload重新读取配置文件,发现报nginx: [error] open() "/usr ...
随机推荐
- .NET CORE实践(1)--Ubuntu下的Hello World
准备工作 使用Hyper-V安装Ubuntu16.04桌面版 因为是作为类似日记的记录,所以写的时候事无巨细,稍显啰嗦. 打开微软.NET官网 apt-get install 打开dotnetcore ...
- [转]Rancher 1.6 Docs
本文转自:https://rancher.com/docs/rancher/v1.6/zh/quick-start-guide/ 快速安装指南 在本节中,我们将进行简单快速的Rancher安装,即在一 ...
- [PHP] 理解依赖注入
两个类有依赖关系的时候 使用者通过构造函数参数,方法或属性等方式将具体组件,传给自己 $storage=new Storge(); //构造函数注入 class User{ public functi ...
- 慢查询日志工具mysqlsla的使用
安装mysqlsla源码路径:https://github.com/daniel-nichter/hackmysql.com源码存放路径:/usr/local/src1.获取源码如果没有git命令,请 ...
- 【Java每日一题】20170224
20170223问题解析请点击今日问题下方的“[Java每日一题]20170224”查看(问题解析在公众号首发,公众号ID:weknow619) package Feb2017; import jav ...
- (9)Microsoft office Word 2013版本操作入门_文本框_word排版
1.插入文本框 :[插入]---[文本框]可以自己画,也可以选择已有的模板 2.文本框设置 :点中文本框选择[格式]---[对齐文本]可以让文字上下居中,[形状填充]填充不同的颜色.[形状轮廓]可以改 ...
- nodeJs express mongodb 建站(window 10 版)
一.环境搭建 安装 node.git.npm.express.mongodb.主要介绍express.mongodb 的安装. (1)node安装:https://nodejs.org/en/down ...
- angularJs学习笔记-入门
1.angularJs简介 angularJs是一个MV*的javascript框架(Model-View-Whatever,不管是MVVM还是MVC,统归MDV(model drive view)) ...
- PHP7.27: pdf
http://www.fpdf.org/ https://github.com/Setasign/FPDF https://www.ntaso.com/fpdf-and-chinese-charact ...
- SAP MM 按采购订单查询付款信息的报表?
SAP MM 按采购订单查询付款信息的报表? 上午给P3项目采购部门用户做了一个采购相关的报表的培训.培训过程中,客户的采购部门经理提出了一个问题:有没有报表能查询到各个采购订单的付款情况,显示采购订 ...
