Matplotlib绘图设置--- 图例设置
plt.legend()和ax.legend()参数设置
自动会将每条线的标签与其风格、颜色进行匹配。
plt.legend(*args, **kwargs)

Place a legend on the axes.

Call signatures::

    legend()

    legend(labels)

    legend(handles, labels)

The call signatures correspond to three different ways how to use

this method.

**1. Automatic detection of elements to be shown in the legend**

The elements to be added to the legend are automatically determined,

when you do not pass in any extra arguments.

In this case, the labels are taken from the artist. You can specify

them either at artist creation or by calling the

:meth:`~.Artist.set_label` method on the artist::

    line, = ax.plot([1, 2, 3], label='Inline label')

    ax.legend()

or::

    line, = ax.plot([1, 2, 3])

    line.set_label('Label via method')

    ax.legend()

Specific lines can be excluded from the automatic legend element

selection by defining a label starting with an underscore.

This is default for all artists, so calling `Axes.legend` without

any arguments and without setting the labels manually will result in

no legend being drawn.

**2. Labeling existing plot elements**

To make a legend for lines which already exist on the axes

(via plot for instance), simply call this function with an iterable

of strings, one for each legend item. For example::

    ax.plot([1, 2, 3])

    ax.legend(['A simple line'])

Note: This way of using is discouraged, because the relation between

plot elements and labels is only implicit by their order and can

easily be mixed up.

**3. Explicitly defining the elements in the legend**

For full control of which artists have a legend entry, it is possible

to pass an iterable of legend artists followed by an iterable of

legend labels respectively::

    legend((line1, line2, line3), ('label1', 'label2', 'label3'))

Parameters

----------

handles : sequence of `.Artist`, optional

    A list of Artists (lines, patches) to be added to the legend.

    Use this together with *labels*, if you need full control on what

    is shown in the legend and the automatic mechanism described above

    is not sufficient.

    The length of handles and labels should be the same in this

    case. If they are not, they are truncated to the smaller length.

labels : sequence of strings, optional

    A list of labels to show next to the artists.

    Use this together with *handles*, if you need full control on what

    is shown in the legend and the automatic mechanism described above

    is not sufficient.

Other Parameters

----------------

loc : str or pair of floats, default: :rc:`legend.loc` ('best' for axes, 'upper right' for figures)

    The location of the legend.

    The strings

    ``'upper left', 'upper right', 'lower left', 'lower right'``

    place the legend at the corresponding corner of the axes/figure.

    The strings

    ``'upper center', 'lower center', 'center left', 'center right'``

    place the legend at the center of the corresponding edge of the

    axes/figure.

    The string ``'center'`` places the legend at the center of the axes/figure.

    The string ``'best'`` places the legend at the location, among the nine

    locations defined so far, with the minimum overlap with other drawn

    artists.  This option can be quite slow for plots with large amounts of

    data; your plotting speed may benefit from providing a specific location.

    The location can also be a 2-tuple giving the coordinates of the lower-left

    corner of the legend in axes coordinates (in which case *bbox_to_anchor*

    will be ignored).

    For back-compatibility, ``'center right'`` (but no other location) can also

    be spelled ``'right'``, and each "string" locations can also be given as a

    numeric value:

        ===============   =============

        Location String   Location Code

        ===============   =============

        'best'            0

        'upper right'     1

        'upper left'      2

        'lower left'      3

        'lower right'     4

        'right'           5

        'center left'     6

        'center right'    7

        'lower center'    8

        'upper center'    9

        'center'          10

        ===============   =============

bbox_to_anchor : `.BboxBase`, 2-tuple, or 4-tuple of floats

    Box that is used to position the legend in conjunction with *loc*.

    Defaults to `axes.bbox` (if called as a method to `.Axes.legend`) or

    `figure.bbox` (if `.Figure.legend`).  This argument allows arbitrary

    placement of the legend.

    Bbox coordinates are interpreted in the coordinate system given by

    `bbox_transform`, with the default transform

    Axes or Figure coordinates, depending on which ``legend`` is called.

    If a 4-tuple or `.BboxBase` is given, then it specifies the bbox

    ``(x, y, width, height)`` that the legend is placed in.

    To put the legend in the best location in the bottom right

    quadrant of the axes (or figure)::

        loc='best', bbox_to_anchor=(0.5, 0., 0.5, 0.5)

    A 2-tuple ``(x, y)`` places the corner of the legend specified by *loc* at

    x, y.  For example, to put the legend's upper right-hand corner in the

    center of the axes (or figure) the following keywords can be used::

        loc='upper right', bbox_to_anchor=(0.5, 0.5)

ncol : integer

    The number of columns that the legend has. Default is 1.

prop : None or :class:`matplotlib.font_manager.FontProperties` or dict

    The font properties of the legend. If None (default), the current

    :data:`matplotlib.rcParams` will be used.

fontsize : int or float or {'xx-small', 'x-small', 'small', 'medium', 'large', 'x-large', 'xx-large'}

    Controls the font size of the legend. If the value is numeric the

    size will be the absolute font size in points. String values are

    relative to the current default font size. This argument is only

    used if `prop` is not specified.

numpoints : None or int

    The number of marker points in the legend when creating a legend

    entry for a `.Line2D` (line).

    Default is ``None``, which will take the value from

    :rc:`legend.numpoints`.

scatterpoints : None or int

    The number of marker points in the legend when creating

    a legend entry for a `.PathCollection` (scatter plot).

    Default is ``None``, which will take the value from

    :rc:`legend.scatterpoints`.

scatteryoffsets : iterable of floats

    The vertical offset (relative to the font size) for the markers

    created for a scatter plot legend entry. 0.0 is at the base the

    legend text, and 1.0 is at the top. To draw all markers at the

    same height, set to ``[0.5]``. Default is ``[0.375, 0.5, 0.3125]``.

markerscale : None or int or float

    The relative size of legend markers compared with the originally

    drawn ones.

    Default is ``None``, which will take the value from

    :rc:`legend.markerscale`.

markerfirst : bool

    If *True*, legend marker is placed to the left of the legend label.

    If *False*, legend marker is placed to the right of the legend

    label.

    Default is *True*.

frameon : None or bool

    Control whether the legend should be drawn on a patch

    (frame).

    Default is ``None``, which will take the value from

    :rc:`legend.frameon`.

fancybox : None or bool

    Control whether round edges should be enabled around the

    :class:`~matplotlib.patches.FancyBboxPatch` which makes up the

    legend's background.

    Default is ``None``, which will take the value from

    :rc:`legend.fancybox`.

shadow : None or bool

    Control whether to draw a shadow behind the legend.

    Default is ``None``, which will take the value from

    :rc:`legend.shadow`.

framealpha : None or float

    Control the alpha transparency of the legend's background.

    Default is ``None``, which will take the value from

    :rc:`legend.framealpha`.  If shadow is activated and

    *framealpha* is ``None``, the default value is ignored.

facecolor : None or "inherit" or a color spec

    Control the legend's background color.

    Default is ``None``, which will take the value from

    :rc:`legend.facecolor`.  If ``"inherit"``, it will take

    :rc:`axes.facecolor`.

edgecolor : None or "inherit" or a color spec

    Control the legend's background patch edge color.

    Default is ``None``, which will take the value from

    :rc:`legend.edgecolor` If ``"inherit"``, it will take

    :rc:`axes.edgecolor`.

mode : {"expand", None}

    If `mode` is set to ``"expand"`` the legend will be horizontally

    expanded to fill the axes area (or `bbox_to_anchor` if defines

    the legend's size).

bbox_transform : None or :class:`matplotlib.transforms.Transform`

    The transform for the bounding box (`bbox_to_anchor`). For a value

    of ``None`` (default) the Axes'

    :data:`~matplotlib.axes.Axes.transAxes` transform will be used.

title : str or None

    The legend's title. Default is no title (``None``).

title_fontsize: str or None

    The fontsize of the legend's title.  Default is the default fontsize.

borderpad : float or None

    The fractional whitespace inside the legend border.

    Measured in font-size units.

    Default is ``None``, which will take the value from

    :rc:`legend.borderpad`.

labelspacing : float or None

    The vertical space between the legend entries.

    Measured in font-size units.

    Default is ``None``, which will take the value from

    :rc:`legend.labelspacing`.

handlelength : float or None

    The length of the legend handles.

    Measured in font-size units.

    Default is ``None``, which will take the value from

    :rc:`legend.handlelength`.

handletextpad : float or None

    The pad between the legend handle and text.

    Measured in font-size units.

    Default is ``None``, which will take the value from

    :rc:`legend.handletextpad`.

borderaxespad : float or None

    The pad between the axes and legend border.

    Measured in font-size units.

    Default is ``None``, which will take the value from

    :rc:`legend.borderaxespad`.

columnspacing : float or None

    The spacing between columns.

    Measured in font-size units.

    Default is ``None``, which will take the value from

    :rc:`legend.columnspacing`.

handler_map : dict or None

    The custom dictionary mapping instances or types to a legend

    handler. This `handler_map` updates the default handler map

    found at :func:`matplotlib.legend.Legend.get_legend_handler_map`.

Returns

-------

:class:`matplotlib.legend.Legend` instance
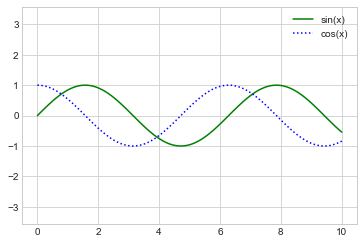
#label参数设置简易图例

plt.plot(x, np.sin(x), '-g', label='sin(x)')

plt.plot(x, np.cos(x), ':b', label='cos(x)')

plt.axis('equal')

#显示和设置图例

plt.legend()
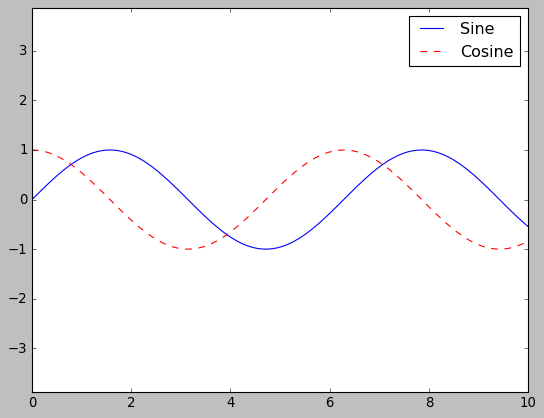
#设置绘图风格

plt.style.use('classic')

fig, ax = plt.subplots()

ax.plot(x, np.sin(x), '-b', label='Sine')

ax.plot(x, np.cos(x), '--r', label='Cosine')

ax.axis('equal')

leg = ax.legend()
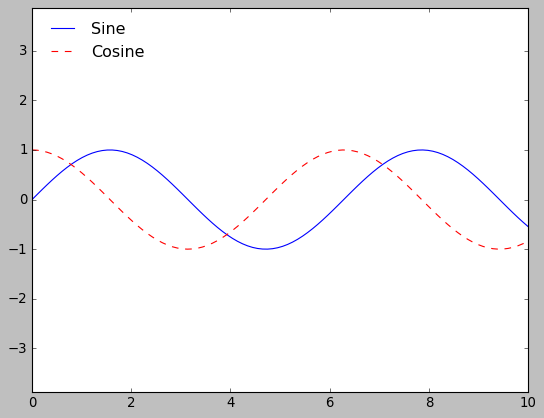
#loc设置图例位置,frameon设置边框

ax.legend(loc='upper left', frameon=False)

fig
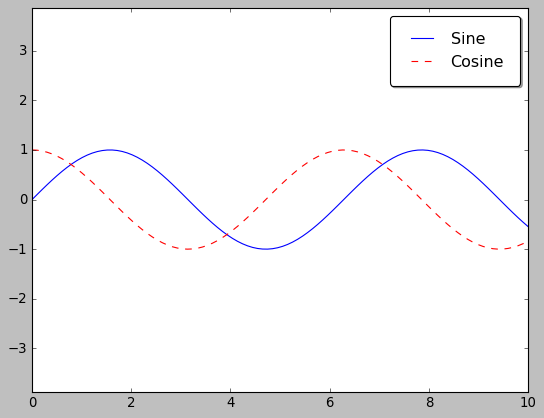
#ncol设置图例标签列数

ax.legend(frameon=False, loc='lower center', ncol=2)

fig

#fancybox设置圆角边框,shadow增加阴影,framealpha改变外框透明度,borderpad设置文字间距

ax.legend(fancybox=True, framealpha=1, shadow=True, borderpad=1)

fig
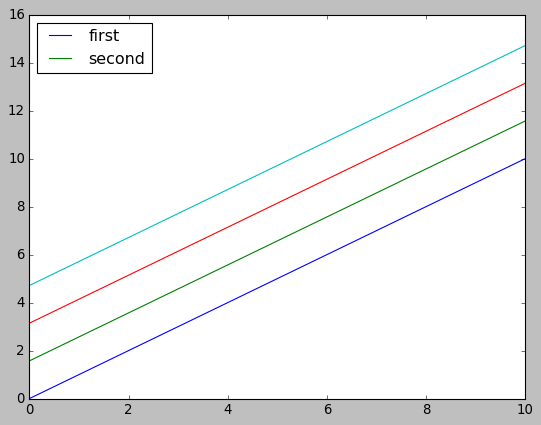
选择图例显示元素
#np.newaxis设置排序的方向

#y是通过广播功能得到一个4 * len(x)维数的数组

y = x[:, np.newaxis] + np.pi * np.arange(0, 2, 0.5)

#方法一:统一绘制

#lines变量时一组plt.Line2D实例

lines = plt.plot(x, y)

#选取其中的图形进行设置标签

plt.legend(lines[:2], ['first','second'], loc='best')

#方法二:分别绘制

plt.plot(x, y[:,0], label='first')

plt.plot(x, y[:,1], label='second')

plt.plot(x, y[:,2:])

plt.legend(framealpha=1, frameon=True, loc='best')
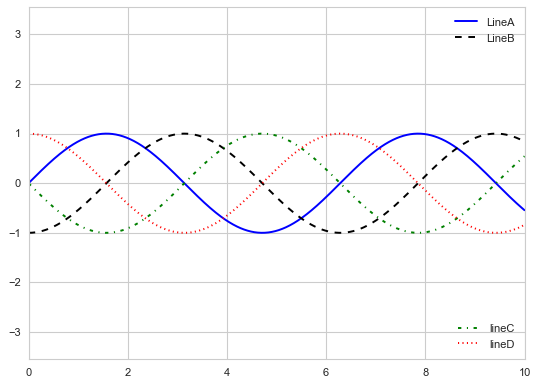
同时显示多图例
在Matplotlib中一般标准legend接口只能为一张图创建一个图例,如果用plt.legend()或ax.legend()创建第二图例时,第一图例会被覆盖。但是,可通过从头开始创建一个新的图例艺术家对象(legend artist),然后用底层的(lower-level)ax.add_artist()方法在图上添加第二个图例。
fig, ax = plt.subplots()

lines = []

styles = ['-','--','-.',':']

colors = ['b','k','g','r']

x = np.linspace(0, 10, 1000)

for i in range(len(styles)):

    lines += ax.plot(x, np.sin(x-i * np.pi/2),

                    styles[i], color=colors[i])

ax.axis('equal')

#设置第一个图例要显示的元素和标签

ax.legend(lines[:2], ['LineA','LineB'],

          loc='upper right', frameon=False)

#根据一个Legend对象用add_artist方法添加第二个图例要显示的元素和标签

from matplotlib.legend import Legend

leg = Legend(ax, lines[2:], ['lineC','lineD'],

             loc='lower right', frameon=False)

ax.add_artist(leg);
Matplotlib绘图设置--- 图例设置的更多相关文章
- matplotlib绘图教程,设置标签与图例
大家好,欢迎大家阅读周四数据处理专题,我们继续介绍matplotlib作图工具. 在上一篇文章当中我们介绍了matplotlib这个包当中颜色.标记和线条这三种画图的设置,今天我们同样也介绍三种新的设 ...
- Matplotlib绘图双纵坐标轴设置及控制设置时间格式
双y轴坐标轴图 今天利用matplotlib绘图,想要完成一个双坐标格式的图. fig=plt.figure(figsize=(20,15)) ax1=fig.add_subplot(111) ax1 ...
- 【原】在Matplotlib绘图过程中设置X轴的刻度和显示文本
使用Matplotlib进行绘图时,当x轴的数据太多的时候,就需要设置x轴的刻度和显示文本,关键代码如下: 绘图结果如下:
- Python用matplotlib绘图网格线的设置
一.X轴网格线的设置 import matplotlib.pyplot as plt import numpy as np from pylab import mpl mpl.rcParams['fo ...
- Python matplotlib绘图设置图例
一.语法简介 plt.legend(loc=2,edgecolor='red',facecolor='green',shadow='True',fontsize=10) #edgecolor 图例边框 ...
- 4.11Python数据处理篇之Matplotlib系列(十一)---图例,网格,背景的设置
目录 目录 前言 (一)图例legend 1.默认不带参数的图例 2.添加参数的图例 3.将图例移动到框外 (二)网格grid 1.说明 2.源代码: 3.输出效果 (三)背景axses 1.设置全局 ...
- (数据科学学习手札100)搞定matplotlib中的字体设置
本文示例文件已上传至我的Github仓库https://github.com/CNFeffery/DataScienceStudyNotes 1 简介 matplotlib作为数据可视化的利器,被广泛 ...
- python matplotlib 中文显示参数设置
python matplotlib 中文显示参数设置 方法一:每次编写代码时进行参数设置 #coding:utf-8import matplotlib.pyplot as pltplt.rcParam ...
- echarts仪表盘如何设置图例(legend)
echarts 图表中经常需要对不同的颜色设置图例标识不同的意义,而仪表盘的指针只存在一个值,如何表示不同颜色的意义,官网配置项并未给出该功能: 不同段的颜色是通过axisLine->lineS ...
- python matplotlib 中文显示乱码设置
python matplotlib 中文显示乱码设置 原因:是matplotlib库中没有中文字体.1 解决方案:1.进入C:\Anaconda64\Lib\site-packages\matplot ...
随机推荐
- 问题:django中对datetime类型数据在pycharm中sqlite3进行修改时,修改后datetime日期数据变成了时间戳类型
这是正在修改的 提交完之后 问题原因 问题原因是sqlite数据库对日期类型不敏感,Pycharm直接插入会变成图中这样的时间戳,用POST请求添加数据或Django自带的后台管理插入不会有这样的问题 ...
- 【LeetCode栈与队列#05】滑动窗口最大值
滑动窗口最大值 力扣题目链接(opens new window) 给定一个数组 nums,有一个大小为 k 的滑动窗口从数组的最左侧移动到数组的最右侧.你只可以看到在滑动窗口内的 k 个数字.滑动窗口 ...
- Vue3学习(二十)- 富文本插件wangeditor的使用
写在前面 学习.写作.工作.生活,都跟心情有很大关系,甚至有时候我更喜欢一个人独处,戴上耳机coding的感觉. 明显现在的心情,比中午和上午好多了,心情超棒的,靠自己解决了两个问题: 新增的时候点击 ...
- ABP Suite创建新项目
启动Abp Suite ********************************************************************** ** Visual Studio ...
- hibernate-delete(Entity)的顺序问题
hibernate为我们提供了删除直接根据实体参数删除数据的方法: HibernateTemplate().delete(entity); public void delete(final Objec ...
- Linux_Centos_yum报错总结
此篇适用于yum报错[尝试其他镜像]并且[curl 外网]不通的情况,此时一般考虑是网络的问题 一,出现的报错信息: 此时测试curl / ping www.baidu.com会发现无法连通 二, ...
- Java 多线程------多线程的创建(2),方式一:继承于Thread类
1 package com.bytezero.threadexer; 2 3 /** 4 * 创建两个分线程,其中一个线程遍历100以内的偶数,另一个线程遍历100以内的奇数 5 * 6 * 7 * ...
- Java 练习题(类+调用方法)
1 /* 2 * 3 * 定义一个 PassObject,在类中定义一个方法printAress(),该方法的定义如下: 4 * public void printAreas(Circle c,int ...
- SSK:超级键盘模拟器,调用底层,可模拟所有按键
SSK - 吵架键盘模拟器 SuperSimulator of Keyboard 调用系统底层,能够模拟所有键盘操作! 本程序结合快Key(QuicKeys智能登录助手)一起使用,能够创造更多奇迹! ...
- 图数据库基准测试 LDBC SNB 系列讲解:Schema 和数据生成的机制
LDBC(Linked Data Benchmark Council)Social Network Benchmark,简称 LDBC SNB,是一种针对社交网络场景的评估图数据库性能的基准测试. L ...