Vue整合d3.v5.js制作--柱状图(rect)
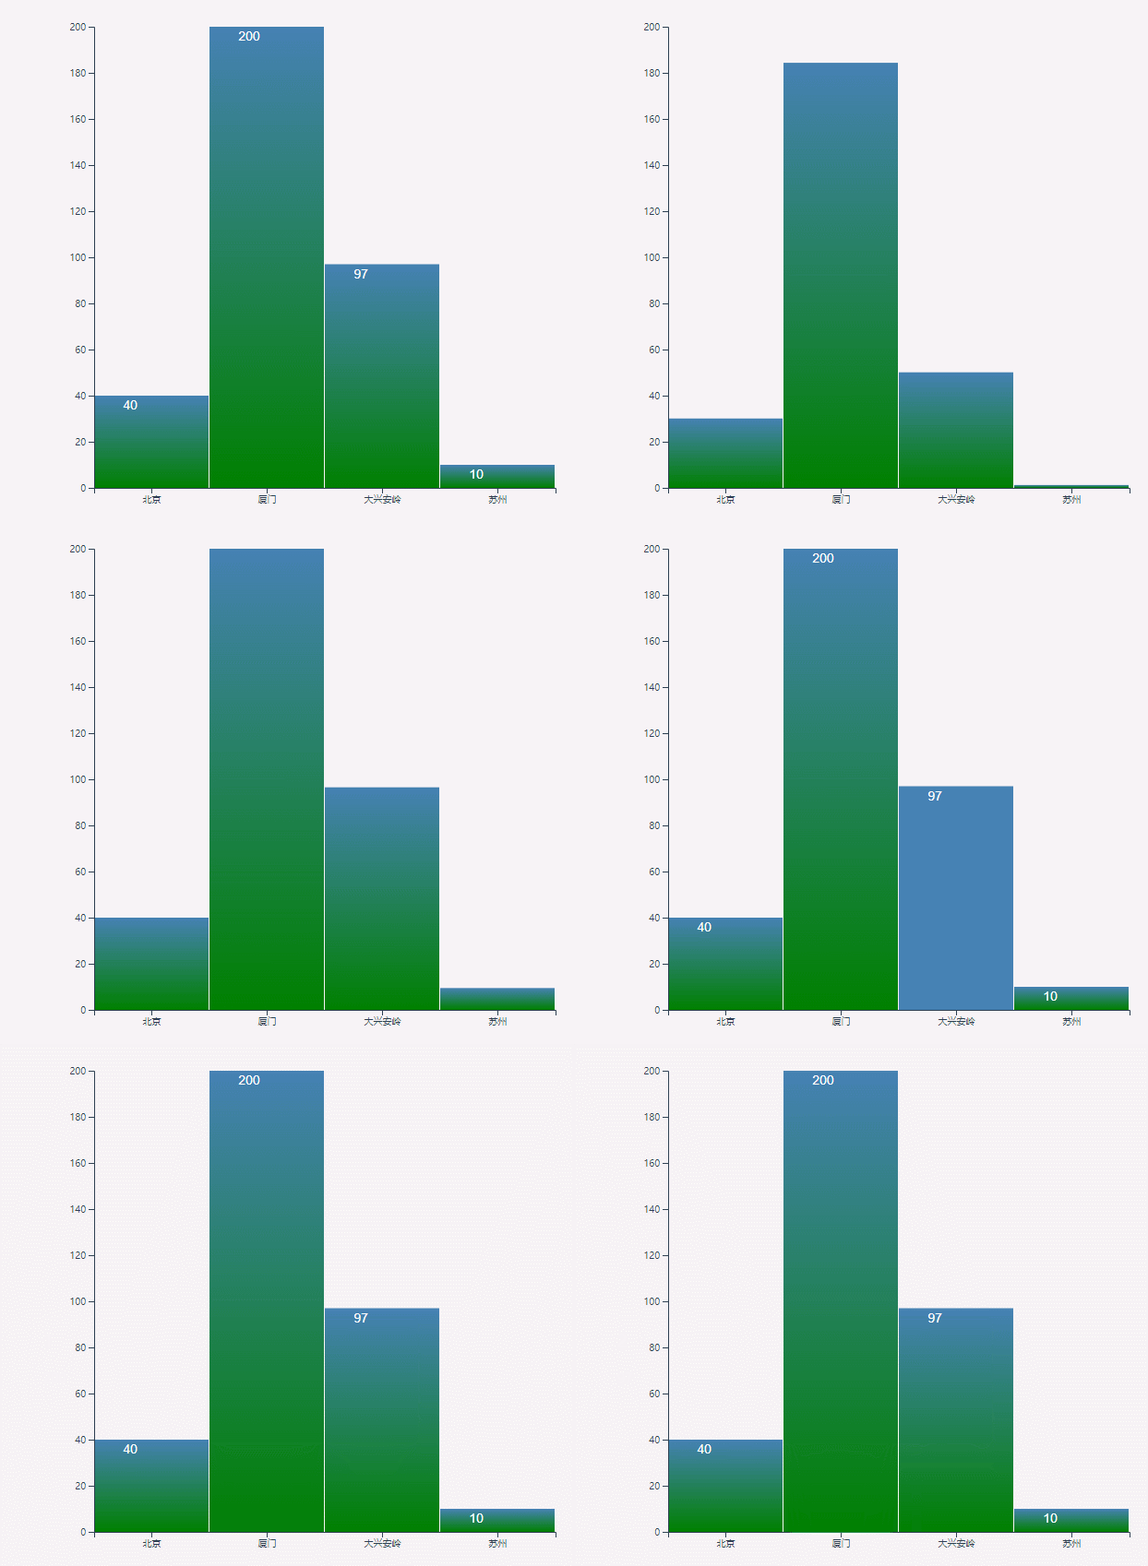
先上效果图:

图中柱状图变成纯蓝色是鼠标滑动过的颜色(颜色可改,本人配色能力十分的强,建议直接用默认设置即可 ( ᖛ ̫ ᖛ )ʃ))
1、环境说明
Vue版本:"vue": "^2.5.2"
d3版本:"d3": "^5.9.1"
2、Histogram.vue源码
 <!--

   d3组件:柱状图

   属性说明:

    id:必填,如果同一页面引用多个柱状图,请设置不同的id

    width:选填,默认600

    height:选填,默认600

    begincolor:选填,柱状图渐变色的起始颜色,默认绿色

    endcolor:选填,柱状图渐变色的结束颜色,默认蓝色

    selectcolor:选填,鼠标滑过柱状图时显示的颜色,默认蓝色

    dataset:必填,数据

      数据格式:

         [

           {'name': '北京', value: },

           {'name': '厦门', value: },

           {'name': '大兴安岭', value: },

           {'name': '苏州', value: }

         ]

    rotate:选填,当x轴文字过长,可设置此值为true让文字旋转,默认不旋转

    onRectClick: 选填,点击柱状图的自定义事件

 -->

 <template>

   <div class="histogram" :id="id">

   </div>

 </template>

 <script>

   import * as d3 from 'd3'

   function noop(d, i) {

     // console.log(d)

     // console.log(i)

   }

   export default {

     name: 'histogram',

     props: {

       id: String,

       width: Number,

       height: Number,

       begincolor: String,

       endcolor: String,

       selectcolor: String,

       dataset: Array,

       rotate: Boolean,

       onRectClick: {

         type: Function,

         default: noop

       }

     },

     mounted () {

       this.init();

     },

     methods: {

       init() {

         d3.select("#svg" + this.id).remove();

         let width = this.width ? this.width : ;

         let height = this.height ? this.height : ;

         let svg = d3.select("#" + this.id).append("svg").attr("width", width).attr("height", height).attr("id", "svg" + this.id);

         let begincolor = this.begincolor ? this.begincolor : 'steelblue';

         let endcolor = this.endcolor ? this.endcolor : 'green';

         let selectcolor = this.selectcolor ? this.selectcolor : 'steelblue';

         let linecolorid = 'linecolor' + this.id;

         let linearGradient = svg.append('defs').append('linearGradient').attr('id', linecolorid)

           .attr('x1', '0%').attr('y1', '0%').attr('x2', '0%').attr('y2', '100%')

         linearGradient.append('stop').attr('offset', '0%').attr('style', 'stop-color:' + begincolor + '; stop-opacity:1')

         linearGradient.append('stop').attr('offset', '100%').attr('style', 'stop-color:' + endcolor + '; stop-opacity:1')

         let gwidth = width - ;

         let gheight = height - ;

         let values = this.dataset.map(d => d.value)

         let xScale1 = d3.scaleBand().range([, gwidth]).domain(this.dataset.map(d => d.name))

         let yScale1 = d3.scaleLinear().domain([, d3.max(values)]).range([gheight, ]);

         let xAxis = d3.axisBottom().scale(xScale1);

         let yAxis = d3.axisLeft().scale(yScale1);

         let xScale = d3.scaleBand()

           .domain(d3.range(this.dataset.length))

           .rangeRound([, gwidth])

           .round(0.05);

         let yScale = d3.scaleLinear()

           .domain([, d3.max(values)])

           .range([, gheight]);

         svg.selectAll("rect")

           .data(values)

           .enter()

           .append("rect")

           .attr("x", (d, i) =>  + xScale(i))

           .attr("width", xScale.bandwidth() - )

           .attr("y",  + gheight)

           .attr("height", )

           .attr("fill", "red")

           .on("click", this.onRectClick)

           // .on("click", function(d, i) {

           //   d3.select(this)

           //     .transition()

           //     .duration(1000)

           //     .ease(d3.easeBounce)

           //     .attr("fill", "green");

           // })

           .on("mouseover", function(d, i) {

             d3.select(this)

             // .transition(d)

             // .duration(200)

             // .ease(d3.easeBounce)

               .attr("fill", selectcolor);

           })

           .on("mouseout", function(d, i) {

             d3.select(this)

             // .transition(d)

             // .duration(200)

             // .ease(d3.easeBounce)

               .attr("fill", "url(#" + linecolorid + ")");

           })

           .transition()

           .duration()

           .ease(d3.easeBounce)

           .delay((d, i) => i * )

           .attr("y", (d) =>  + gheight - yScale(d))

           .attr("height", yScale)

           .attr("fill", "url(#" + linecolorid + ")");

         svg.selectAll("text")

           .data(values)

           .enter()

           .append("text")

           .attr("x", (d, i) =>  + xScale(i))

           .attr("y", d =>  + gheight - yScale(d))

           .attr("dx", xScale.bandwidth() / )

           .attr("dy", )

           .attr("text-anchor", "begin")

           .attr("font-size", () => {

             if (width > ) return ;

             else return ;

           })

           .attr("fill", "white")

           .transition()

           .delay()

           .text(d => d);

         let xvalues = svg.append("g")

           .attr("transform", "translate(60, " + (gheight + ) + ")")

           .call(xAxis)

         if (this.rotate) {

           xvalues.selectAll('text')

             .attr("dx", -)

             .attr("dy", )

             .attr("transform", "rotate(-30)")

         }

         svg.append("g")

           .attr("transform", "translate(60, 50)")

           .call(yAxis);

         // if (this.width && this.height) {

         //   svg.attr("width", this.width)

         //     .attr("height", this.height)

         //     .attr("viewBox", "0 0 600 600");

         // }

       }

     },

     watch: {

       dataset() {

         this.init();

       }

     }

   }

 </script>

 <style>

 </style>
3、api说明
   d3组件:柱状图

   属性说明:

    id:必填,如果同一页面引用多个柱状图,请设置不同的id

    width:选填,默认600

    height:选填,默认600

    begincolor:选填,柱状图渐变色的起始颜色,默认绿色

    endcolor:选填,柱状图渐变色的结束颜色,默认蓝色

    selectcolor:选填,鼠标滑过柱状图时显示的颜色,默认蓝色

    dataset:必填,数据

      数据格式:

         [

           {'name': '北京', value: },

           {'name': '厦门', value: },

           {'name': '大兴安岭', value: },

           {'name': '苏州', value: }

         ]

    rotate:选填,当x轴文字过长,可设置此值为true让文字旋转,默认不旋转

    onRectClick: 选填,点击柱状图的自定义事件
4、使用示例
 <template>

   <div id="test">

     <histogram id="histogram" :dataset="data" :onRectClick="test"></histogram>

   </div>

 </template>

 <script>

   import histogram from '@/components/d3/Histogram'

   export default {

     name: 'test',

     data() {

       return {

         data: [

           {'name': '北京', value: },

           {'name': '厦门', value: },

           {'name': '大兴安岭', value: },

           {'name': '苏州', value: }

         ]

       }

     },

     components: {

       histogram

     },

     methods: {

       test(d, i) {

         this.$alert(d, i, {

           confirmButtonText: '确定',

           callback: action => {

             this.$message({

               type: 'info',

               message: `action: ${ action }`

             });

           }

         });

       }

     }

   }

 </script>

 <style scoped>

 </style>
Vue整合d3.v5.js制作--柱状图(rect)的更多相关文章
- Vue整合d3.v5.js制作--折线图(line)
先上效果图(x轴固定为时间轴): 图中出现的悬浮框是鼠标悬停效果 1.环境说明: vue版本:"vue": "^2.5.2" d3版本:"d3&quo ...
- D3.js 制作中国地图 .net 公共基础类
D3.js 制作中国地图 from: http://d3.decembercafe.org/pages/map/index.html GeoJSON is a format for encoding ...
- d3.js 制作简单的俄罗斯方块
d3.js是一个不错的可视化框架,同时对于操作dom也是十分方便的.今天我们使用d3.js配合es6的类来制作一个童年小游戏--俄罗斯方块.话不多说先上图片. 1. js tetris类 由于方法拆分 ...
- d3.js 制作简单的贪吃蛇
d3.js是一个不错的可视化框架,同时对于操作dom也是十分方便的.今天我们使用d3.js配合es6的类来制作一个童年小游戏–贪吃蛇.话不多说先上图片. 1. js snaker类 class Sna ...
- 使用Vue.js制作仿Metronic高级表格(一)静态设计
Metronic高级表格是Metonic框架中自行实现的表格,其底层是Datatables.本教程将主要使用Vue实现交互部分,使用Bootstrap做样式库.jQuery做部分用户交互(弹窗). 使 ...
- 使用d3.v5实现条形图
效果图: 条形图: 目录结构: <!DOCTYPE html> <html lang="en"> <head> <meta charset ...
- 使用d3.v5实现饼状图
效果图: 饼状图: 目录结构: <!DOCTYPE html> <html lang="en"> <head> <meta charset ...
- 使用d3.v5实现折线图与面积图
d3最新是V5版的,比起V2的API变动了不少,写下我实现过程 效果图: 面积图: 折线图: 目录结构: <!DOCTYPE html> <html lang="en&qu ...
- vue整合adminLTE
前端框架AdminLTE 中文教程 如何用vue整合adminlte模板 1.adminlte 下载地址 : https://github.com/almasaeed2010/AdminLTE/rel ...
随机推荐
- axios用post传参,后端无法获取参数问题
最近用vue+nodejs写项目,前端使用axios向后台传参,发现后台接收不到参数. 后台是node+express框架,然后使用了body-parser包接收参数,配置如下: const expr ...
- 保存网页内容到excel
from selenium import webdriverfrom time import sleepfrom selenium.common.exceptions import NoSuchEle ...
- Linux(Centos)安装tomcat并且部署Java Web项目
步骤一.下载安装包 a. 下载tomcat linux安装包,地址:http://tomcat.apache.org/download-80.cgi , 我们下载的版本是8.0,下载方式如图: b ...
- json通过后台获取数据库中的内容,并在前端进行显示
fastjson.jar以及Echarts树图的js文件(需要在servlet对json进行赋值,所以需要用到json的插件) 链接:https://pan.baidu.com/s/1GBbamPNG ...
- Java并发编程(一):线程基础知识以及synchronized关键字
1.线程与多线程的概念:在一个程序中,能够独立运行的程序片段叫作“线程”(Thread).多线程(multithreading)是指从软件或者硬件上实现多个线程并发执行的技术. 2.多线程的意义:多线 ...
- 【VC++开发实战】迅雷晒密及批量查询流量程序
迅雷第一次登录是不需要验证码的,就很方便了.首先还是要解决登录的问题,也不是那么容易解决的,这个是在POST是提交的表单[u=joneeky%40qq.com&p=cf1e22e61d987c ...
- POJ_3663_贪心
题目描述: 给你一堆数和一个限定的空间大小,要求求出两个数的和小于等于空间大小的对数. 思路: 贪心,先给一堆数从大到小排序. 第一个数取数组第一个,第二个数从第二个开始依次往后取,只要某个第二个数满 ...
- (二)maven依赖,两个项目之间如何依赖,继承实现
maven的jar之间存在依赖关系的,我们在引入一个时,其他有依赖关系的也会被引入 依赖排除: 比如现在有两个依赖关系,A(x,java,y.java,z.java) B(a,java,b,java ...
- 实例演示:如何在Kubernetes上大规模运行CI/CD
本周四晚上8:30,第二期k3s在线培训如约开播!本期课程将介绍k3s的核心架构,如高可用架构以及containerd.一起来进阶探索k3s吧! 报名及观看链接:http://z-mz.cn/PmwZ ...
- 用反射、泛型 改造SqlHelper
1. 数据准备 public class BaseModel { public int Id { set; get; } } public class Company : BaseModel { p ...
