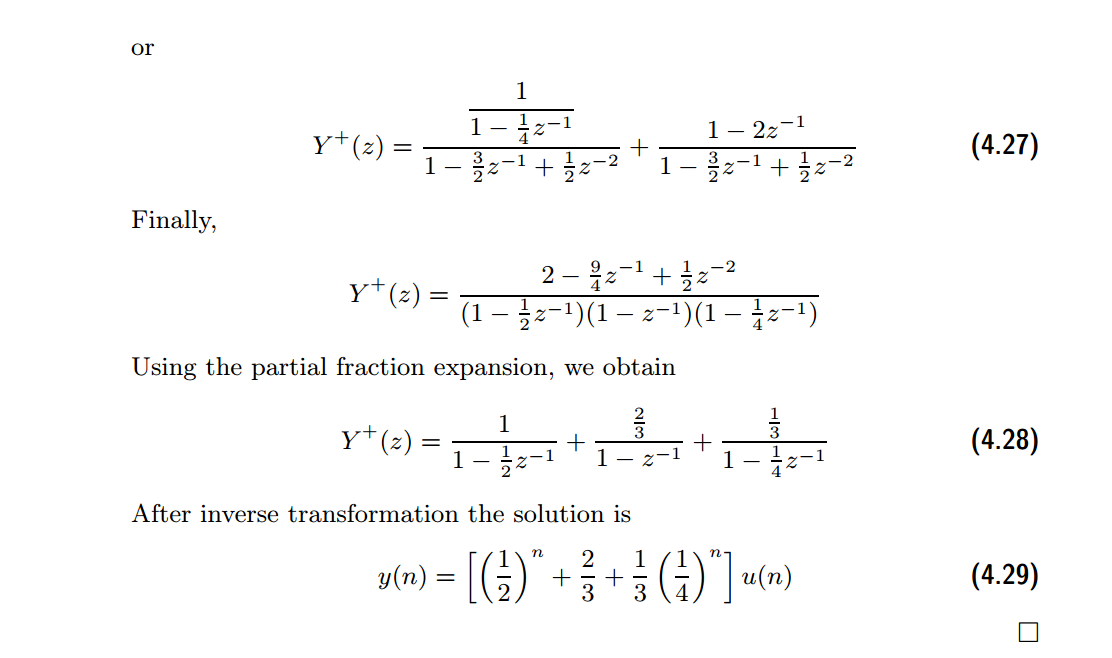
《DSP using MATLAB》示例Example4.14
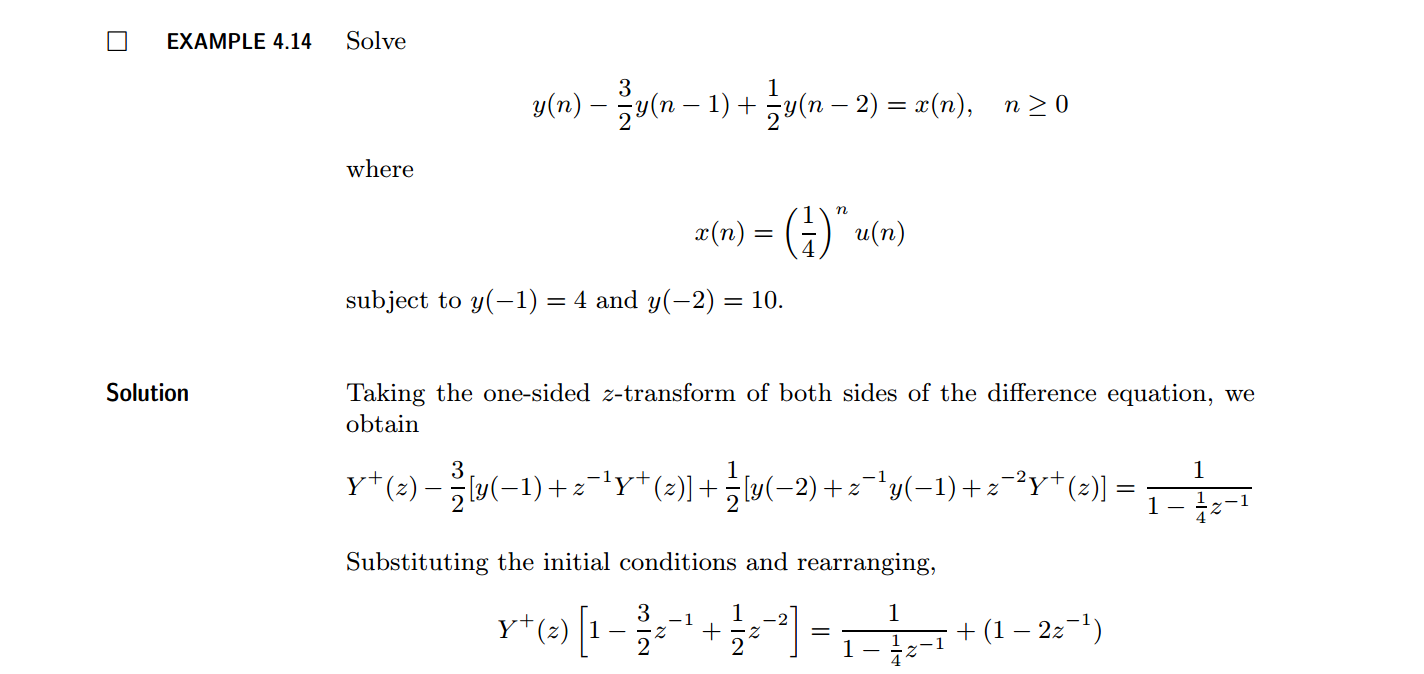
代码:
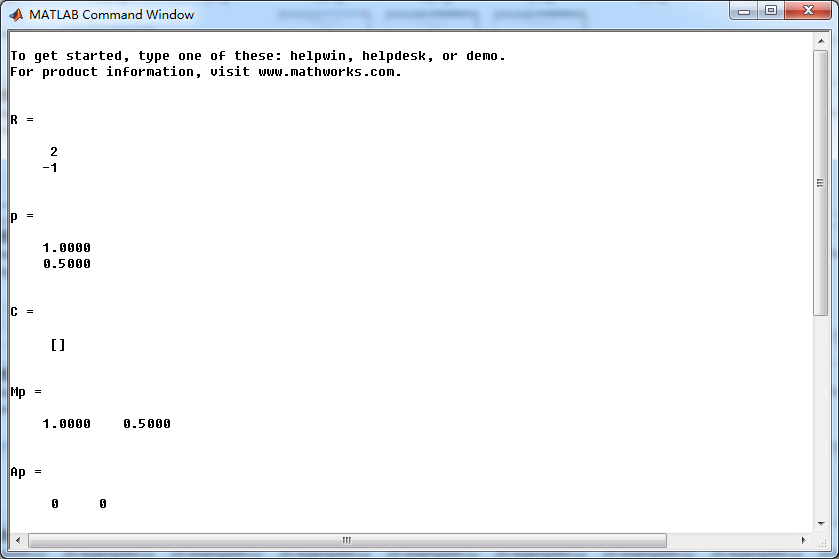
b = [1]; a = [1, -1.5, 0.5]; % [R, p, C] = residuez(b,a) Mp = (abs(p))'
Ap = (angle(p))'/pi % check
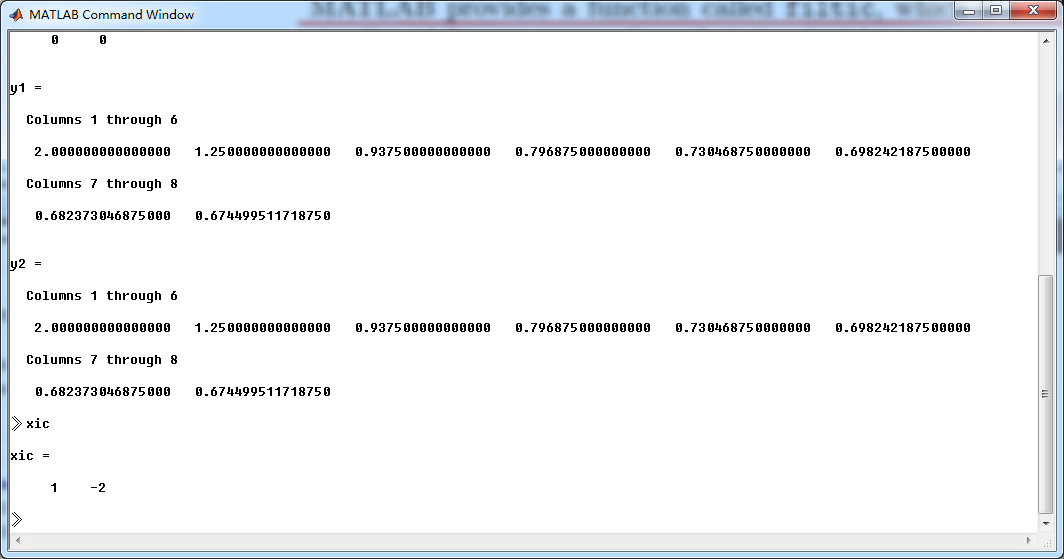
n = [0:7]; x = (1/4).^n; xic = [1, -2];
format long;
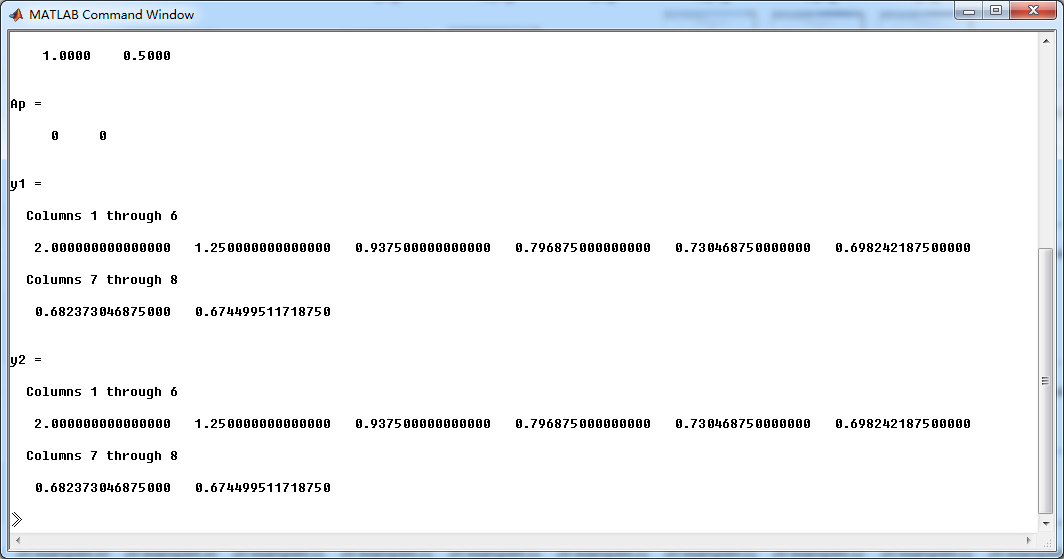
y1 = filter(b,a,x,xic)
y2 = (1/3)*(1/4).^n + (1/2).^n + (2/3)*ones(1,8) Y = [4, 10]; xic = filtic(b,a,Y); %% ----------------------------------------------
%% START a determine H(z) and sketch
%% ----------------------------------------------
figure('NumberTitle', 'off', 'Name', 'Example4.14 H(z) its pole-zero plot')
set(gcf,'Color','white');
zplane(b,a);
title('pole-zero plot'); grid on; %% ----------------------------------------------
%% END
%% ---------------------------------------------- %% --------------------------------------------------------------
%% START b |H| <H
%% 1st form of freqz
%% --------------------------------------------------------------
[H,w] = freqz(b,a,500); % 1st form of freqz magH = abs(H); angH = angle(H); realH = real(H); imagH = imag(H); %% ================================================
%% START H's mag ang real imag
%% ================================================
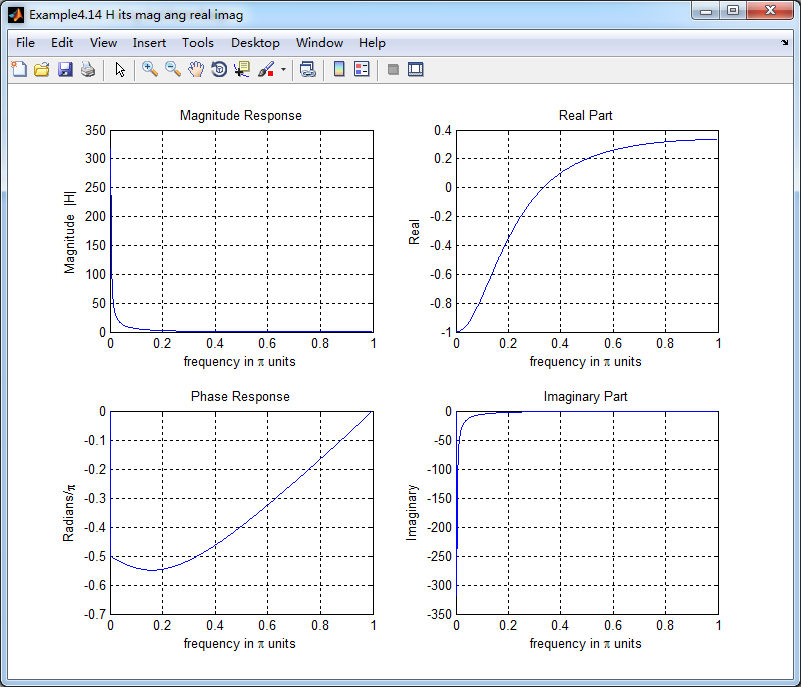
figure('NumberTitle', 'off', 'Name', 'Example4.14 H its mag ang real imag');
set(gcf,'Color','white');
subplot(2,2,1); plot(w/pi,magH); grid on; %axis([0,1,0,1.5]);
title('Magnitude Response');
xlabel('frequency in \pi units'); ylabel('Magnitude |H|');
subplot(2,2,3); plot(w/pi, angH/pi); grid on; % axis([-1,1,-1,1]);
title('Phase Response');
xlabel('frequency in \pi units'); ylabel('Radians/\pi'); subplot('2,2,2'); plot(w/pi, realH); grid on;
title('Real Part');
xlabel('frequency in \pi units'); ylabel('Real');
subplot('2,2,4'); plot(w/pi, imagH); grid on;
title('Imaginary Part');
xlabel('frequency in \pi units'); ylabel('Imaginary');
%% ==================================================
%% END H's mag ang real imag
%% ================================================== %% ---------------------------------------------------------------
%% END b |H| <H
%% --------------------------------------------------------------- %% --------------------------------------------------------------
%% START b |H| <H
%% 3rd form of freqz
%% --------------------------------------------------------------
w = [0:1:500]*pi/500; H = freqz(b,a,w);
%[H,w] = freqz(b,a,200,'whole'); % 3rd form of freqz magH = abs(H); angH = angle(H); realH = real(H); imagH = imag(H); %% ================================================
%% START H's mag ang real imag
%% ================================================
figure('NumberTitle', 'off', 'Name', 'Example4.14 using 3rd form freqz ');
set(gcf,'Color','white');
subplot(2,2,1); plot(w/pi,magH); grid on; %axis([0,1,0,1.5]);
title('Magnitude Response');
xlabel('frequency in \pi units'); ylabel('Magnitude |H|');
subplot(2,2,3); plot(w/pi, angH/pi); grid on; % axis([-1,1,-1,1]);
title('Phase Response');
xlabel('frequency in \pi units'); ylabel('Radians/\pi'); subplot('2,2,2'); plot(w/pi, realH); grid on;
title('Real Part');
xlabel('frequency in \pi units'); ylabel('Real');
subplot('2,2,4'); plot(w/pi, imagH); grid on;
title('Imaginary Part');
xlabel('frequency in \pi units'); ylabel('Imaginary');
%% ==================================================
%% END H's mag ang real imag
%% ================================================== %% ---------------------------------------------------------------
%% END b |H| <H
%% ---------------------------------------------------------------
结果:

《DSP using MATLAB》示例Example4.14的更多相关文章
- DSP using MATLAB 示例Example3.21
代码: % Discrete-time Signal x1(n) % Ts = 0.0002; n = -25:1:25; nTs = n*Ts; Fs = 1/Ts; x = exp(-1000*a ...
- DSP using MATLAB 示例 Example3.19
代码: % Analog Signal Dt = 0.00005; t = -0.005:Dt:0.005; xa = exp(-1000*abs(t)); % Discrete-time Signa ...
- DSP using MATLAB示例Example3.18
代码: % Analog Signal Dt = 0.00005; t = -0.005:Dt:0.005; xa = exp(-1000*abs(t)); % Continuous-time Fou ...
- DSP using MATLAB 示例Example3.23
代码: % Discrete-time Signal x1(n) : Ts = 0.0002 Ts = 0.0002; n = -25:1:25; nTs = n*Ts; x1 = exp(-1000 ...
- DSP using MATLAB 示例Example3.22
代码: % Discrete-time Signal x2(n) Ts = 0.001; n = -5:1:5; nTs = n*Ts; Fs = 1/Ts; x = exp(-1000*abs(nT ...
- DSP using MATLAB 示例Example3.17
- DSP using MATLAB示例Example3.16
代码: b = [0.0181, 0.0543, 0.0543, 0.0181]; % filter coefficient array b a = [1.0000, -1.7600, 1.1829, ...
- DSP using MATLAB 示例 Example3.15
上代码: subplot(1,1,1); b = 1; a = [1, -0.8]; n = [0:100]; x = cos(0.05*pi*n); y = filter(b,a,x); figur ...
- DSP using MATLAB 示例 Example3.13
上代码: w = [0:1:500]*pi/500; % freqency between 0 and +pi, [0,pi] axis divided into 501 points. H = ex ...
随机推荐
- C#实现MD5加密
摘自:http://blog.csdn.net/shenghui188/archive/2010/03/28/5423959.aspx 方法一 首先,先简单介绍一下MD5 MD5的全称是message ...
- C#传真传址 结构体
1.传真 传址 namespace 传值_传址 { class Program { //格式1:无参无返 public void LeiJia() { Console.Write("请输入 ...
- Android studio 自定义打包APK名称
Android Studio打包应用默认生成的apk名称是:app-release.apk .如果我们要让生成的apk名跟我们版本包名有联系的话,那我们就要自定义生成的apk名了,要怎么做呢. 我们只 ...
- java判断身份证有效性
import java.util.Calendar; public class CertNoUtil { public static boolean vIDNumByRegex(String idNu ...
- 解决SQL Server的cannot resolve the collation conflict问题
当没有牵涉到两个不同的数据库时,出现以上错误. Cannot resolve the collation conflict between "Chinese_PRC_CI_AS" ...
- ASP.NET Ajax 简单实例
本实例讲解Ajax 调用WCF服务. 1.建立一个网站,并在其中添加一个WCF服务(这里需要选择Ajax-Enabled WCF Service). 2.IDE会自动生成一个SVC文件. 3.服务代码 ...
- mongodb3.x版本用户管理方法
db.auth() 作用:验证用户到数据库. 语法: db.auth( { user: <username>, pwd: <password>, mechanism: < ...
- hdu1162(最小生成树 prim or kruscal)
题目链接:http://acm.hdu.edu.cn/showproblem.php?pid=1162 意义:给出一些点,用线问使所有点直接或间接连通,需要多长: 思路:裸最小生成树: 法1: pri ...
- 20145206《Java程序设计》实验二Java面向对象程序设计实验报告
20145206<Java程序设计>实验二Java面向对象程序设计实验报告 实验内容 初步掌握单元测试和TDD 理解并掌握面向对象三要素:封装.继承.多态 初步掌握UML建模 熟悉S.O. ...
- php导出excel封装类
因为实际情况的需要,导出excel表格在后台开发的过程中会经常用到.下面是我在实际应用中自己整理的一个导出excel类,需要PHPExcel支持,本类很好的完成导出表格的基本样式,保存路径,切换工作薄 ...