Web前端学习笔记——Canvas
<!DOCTYPE html>

<html lang="en">

<head>

    <meta charset="UTF-8">

    <title>Title</title>

    <style>

        canvas {

            border: 1px solid #ccc;

            /*不建议在 样式设置尺寸*/

            /*width: 600px;

            height: 400px;*/

        }

    </style>

</head>

<body>

    <!--1.准备画布-->

    <!--1.1 画布是白色的 而且默认300*150-->

    <!--1.2 设置画布的大小  width="600" height="400" -->

    <canvas width="600" height="400"></canvas>

    <!--2.准备绘制工具-->

    <!--3.利用工具绘图-->

    <script>

        /*1.获取元素*/

        var myCanvas = document.querySelector('canvas');

        /*2.获取上下文 绘制工具箱 */

        /*是否有3d 暂时没有*/

        var ctx = myCanvas.getContext('2d'); /*web gl 绘制3d效果的网页技术*/

        /*3.移动画笔*/

        ctx.moveTo(100, 100);

        /*4.绘制直线 (轨迹,绘制路径)*/

        ctx.lineTo(200, 100);

        /*5.描边*/

        ctx.stroke();

    </script>

</body>

</html>
什么是Canvas?
HTML5 的 canvas 元素使用 JavaScript 在网页上绘制图像。
画布是一个矩形区域,您可以控制其每一像素。
canvas 拥有多种绘制路径、矩形、圆形、字符以及添加图像的方法。
创建Canvas元素
向 HTML5 页面添加 canvas 元素。
规定元素的 id、宽度和高度:
<canvas id="myCanvas" width="200" height="100"></canvas>
Canvas坐标系
通过JavaScript来绘制
/*获取元素*/

var myCanvas = document.querySelector('#myCanvas');

/*获取绘图工具*/

var context = myCanvas.getContext('2d');

/*设置绘图的起始位置*/

context.moveTo(100,100);

/*绘制路径*/

context.lineTo(200,200);

/*描边*/

context.stroke();
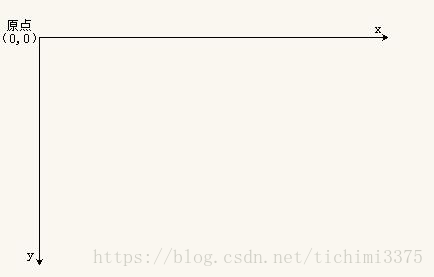
图形绘制
需要理解些概念:
路径的绘制
填充 fill()
程序闭合 closePath()
lineCap 线末端类型:(butt默认)、round、square
lineJoin 相交线的拐点 miter(默认)、round、bevel
strokeStyle 线的颜色
fillStyle 填充颜色
setLineDash() 设置虚线
getLineDash() 获取虚线宽度集合
lineDashOffset 设置虚线偏移量(负值向右偏移)
<!DOCTYPE html>
<html lang="en"> <head>
<meta charset="UTF-8">
<title>Title</title>
<style>
canvas {
border: 1px solid #ccc;
}
</style>
</head> <body>
<canvas width="600" height="400"></canvas>
<script>
var myCanvas = document.querySelector('canvas');
var ctx = myCanvas.getContext('2d'); /*画平行线*/
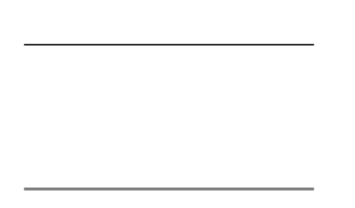
ctx.moveTo(100, 100.5);
ctx.lineTo(300, 100.5); ctx.moveTo(100, 200);
ctx.lineTo(300, 200); /*描边*/
ctx.stroke(); /*关于线条的问题*/
/*1.默认的宽度是多少 1px*/
/*2.默认的颜色是什么 黑色*/
/*产生原因 对齐的点是线的中心位置 会把线分成两个0.5px 显示的是会不饱和增加宽度*/
/*解决方案 前后移动0.5px */
</script>
</body> </html>
<!DOCTYPE html>
<html lang="en"> <head>
<meta charset="UTF-8">
<title>Title</title>
<style>
canvas {
border: 1px solid #ccc;
}
</style>
</head> <body>
<canvas width="600" height="400"></canvas>
<script>
var myCanvas = document.querySelector('canvas');
var ctx = myCanvas.getContext('2d'); /*画平行线*/
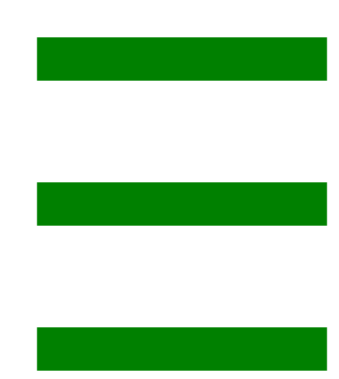
ctx.beginPath(); /*Kai*/
/*蓝色 10px*/
ctx.moveTo(100, 100);
ctx.lineTo(300, 100);
ctx.strokeStyle = 'blue';
ctx.lineWidth = 10;
/*描边*/
ctx.stroke(); /*红色 20px*/
ctx.moveTo(100, 200);
ctx.lineTo(300, 200);
ctx.strokeStyle = 'red';
ctx.lineWidth = 20;
/*描边*/
ctx.stroke(); /*绿色 30px*/
ctx.moveTo(100, 300);
ctx.lineTo(300, 300);
ctx.strokeStyle = 'green';
ctx.lineWidth = 30;
/*描边*/
ctx.stroke();
</script>
</body> </html>
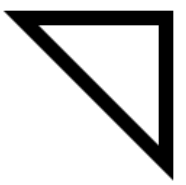
绘制一个填充的三角形
<!DOCTYPE html>

<html lang="en">

<head>

    <meta charset="UTF-8">

    <title>Title</title>

    <style>

        canvas {

            border: 1px solid #ccc;

        }

    </style>

</head>

<body>

    <canvas width="600" height="400"></canvas>

    <script>

        var myCanvas = document.querySelector('canvas');

        var ctx = myCanvas.getContext('2d');

        /*1.绘制一个三角形*/

        ctx.moveTo(100, 100);

        ctx.lineTo(200, 100);

        ctx.lineTo(200, 200);

        /*起始点和lineTo的结束点无法完全闭合缺角*/

        /*使用canvas的自动闭合 */

        //ctx.lineTo(100,100);

        /*关闭路径*/

        ctx.closePath();

        ctx.lineWidth = 10;

        /*2.描边*/

        ctx.stroke();

        /*3.填充*/

        //ctx.fill();

    </script>

</body>

</html>
<!DOCTYPE html>
<html lang="en"> <head>
<meta charset="UTF-8">
<title>Title</title>
<style>
canvas {
border: 1px solid #ccc;
}
</style>
</head> <body>
<canvas width="600" height="400"></canvas>
<script>
var myCanvas = document.querySelector('canvas');
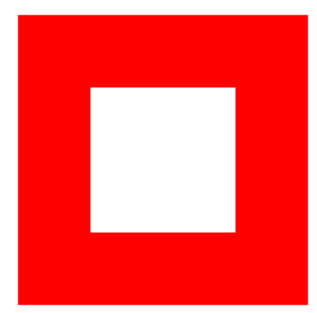
var ctx = myCanvas.getContext('2d'); /*1.绘制两个正方形 一大200一小100 套在一起*/
ctx.moveTo(100, 100);
ctx.lineTo(300, 100);
ctx.lineTo(300, 300);
ctx.lineTo(100, 300);
ctx.closePath(); ctx.moveTo(150, 150);
ctx.lineTo(150, 250);
ctx.lineTo(250, 250);
ctx.lineTo(250, 150);
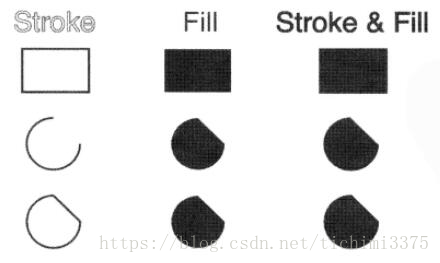
ctx.closePath(); /*2.去填充*/
//ctx.stroke();
ctx.fillStyle = 'red';
ctx.fill(); /*在填充的时候回遵循非零环绕规则*/
</script>
</body> </html>
和线相关属性方法
<!DOCTYPE html>

<html lang="en">

<head>

    <meta charset="UTF-8">

    <title>Title</title>

    <style>

        canvas {

            border: 1px solid #ccc;

        }

    </style>

</head>

<body>

    <canvas width="600" height="400"></canvas>

    <script>

        var myCanvas = document.querySelector('canvas');

        var ctx = myCanvas.getContext('2d');

        /*画平行线*/

        ctx.beginPath();

        ctx.moveTo(100, 100);

        ctx.lineTo(200, 20);

        ctx.lineTo(300, 100);

        ctx.strokeStyle = 'blue';

        ctx.lineWidth = 10;

        ctx.lineCap = 'butt';

        ctx.lineJoin = 'miter';

        ctx.stroke();

        ctx.beginPath();

        ctx.moveTo(100, 200);

        ctx.lineTo(200, 120);

        ctx.lineTo(300, 200);

        ctx.strokeStyle = 'red';

        ctx.lineWidth = 20;

        ctx.lineCap = 'square';

        ctx.lineJoin = 'bevel';

        ctx.stroke();

        ctx.beginPath();

        ctx.moveTo(100, 300);

        ctx.lineTo(200, 220);

        ctx.lineTo(300, 300);

        ctx.strokeStyle = 'green';

        ctx.lineWidth = 30;

        ctx.lineCap = 'round';

        ctx.lineJoin = 'round';

        ctx.stroke();

    </script>

</body>

</html>
绘制虚线
<!DOCTYPE html>

<html lang="en">

<head>

    <meta charset="UTF-8">

    <title>Title</title>

    <style>

        canvas {

            border: 1px solid #ccc;

        }

    </style>

</head>

<body>

    <canvas width="600" height="400"></canvas>

    <script>

        var myCanvas = document.querySelector('canvas');

        var ctx = myCanvas.getContext('2d');

        /*画线*/

        ctx.moveTo(100, 100.5);

        ctx.lineTo(300, 100.5);

        /*[5,10] 数组是用来描述你的排列方式的*/

        ctx.setLineDash([20]);

        /*获取虚线的排列方式 获取的是不重复的那一段的排列方式*/

        console.log(ctx.getLineDash());

        /*如果是正的值 往后偏移*/

        /*如果是负的值 往前偏移*/

        ctx.lineDashOffset = -20;

        ctx.stroke();

    </script>

</body>

</html>

渐变色绘制
<!DOCTYPE html>

<html lang="en">

<head>

    <meta charset="UTF-8">

    <title>Title</title>

    <style>

        canvas {

            border: 1px solid #ccc;

        }

    </style>

</head>

<body>

    <canvas width="600" height="400"></canvas>

    <script>

        var myCanvas = document.querySelector('canvas');

        var ctx = myCanvas.getContext('2d');

        /*绘制一个矩形*/

        /*线是由点构成的*/

        /*ctx.moveTo(100,100);

        ctx.lineTo(355,100);

        ctx.lineWidth = 30;*/

        /*颜色的填充*/

        //ctx.strokeStyle = '#fff';

        /*黑到白的渐变颜色*/

        /* ctx.stroke();*/

        /*线是由点构成的*/

        ctx.lineWidth = 30;

        for (var i = 0; i < 255; i++) {

            ctx.beginPath();

            ctx.moveTo(100 + i - 1, 100);

            ctx.lineTo(100 + i, 100);

            ctx.strokeStyle = 'rgb(' + i + ',0,0)';

            ctx.stroke();

        }

    </script>

</body>

</html>

- 镂空的房子
- 绘制坐标网格
<!DOCTYPE html>

<html lang="en">

<head>

    <meta charset="UTF-8">

    <title>Title</title>

    <style>

        canvas {

            border: 1px solid #ccc;

        }

    </style>

</head>

<body>

    <canvas width="600" height="400"></canvas>

    <script>

        var myCanvas = document.querySelector('canvas');

        var ctx = myCanvas.getContext('2d');

        /*1.绘制网格*/

        /*2.网格的大小*/

        var gridSize = 10;

        var canvasHeight = ctx.canvas.height;

        var canvasWidth = ctx.canvas.width;

        /*3.画多少条X轴方向的线 横线的条数  画布高度*/

        /*var canvasHeight = myCanvas.height;

        var canvasWidth = myCanvas.width;

        console.log(canvasHeight);

        console.log(canvasWidth);*/

        /*console.log(ctx.canvas.width);

        console.log(ctx.canvas.height);*/

        var xLineTotal = Math.floor(canvasHeight / gridSize);

        for (var i = 0; i <= xLineTotal; i++) {

            ctx.beginPath();

            ctx.moveTo(0, i * gridSize - 0.5);

            ctx.lineTo(canvasWidth, i * gridSize - 0.5);

            ctx.strokeStyle = '#eee';

            ctx.stroke();

        }

        /*4.画多少条Y轴方向的线*/

        var yLineTotal = Math.floor(canvasWidth / gridSize);

        for (var i = 0; i <= yLineTotal; i++) {

            ctx.beginPath();

            ctx.moveTo(i * gridSize - 0.5, 0);

            ctx.lineTo(i * gridSize - 0.5, canvasHeight);

            ctx.strokeStyle = '#eee';

            ctx.stroke();

        }

        /*5.遍历的形式去画*/

    </script>

</body>

</html>
绘制坐标系
<!DOCTYPE html>

<html lang="en">

<head>

    <meta charset="UTF-8">

    <title>Title</title>

    <style>

        canvas {

            border: 1px solid #ccc;

        }

    </style>

</head>

<body>

    <canvas width="600" height="400"></canvas>

    <script>

        var myCanvas = document.querySelector('canvas');

        var ctx = myCanvas.getContext('2d');

        /*1.绘制坐标系*/

        /*2.确定原点*/

        /*3.确定距离画布旁边的距离*/

        /*4.确定坐标轴的长度*/

        /*5.确定箭头的大小  是个等腰三角形  10 */

        /*6.绘制箭头填充*/

        var space = 20;

        var arrowSize = 10;

        /*计算原点*/

        var canvasWidth = ctx.canvas.width;

        var canvasHeight = ctx.canvas.height;

        var x0 = space;

        var y0 = canvasHeight - space;

        /*绘制x轴*/

        ctx.beginPath();

        ctx.moveTo(x0, y0);

        ctx.lineTo(canvasWidth - space, y0);

        /*箭头*/

        ctx.lineTo(canvasWidth - space - arrowSize, y0 + arrowSize / 2);

        ctx.lineTo(canvasWidth - space - arrowSize, y0 - arrowSize / 2);

        ctx.lineTo(canvasWidth - space, y0);

        ctx.fill();

        ctx.stroke();

        /*绘制y轴*/

        ctx.beginPath();

        ctx.moveTo(x0, y0);

        ctx.lineTo(space, space);

        /*箭头*/

        ctx.lineTo(space + arrowSize / 2, space + arrowSize);

        ctx.lineTo(space - arrowSize / 2, space + arrowSize);

        ctx.lineTo(space, space);

        ctx.fill();

        ctx.stroke();

    </script>

</body>

</html>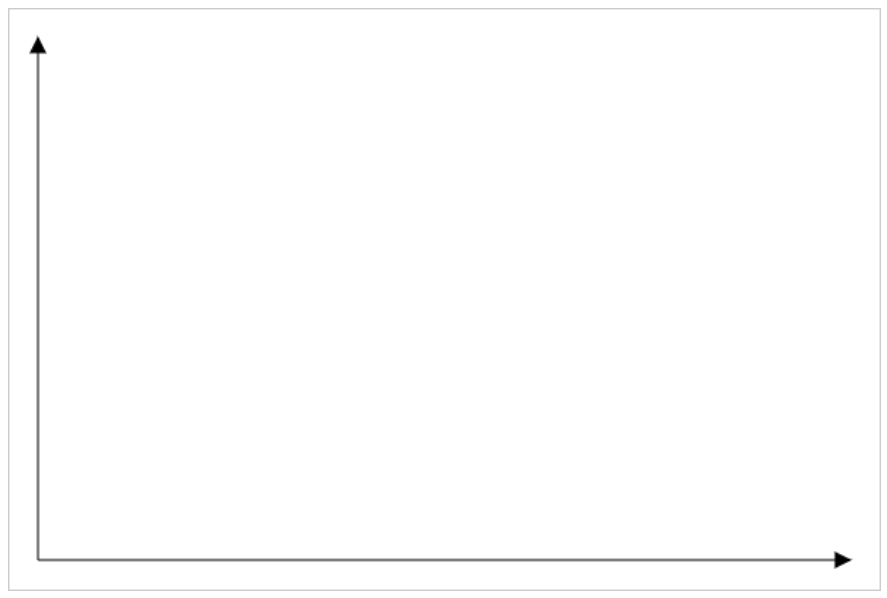
- 绘制坐标点
<!DOCTYPE html>

<html lang="en">

<head>

    <meta charset="UTF-8">

    <title>Title</title>

    <style>

        canvas {

            border: 1px solid #ccc;

        }

    </style>

</head>

<body>

    <canvas width="600" height="400"></canvas>

    <script>

        var myCanvas = document.querySelector('canvas');

        var ctx = myCanvas.getContext('2d');

        /*1.绘制点*/

        /*2.点的尺寸*/

        /*3.以坐标中心绘制点*/

        /*点坐标*/

        var coordinate = {

            x: 100,

            y: 100

        }

        /*点尺寸*/

        var dottedSize = 10;

        ctx.moveTo(coordinate.x - dottedSize / 2, coordinate.y - dottedSize / 2);

        ctx.lineTo(coordinate.x + dottedSize / 2, coordinate.y - dottedSize / 2);

        ctx.lineTo(coordinate.x + dottedSize / 2, coordinate.y + dottedSize / 2);

        ctx.lineTo(coordinate.x - dottedSize / 2, coordinate.y + dottedSize / 2);

        ctx.closePath();

        ctx.fill();

    </script>

</body>

</html>
绘制折线图
<!DOCTYPE html>

<html lang="en">

<head>

    <meta charset="UTF-8">

    <title>Title</title>

    <style>

        canvas {

            border: 1px solid #ccc;

        }

    </style>

</head>

<body>

    <canvas width="600" height="400"></canvas>

    <script>

        /*1.构造函数*/

        var LineChart = function (ctx) {

            /*获取绘图工具*/

            this.ctx = ctx || document.querySelector('canvas').getContext('2d');

            /*画布的大小*/

            this.canvasWidth = this.ctx.canvas.width;

            this.canvasHeight = this.ctx.canvas.height;

            /*网格的大小*/

            this.gridSize = 10;

            /*坐标系的间距*/

            this.space = 20;

            /*坐标原点*/

            this.x0 = this.space;

            this.y0 = this.canvasHeight - this.space;

            /*箭头的大小*/

            this.arrowSize = 10;

            /*绘制点*/

            this.dottedSize = 6;

            /*点的坐标 和数据有关系  数据可视化*/

        }

        /*2.行为方法*/

        LineChart.prototype.init = function (data) {

            this.drawGrid();

            this.drawAxis();

            this.drawDotted(data);

        };

        /*绘制网格*/

        LineChart.prototype.drawGrid = function () {

            /*x方向的线*/

            var xLineTotal = Math.floor(this.canvasHeight / this.gridSize);

            this.ctx.strokeStyle = '#eee';

            for (var i = 0; i <= xLineTotal; i++) {

                this.ctx.beginPath();

                this.ctx.moveTo(0, i * this.gridSize - 0.5);

                this.ctx.lineTo(this.canvasWidth, i * this.gridSize - 0.5);

                this.ctx.stroke();

            }

            /*y方向的线*/

            var yLineTotal = Math.floor(this.canvasWidth / this.gridSize);

            for (var i = 0; i <= yLineTotal; i++) {

                this.ctx.beginPath();

                this.ctx.moveTo(i * this.gridSize - 0.5, 0);

                this.ctx.lineTo(i * this.gridSize - 0.5, this.canvasHeight);

                this.ctx.stroke();

            }

        };

        /*绘制坐标系*/

        LineChart.prototype.drawAxis = function () {

            /*X轴*/

            this.ctx.beginPath();

            this.ctx.strokeStyle = '#000';

            this.ctx.moveTo(this.x0, this.y0);

            this.ctx.lineTo(this.canvasWidth - this.space, this.y0);

            this.ctx.lineTo(this.canvasWidth - this.space - this.arrowSize, this.y0 + this.arrowSize / 2);

            this.ctx.lineTo(this.canvasWidth - this.space - this.arrowSize, this.y0 - this.arrowSize / 2);

            this.ctx.lineTo(this.canvasWidth - this.space, this.y0);

            this.ctx.stroke();

            this.ctx.fill();

            /*Y轴*/

            this.ctx.beginPath();

            this.ctx.strokeStyle = '#000';

            this.ctx.moveTo(this.x0, this.y0);

            this.ctx.lineTo(this.space, this.space);

            this.ctx.lineTo(this.space + this.arrowSize / 2, this.space + this.arrowSize);

            this.ctx.lineTo(this.space - this.arrowSize / 2, this.space + this.arrowSize);

            this.ctx.lineTo(this.space, this.space);

            this.ctx.stroke();

            this.ctx.fill();

        };

        /*绘制所有点*/

        LineChart.prototype.drawDotted = function (data) {

            /*1.数据的坐标 需要转换 canvas坐标*/

            /*2.再进行点的绘制*/

            /*3.把线连起来*/

            var that = this;

            /*记录当前坐标*/

            var prevCanvasX = 0;

            var prevCanvasY = 0;

            data.forEach(function (item, i) {

                /* x = 原点的坐标 + 数据的坐标 */

                /* y = 原点的坐标 - 数据的坐标 */

                var canvasX = that.x0 + item.x;

                var canvasY = that.y0 - item.y;

                /*绘制点*/

                that.ctx.beginPath();

                that.ctx.moveTo(canvasX - that.dottedSize / 2, canvasY - that.dottedSize / 2);

                that.ctx.lineTo(canvasX + that.dottedSize / 2, canvasY - that.dottedSize / 2);

                that.ctx.lineTo(canvasX + that.dottedSize / 2, canvasY + that.dottedSize / 2);

                that.ctx.lineTo(canvasX - that.dottedSize / 2, canvasY + that.dottedSize / 2);

                that.ctx.closePath();

                that.ctx.fill();

                /*点的连线*/

                /*当时第一个点的时候 起点是 x0 y0*/

                /*当时不是第一个点的时候 起点是 上一个点*/

                if (i == 0) {

                    that.ctx.beginPath();

                    that.ctx.moveTo(that.x0, that.y0);

                    that.ctx.lineTo(canvasX, canvasY);

                    that.ctx.stroke();

                } else {

                    /*上一个点*/

                    that.ctx.beginPath();

                    that.ctx.moveTo(prevCanvasX, prevCanvasY);

                    that.ctx.lineTo(canvasX, canvasY);

                    that.ctx.stroke();

                }

                /*记录当前的坐标,下一次要用*/

                prevCanvasX = canvasX;

                prevCanvasY = canvasY;

            });

        };

        /*3.初始化*/

        var data = [{

                x: 100,

                y: 120

            },

            {

                x: 200,

                y: 160

            },

            {

                x: 300,

                y: 240

            },

            {

                x: 400,

                y: 120

            },

            {

                x: 500,

                y: 80

            }

        ];

        var lineChart = new LineChart();

        lineChart.init(data);

    </script>

</body>

</html>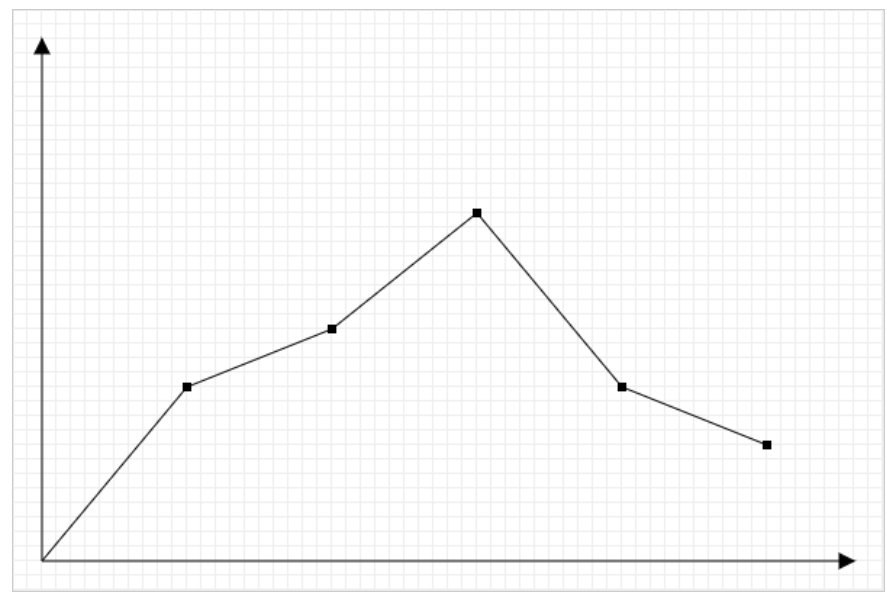
- 参考文档w3school
Canvas_APICanvas图形绘制
矩形绘制rect(x,y,w,h) 没有独立路径
strokeRect(x,y,w,h) 有独立路径,不影响别的绘制
fillRect(x,y,w,h) 有独立路径,不影响别的绘制
clearRect(x,y,w,h) 擦除矩形区域 - 绘制颜色渐变的矩形
<!DOCTYPE html>

<html lang="en">

<head>

    <meta charset="UTF-8">

    <title>Title</title>

    <style>

        canvas {

            border: 1px solid #ccc;

        }

        /*        .linearGradient{

            width: 400px;

            height: 100px;

            background-image: linear-gradient(to right,pink,blue);

        }*/

    </style>

</head>

<body>

    <div class="linearGradient"></div>

    <canvas width="600" height="400"></canvas>

    <script>

        var myCanvas = document.querySelector('canvas');

        var ctx = myCanvas.getContext('2d');

        /*fillStyle 'pink' '#000' 'rgb()' 'rgba()' */

        /*也可以使用一个渐变的方案了填充矩形*/

        /*创建一个渐变的方案*/

        /*渐变是由长度的*/

        /*x0y0 起始点 x1y1 结束点  确定长度和方向*/

        var linearGradient = ctx.createLinearGradient(100, 100, 500, 400);

        linearGradient.addColorStop(0, 'pink');

        //linearGradient.addColorStop(0.5,'red');

        linearGradient.addColorStop(1, 'blue');

        ctx.fillStyle = linearGradient;

        ctx.fillRect(100, 100, 400, 100);

        /*pink---->blue*/

        /*回想线性渐变---->要素 方向  起始颜色 结束颜色 */

        /*通过两个点的坐标可以控制 渐变方向*/

    </script>

</body>

</html>
圆弧绘制
- 弧度概念
- arc()
- x 圆心横坐标
- y 圆心纵坐标
- r 半径
- startAngle 开始角度
- endAngle 结束角度
- anticlockwise 是否逆时针方向绘制(默认false表示顺时针;true表示逆时针)
<!DOCTYPE html>

<html lang="en">

<head>

    <meta charset="UTF-8">

    <title>Title</title>

    <style>

        canvas {

            border: 1px solid #ccc;

        }

    </style>

</head>

<body>

    <canvas width="600" height="400"></canvas>

    <script>

        var myCanvas = document.querySelector('canvas');

        var ctx = myCanvas.getContext('2d');

        /*1.体验曲线的绘制*/

        /*2.线是由点构成的*/

        /*3.曲线可以由数学公式得来*/

        /*公式:y = x/2 */

        /*公式:y = (x + 2) ^2  */

        /*公式:y = sin(x) */

        for (var i = 1; i < 600; i++) {

            var x = i;

            //var y = x/2;

            //var y = Math.pow(x/10-30,2);

            var y = 50 * Math.sin(x / 10) + 100;

            ctx.lineTo(x, y);

        }

        ctx.stroke();

    </script>

</body>

</html>

strokeText()
fillText(text,x,y,maxWidth)
x,y 文本绘制的坐标(文本左下角)
maxWidth 设置文本最大宽度,可选参数
center
right
start 默认
end
如果是rtl,start和right表现一致
middle 文本的基线处于文本的正中间
bottom 文本的基线处于文本的证下方,并且有一段距离
hanging 文本的基线处于文本的正上方,并且和文本粘合
alphabetic 默认值,基线处于文本的下方,并且穿过文字
ideographic 和bottom相似,但是不一样
<!DOCTYPE html>
<html lang="en"> <head>
<meta charset="UTF-8">
<title>Title</title>
<style>
canvas {
border: 1px solid #ccc;
display: block;
margin: 100px auto;
}
</style>
</head> <body>
<canvas width="600" height="400"></canvas>
<script>
var myCanvas = document.querySelector('canvas');
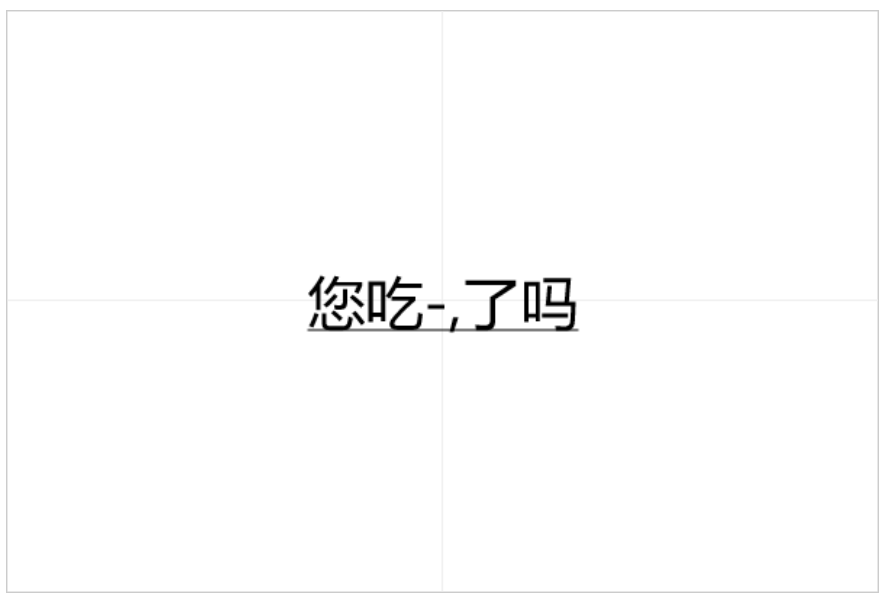
var ctx = myCanvas.getContext('2d'); /*1.在画布的中心绘制一段文字*/
/*2.申明一段文字*/
var str = '您吃-,了吗';
/*3.确定画布的中心*/
var w = ctx.canvas.width;
var h = ctx.canvas.height;
/*4.画一个十字架在画布的中心*/
ctx.beginPath();
ctx.moveTo(0, h / 2 - 0.5);
ctx.lineTo(w, h / 2 - 0.5);
ctx.moveTo(w / 2 - 0.5, 0);
ctx.lineTo(w / 2 - 0.5, h);
ctx.strokeStyle = '#eee';
ctx.stroke();
/*5.绘制文本*/
ctx.beginPath();
ctx.strokeStyle = '#000';
var x0 = w / 2;
var y0 = h / 2;
/*注意:起点位置在文字的左下角*/
/*有文本的属性 尺寸 字体 左右对齐方式 垂直对齐的方式*/
ctx.font = '40px Microsoft YaHei';
/*左右对齐方式 (center left right start end) 基准起始坐标*/
ctx.textAlign = 'center';
/*垂直对齐的方式 基线 baseline(top,bottom,middle) 基准起始坐标*/
ctx.textBaseline = 'middle';
//ctx.direction = 'rtl';
//ctx.strokeText(str,x0,y0);
ctx.fillText(str, x0, y0);
/*6.画一个下划线和文字一样长*/
ctx.beginPath();
/*获取文本的宽度*/
console.log(ctx.measureText(str));
var width = ctx.measureText(str).width;
ctx.moveTo(x0 - width / 2, y0 + 20);
ctx.lineTo(x0 + width / 2, y0 + 20);
ctx.stroke();
</script>
</body> </html>
实例练习
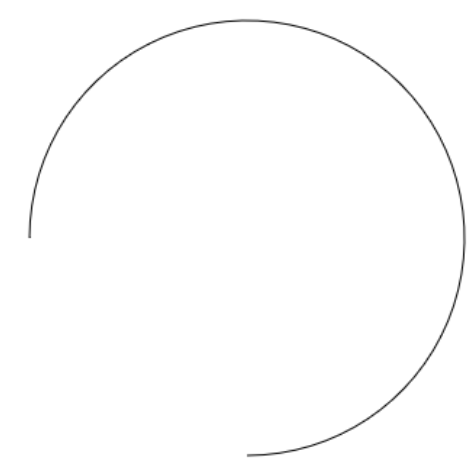
- 绘制圆弧
<!DOCTYPE html>

<html lang="en">

<head>

    <meta charset="UTF-8">

    <title>Title</title>

    <style>

        canvas {

            border: 1px solid #ccc;

        }

    </style>

</head>

<body>

    <canvas width="600" height="400"></canvas>

    <script>

        var myCanvas = document.querySelector('canvas');

        var ctx = myCanvas.getContext('2d');

        /*绘制圆弧*/

        /*确定圆心  坐标 x y*/

        /*确定圆半径  r */

        /*确定起始绘制的位置和结束绘制的位置  确定弧的长度和位置  startAngle endAngle   弧度*/

        /*取得绘制的方向 direction 默认是顺时针 false 逆时针 true */

        /*在中心位置画一个半径150px的圆弧左下角*/

        var w = ctx.canvas.width;

        var h = ctx.canvas.height;

        ctx.arc(w / 2, h / 2, 150, Math.PI / 2, Math.PI, true);

        ctx.stroke();

    </script>

</body>

</html>
绘制扇形
<!DOCTYPE html>

<html lang="en">

<head>

    <meta charset="UTF-8">

    <title>Title</title>

    <style>

        canvas {

            border: 1px solid #ccc;

        }

    </style>

</head>

<body>

    <canvas width="600" height="400"></canvas>

    <script>

        var myCanvas = document.querySelector('canvas');

        var ctx = myCanvas.getContext('2d');

        /*在中心位置画一个半径150px的圆弧右上角 扇形  边  填充 */

        var w = ctx.canvas.width;

        var h = ctx.canvas.height;

        /*把起点放到圆心位置*/

        ctx.moveTo(w / 2, h / 2);

        ctx.arc(w / 2, h / 2, 150, 0, -Math.PI / 2, true);

        /*闭合路径*/

        //ctx.closePath();

        ctx.fill();

    </script>

</body>

</html>

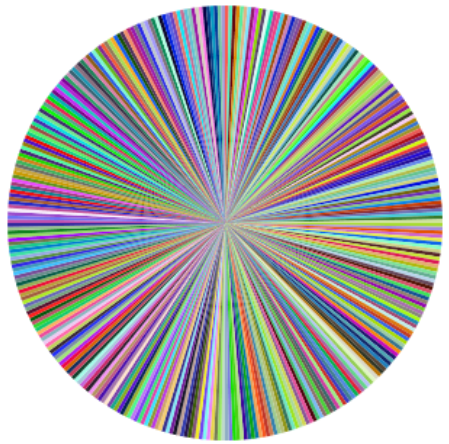
绘制一个圆分成六等分颜色随机
<!DOCTYPE html>

<html lang="en">

<head>

    <meta charset="UTF-8">

    <title>Title</title>

    <style>

        canvas {

            border: 1px solid #ccc;

        }

    </style>

</head>

<body>

    <canvas width="600" height="400"></canvas>

    <script>

        var myCanvas = document.querySelector('canvas');

        var ctx = myCanvas.getContext('2d');

        var w = ctx.canvas.width;

        var h = ctx.canvas.height;

        /*分成几等分*/

        var num = 360;

        /*一份多少弧度*/

        var angle = Math.PI * 2 / num;

        /*原点坐标*/

        var x0 = w / 2;

        var y0 = h / 2;

        /*获取随机颜色*/

        var getRandomColor = function () {

            var r = Math.floor(Math.random() * 256);

            var g = Math.floor(Math.random() * 256);

            var b = Math.floor(Math.random() * 256);

            return 'rgb(' + r + ',' + g + ',' + b + ')';

        }

        /*上一次绘制的结束弧度等于当前次的起始弧度*/

        //var startAngle = 0;

        for (var i = 0; i < num; i++) {

            var startAngle = i * angle;

            var endAngle = (i + 1) * angle;

            ctx.beginPath();

            ctx.moveTo(x0, y0);

            ctx.arc(x0, y0, 150, startAngle, endAngle);

            /*随机颜色*/

            ctx.fillStyle = getRandomColor();

            ctx.fill();

        }

    </script>

</body>

</html>
绘制饼图
<!DOCTYPE html>

<html lang="en">

<head>

    <meta charset="UTF-8">

    <title>Title</title>

    <style>

        canvas {

            border: 1px solid #ccc;

            display: block;

            margin: 100px auto;

        }

    </style>

</head>

<body>

    <canvas width="600" height="400"></canvas>

    <script>

        /*var myCanvas = document.querySelector('canvas');

    var ctx = myCanvas.getContext('2d');*/

        /*1.绘制饼状态图*/

        /*1.1 根据数据绘制一个饼图*/

        /*1.2 绘制标题 从扇形的弧中心伸出一条线在画一条横线在横线的上面写上文字标题*/

        /*1.3 在画布的左上角 绘制说明 一个和扇形一样颜色的矩形 旁边就是文字说明*/

        var PieChart = function (ctx) {

            /*绘制工具*/

            this.ctx = ctx || document.querySelector('canvas').getContext('2d');

            /*绘制饼图的中心*/

            this.w = this.ctx.canvas.width;

            this.h = this.ctx.canvas.height;

            /*圆心*/

            this.x0 = this.w / 2 + 60;

            this.y0 = this.h / 2;

            /*半径*/

            this.radius = 150;

            /*伸出去的线的长度*/

            this.outLine = 20;

            /*说明的矩形大小*/

            this.rectW = 30;

            this.rectH = 16;

            this.space = 20;

        }

        PieChart.prototype.init = function (data) {

            /*1.准备数据*/

            this.drawPie(data);

        };

        PieChart.prototype.drawPie = function (data) {

            var that = this;

            /*1.转化弧度*/

            var angleList = this.transformAngle(data);

            /*2.绘制饼图*/

            var startAngle = 0;

            angleList.forEach(function (item, i) {

                /*当前的结束弧度要等于下一次的起始弧度*/

                var endAngle = startAngle + item.angle;

                that.ctx.beginPath();

                that.ctx.moveTo(that.x0, that.y0);

                that.ctx.arc(that.x0, that.y0, that.radius, startAngle, endAngle);

                var color = that.ctx.fillStyle = that.getRandomColor();

                that.ctx.fill();

                /*下一次要使用当前的这一次的结束角度*/

                /*绘制标题*/

                that.drawTitle(startAngle, item.angle, color, item.title);

                /*绘制说明*/

                that.drawDesc(i, item.title);

                startAngle = endAngle;

            });

        };

        PieChart.prototype.drawTitle = function (startAngle, angle, color, title) {

            /*1.确定伸出去的线 通过圆心点 通过伸出去的点  确定这个线*/

            /*2.确定伸出去的点 需要确定伸出去的线的长度*/

            /*3.固定伸出去的线的长度*/

            /*4.计算这个点的坐标*/

            /*5.需要根据角度和斜边的长度*/

            /*5.1 使用弧度  当前扇形的起始弧度 + 对应的弧度的一半 */

            /*5.2 半径+伸出去的长度 */

            /*5.3 outX = x0 + cos(angle) * ( r + outLine)*/

            /*5.3 outY = y0 + sin(angle) * ( r + outLine)*/

            /*斜边*/

            var edge = this.radius + this.outLine;

            /*x轴方向的直角边*/

            var edgeX = Math.cos(startAngle + angle / 2) * edge;

            /*y轴方向的直角边*/

            var edgeY = Math.sin(startAngle + angle / 2) * edge;

            /*计算出去的点坐标*/

            var outX = this.x0 + edgeX;

            var outY = this.y0 + edgeY;

            this.ctx.beginPath();

            this.ctx.moveTo(this.x0, this.y0);

            this.ctx.lineTo(outX, outY);

            this.ctx.strokeStyle = color;

            /*画文字和下划线*/

            /*线的方向怎么判断 伸出去的点在X0的左边 线的方向就是左边*/

            /*线的方向怎么判断 伸出去的点在X0的右边 线的方向就是右边*/

            /*结束的点坐标  和文字大小*/

            this.ctx.font = '14px Microsoft YaHei';

            var textWidth = this.ctx.measureText(title).width;

            if (outX > this.x0) {

                /*右*/

                this.ctx.lineTo(outX + textWidth, outY);

                this.ctx.textAlign = 'left';

            } else {

                /*左*/

                this.ctx.lineTo(outX - textWidth, outY);

                this.ctx.textAlign = 'right';

            }

            this.ctx.stroke();

            this.ctx.textBaseline = 'bottom';

            this.ctx.fillText(title, outX, outY);

        };

        PieChart.prototype.drawDesc = function (index, title) {

            /*绘制说明*/

            /*矩形的大小*/

            /*距离上和左边的间距*/

            /*矩形之间的间距*/

            this.ctx.fillRect(this.space, this.space + index * (this.rectH + 10), this.rectW, this.rectH);

            /*绘制文字*/

            this.ctx.beginPath();

            this.ctx.textAlign = 'left';

            this.ctx.textBaseline = 'top';

            this.ctx.font = '12px Microsoft YaHei';

            this.ctx.fillText(title, this.space + this.rectW + 10, this.space + index * (this.rectH + 10));

        };

        PieChart.prototype.transformAngle = function (data) {

            /*返回的数据内容包含弧度的*/

            var total = 0;

            data.forEach(function (item, i) {

                total += item.num;

            });

            /*计算弧度 并且追加到当前的对象内容*/

            data.forEach(function (item, i) {

                var angle = item.num / total * Math.PI * 2;

                item.angle = angle;

            });

            return data;

        };

        PieChart.prototype.getRandomColor = function () {

            var r = Math.floor(Math.random() * 256);

            var g = Math.floor(Math.random() * 256);

            var b = Math.floor(Math.random() * 256);

            return 'rgb(' + r + ',' + g + ',' + b + ')';

        };

        var data = [{

                title: '15-20岁',

                num: 6

            },

            {

                title: '20-25岁',

                num: 30

            },

            {

                title: '25-30岁',

                num: 10

            },

            {

                title: '30以上',

                num: 8

            }

        ];

        var pieChart = new PieChart();

        pieChart.init(data);

    </script>

</body>

</html>

绘制图片
x,y 图片绘制的左上角
x,y 图片绘制的左上角
w,h 图片绘制尺寸设置(图片缩放,不是截取)
x,y,w,h 图片中的一个矩形区域
x1,y1,w1,h1 画布中的一个矩形区域
<!DOCTYPE html>

<html lang="en">

<head>

    <meta charset="UTF-8">

    <title>Title</title>

    <style>

        canvas {

            border: 1px solid #ccc;

        }

    </style>

</head>

<body>

    <!--<img src="data:image/01.jpg" alt="">-->

    <canvas width="600" height="400"></canvas>

    <script>

        var myCanvas = document.querySelector('canvas');

        var ctx = myCanvas.getContext('2d');

        /*1.加载图片到内存即可*/

        /*var img = document.createElement('img');

        img.src = 'image/01.jpg';*/

        /*创建对象*/

        var image = new Image();

        /*绑定加载完成事件*/

        image.onload = function () {

            /*实现图片绘制*/

            console.log(image);

            /*绘制图片的三种方式*/

            /*3参数*/

            /*图片对象*/

            /*绘制在画布上的坐标 x y*/

            //ctx.drawImage(image,100,100);

            /*5个参数*/

            /*图片对象*/

            /*绘制在画布上的坐标 x y*/

            /*是图片的大小  不是裁剪  是缩放*/

            //ctx.drawImage(image,100,100,100,100);

            /*9个参数*/

            /*图片对象*/

            /*图片上定位的坐标  x y */

            /*在图片上截取多大的区域  w h*/

            /*绘制在画布上的坐标 x y*/

            /*是图片的大小  不是裁剪  是缩放*/

            ctx.drawImage(image, 400, 400, 400, 400, 200, 200, 100, 100);

        };

        /*设置图片路径*/

        image.src = 'image/02.jpg';

    </script>

</body>

</html>
Web前端学习笔记——Canvas的更多相关文章
- 【前端】Web前端学习笔记【2】
[2016.02.22至今]的学习笔记. 相关博客: Web前端学习笔记[1] 1. this在 JavaScript 中主要有以下五种使用场景 在全局函数调用中,this 绑定全局对象,浏览器环境全 ...
- 【前端】Web前端学习笔记【1】
... [2015.12.02-2016.02.22]期间的学习笔记. 相关博客: Web前端学习笔记[2] 1. JS中的: (1)continue 语句 (带有或不带标签引用)只能用在循环中. ( ...
- Web前端学习笔记(001)
....编号 ........类别 ............条目 ................明细....................时间 一.Web前端学习笔记 ...
- web前端学习笔记
web前端学习笔记(CSS盒子的定位) 相对定位 使用相对定位的盒子的位置常以标准流的排版方式为基础,然后使盒子相对于它在原本的标准位置偏移指定的距离.相对定位的盒子仍在标准流中,它后面的盒子仍以标准 ...
- web前端学习笔记:文本属性
今天的web前端笔记主要讲述文本属性,希望能帮助到正在学习web前端开发的初学者们,废话不多说了,一起来看看文本属性的相关内容吧. 文本属性 文本缩进 将Web页面上的一个段落第一行缩进,这是一种最常 ...
- web前端学习笔记(二)---Django
[前言]前面(一)学习了web的基础知识,介绍到了MVC,项目使用一个Django框架. Django book:https://code.ziqiangxuetang.com/django/djan ...
- Web前端学习笔记:Bootstrap框架
很久之前就有很多人给我推荐twitter的Bootstrap框架,但是直到前几天我才真正学习了下Bootstrap,的确是相当棒的框架,至少从视觉体验上超越了很多以前碰到了前端UI框架.今天我要聊聊B ...
- Web前端学习笔记之jQuery基础
0x0 jQuery介绍 jQuery是一个轻量级的.兼容多浏览器的JavaScript库. jQuery使用户能够更方便地处理HTML Document.Events.实现动画效果.方便地进行Aja ...
- Web前端学习笔记之BootStrap
Bootstrap介绍 Bootstrap是Twitter开源的基于HTML.CSS.JavaScript的前端框架. 它是为实现快速开发Web应用程序而设计的一套前端工具包. 它支持响应式布局,并且 ...
随机推荐
- 【Zookeeper】应用场景概述
一.数据发布与订阅(配置中心) 二.负载均衡 三.命名服务(Naming Service) 四.分布式通知/协调 五.集群管理与Master选举 六.分布式锁 七.分布式事务 一.数据发布与订阅(配置 ...
- Linux下的帮助命令(man/help/info)
1.man 帮助命令 用法 man(选项)(参数) 选项 -a:在所有的man帮助手册中搜索: -f:等价于whatis指令,显示给定关键字的简短描述信息: -P:指定内容时使用分页程序: -M:指定 ...
- 15、TDM模型
论文:https://arxiv.org/pdf/1801.02294.pdf 解析: 学习基于树的推荐系统深度模型 Learning Tree-based DeepModel for Recomme ...
- 基于 es6 的 javascript 实用方法
一.求数字数组的平均数 - 使用 数组的 reduce() 方法将每个值添加到累加器,初始值为0,总和除以数组长度. const average = arr => arr.reduce((acc ...
- django中非菜单权限的归属
非菜单权限的归属 : 1.设置表结构 : 在权限表中添加自连接的外键patent,parent_id连接permission表的id,可为空,当有parent_id时,说明它是一个普通 ...
- [Google Guava] 1.1-使用和避免null
原文链接 译文链接 译者: 沈义扬 Doug Lea 说,“Null 真糟糕.” 当Sir C. A. R. Hoare 使用了null引用后说,”使用它导致了十亿美金的错误.” 轻率地使用 ...
- Educational Codeforces Round 37 (Rated for Div. 2) 920E E. Connected Components?
题 OvO http://codeforces.com/contest/920/problem/E 解 模拟一遍…… 1.首先把所有数放到一个集合 s 中,并创建一个队列 que 2.然后每次随便取一 ...
- Jenkins 自动化构建
def pipeId = 1130561944231279390 def pipeLogId def isTagOrBranch def tagOrBranch def imageId def add ...
- MySQL 8.0.3性能大杀器 —— CATS 事务调度新算发
转载自:https://www.sohu.com/a/203933205_487483?sec=wd&spm=smpc.author.fd-d.2.1557386676880JSjtJwV 好 ...
- controller层直接通过server类调用mapper的通用方法
自己写的方法没有,但是逆向生成的server类会有继承maybatis-plus的框架 与下图的配置有关