echarts图表自适应盒子的大小(盒子的大小是动态改变的),大到需要全屏展示
项目中用到了echarts,并且页面是自适应的,且页面中有一个【放大、缩小】功能,因此图表还需要根据盒子的大小来变化。
即:两个需求,如下:
① 图表根据窗口的大小自适应
② 图表根据所在盒子的大小自适应
1、窗口大小自适应好说,可以通过
 let myChart = This.$echarts.init(document.getElementById(This.id));

 window.addEventListener('resize',() => { myChart.resize(); });

 或

 window.onresize = myChart.resize;
注意:如果是一个页面中插入多个echarts图,那么需要用第一种方式来监听resize事件,即:window.addEventListener,若选用第二种方法只能监听一个echarts图的自适应。区别在于addEventListener与on上,有兴趣可以自行查阅。
2、按理来说上面的代码对盒子大小的改变,图表自适应也是好使的,但就是出现了问题,而且各种给盒子添加监听也没有好使,所以就想了一个极端点儿的方法,如下,通过延时的方式进行加载
let timer;

clearTimeout(timer);

timer = setTimeout(() => {

    let myChart = this.$echarts.init(document.getElementById('myChart'));

    myChart.resize();

}, 10);
这里时间定义的是10毫秒,从用户的角度来看是根本感觉不出来的,而且没有出现图表卡顿的地方,暂时搞定,有好的解决办法了再来重写
以下是全部代码:
<template>
<div class="comprehensiveAnalysis">
<!-- 调度机构 -->
<div class="dispatchOrgan">
<span class="title">调度机构</span>
<ul class="navList">
<li v-for="(item, index) in dispatchOrgan" :key="index" :class="{'active' : currentIndex == index}" :data-id="item.id" @click="chooseOragn(index)">{{item.title}}</li>
</ul>
</div> <!-- 综合分析 -->
<ul class="synthesizeAnalysis">
<!-- 全网装机规模统计 -->
<li>
<div class="cnt" id="ancestors" ref="ancestors" :class="{'full' : isFullScreen}">
<!-- <h3 class="title">全网装机规模统计</h3> -->
<div class="titleOperate">
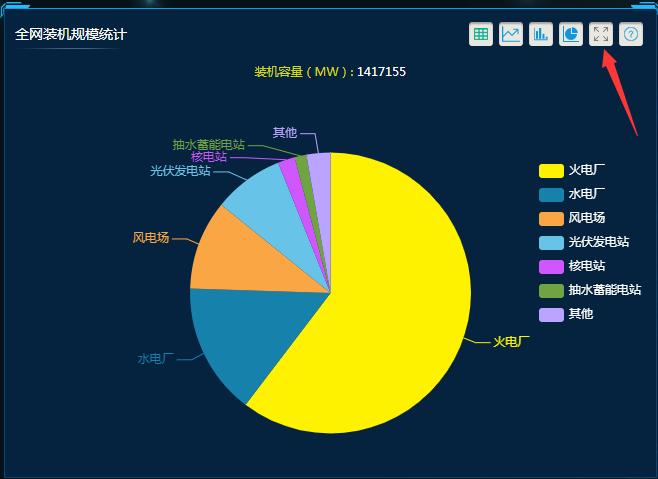
<span class="title">全网装机规模统计</span>
<ul class="operateWrapper">
<li title="切换表格数据"><span class="tableBtn" @click="changeTableData"></span></li>
<li title="切换折线图"><span class="lineBtn" @click="changeCharts('line')"></span></li>
<li title="切换柱状图"><span class="barBtn" @click="changeCharts('bar')"></span></li>
<li title="切换饼图"><span class="pieBtn" @click="changeCharts('pie')"></span></li>
<li title="放大" v-show="isFullBtn"><span class="fullBtn" @click="fullScreen"></span></li>
<li title="缩小" v-show="isNarrow"><span class="narrowBtn" @click="narrowScreen"></span></li>
<li title="统计提示"><span class="helpBtn"></span></li>
</ul>
</div>
<div class="countShow">装机容量(MW): <span>{{installCapacity}}</span></div>
<div class="chartWrapper">
<div id="myChart" :style="{width: '100%', height: '100%'}"></div>
</div>
</div>
</li>
<!-- 全网电站规模统计 -->
<li>
<div class="cnt">
<h3 class="title">全网电站规模统计</h3>
<div class="chartWrapper"></div>
</div>
</li>
<!-- 排名前十流域装机容量统计 -->
<li>
<div class="cnt">
<h3 class="title">排名前十流域装机容量统计</h3>
<div class="chartWrapper"></div>
</div>
</li>
<!-- 文档规模统计 -->
<li>
<div class="cnt">
<h3 class="title">文档规模统计</h3>
<div class="chartWrapper"></div>
</div>
</li>
</ul>
</div>
</template> <script>
export default {
data() {
return {
isFullBtn: true, // flag:是否显示放大图标
isNarrow: false, // flag:是否显示缩小图标
isFullScreen: false, // flag:小模块是否全屏展示
currentIndex: 0, // 导航添加类名的元素
installCapacity: 0, // 装机容量
stationCount: 0, // 电站数量(座)
installEquipmentName: [], // 全网装机规模 -- 容量数组
nameCapacity: [], // 全网装机规模 -- 容量、名称数组
capacityColor: ['#fef200','#1682ac','#fba644','#67c4e8','#d056ff','#70a442','#bba4ff'], // 可视化图形echarts颜色
// 调度机构tab
dispatchOrgan: [{
id: '002199010000000001',
title: ' 全网'
},{
id: '002199010000000001',
title: '国调直调'
},{
id: '002199010100000001',
title: '华北'
},{
id: '002199010200000001',
title: '华东'
},{
id: '002199010300000001',
title: '华中'
},{
id: '002199010400000001',
title: '东北'
},{
id: '002199010500000001',
title: '西北'
},{
id: '002199010600000001',
title: '西南'
}],
// 全网装机规模
installEquipmentScale: [{
"NAME": "火电厂",
"CODE": 1001,
"CAPACITY": 855291.140000,
"COU": 1132
}, {
"NAME": "水电厂",
"CODE": 1002,
"CAPACITY": 214782.470000,
"COU": 603
}, {
"NAME": "风电场",
"CODE": 1004,
"CAPACITY": 145876.400000,
"COU": 786
}, {
"NAME": "光伏发电站",
"CODE": 1005,
"CAPACITY": 115118.670000,
"COU": 437
}, {
"NAME": "核电站",
"CODE": 1003,
"CAPACITY": 27687.600000,
"COU": 10
}, {
"NAME": "抽水蓄能电站",
"CODE": 1006,
"CAPACITY": 19379.200000,
"COU": 22
}, {
"CAPACITY": 39019.91,
"COU": 2885,
"CODE": "1009",
"NAME": "其他"
}],
}
},
created() {
// 计算:装机容量
this.installEquipmentScale.forEach(item => {
this.installCapacity += item.CAPACITY;
this.installEquipmentName.push(item.NAME);
this.nameCapacity.push({
name: item.NAME,
value: item.CAPACITY
})
}); // 装机容量取整
this.installCapacity = parseInt(this.installCapacity); // 计算:电站数量(座)
this.powerStationScale.forEach(item => {
this.stationCount += item.cou;
}); // echarts1:全网装机规模
},
mounted() {
this.drawLine();
},
methods: {
// 点击'调度机构'
chooseOragn(index) {
this.currentIndex = index;
},
// 切换表格数据
changeTableData() {
console.log('切换表格数据')
},
// 切换折线图、切换柱状图
changeCharts(type) {
console.log('切换折线图:',type)
},
// 放大
fullScreen() {
this.isFullBtn = false; // flag:是否显示放大图标
this.isNarrow = true; // flag:是否显示缩小图标
this.isFullScreen = true; // flag:小模块是否全屏展示 this.changeChartsSize(); // 点击'放大'、'缩小'时改变图表的大小
},
// 缩小
narrowScreen() {
this.isFullBtn = true; // flag:是否显示放大图标
this.isNarrow = false; // flag:是否显示缩小图标
this.isFullScreen = false; // flag:小模块是否全屏展示 this.changeChartsSize(); // 点击'放大'、'缩小'时改变图表的大小 },
// 点击'放大'、'缩小'时改变图表的大小
changeChartsSize() {
let timer;
clearTimeout(timer);
timer = setTimeout(() => {
let myChart = this.$echarts.init(document.getElementById('myChart'));
myChart.resize();
}, 10);
},
// 绘图
drawLine() {
// 基于准备好的dom,初始化echarts实例
let myChart = this.$echarts.init(document.getElementById('myChart'));
// 绘制图表 -- pie 饼状图
myChart.setOption({
color: this.capacityColor,
tooltip : { // 提示框组件
trigger: 'item', // item:数据项图形触发,散点图、饼图等无类目轴,axis:坐标轴触发,柱状图、折线图,none:不触发
// formatter: "{a} <br/>{b} : {c} ({d}%)"
},
legend: { // 图例组件:展现了不同系列的标记、颜色和名字。可以通过点击图例控制哪些系列不显示
type: 'plain', // scroll:可滚动翻页的图例,图例较多时使用,plain:普通图例
orient: 'vertical', // 图例列表的布局朝向,vertical:垂直,horizontal:水平
right: 10, // 图例组件离容器【右侧】的距离
top: 100, // 图例组件离容器【上侧】的距离
data: this.installEquipmentName,
textStyle: { // 图例的公用文本样式
color: '#fff'
}
},
series : [ // 系列列表,每个系列通过type决定自己的图表类型
{
type: 'pie', // line:折线/面积图,bar:柱状/条形图,pie:饼图,scatter:散点(气泡)图,radar:雷达图,
radius : '60%', // 饼图的半径,'60%':外半径为可视区域尺寸的60%
center: ['50%', '50%'], // 饼图的中心坐标,横/纵坐标
data: this.nameCapacity,
itemStyle: { // 图形样式
emphasis: { // 高亮的扇区和标签样式
shadowBlur: 10,
shadowOffsetX: 0,
shadowColor: 'rgba(0, 0, 0, 0.5)'
}
}
}
]
}) window.onresize = myChart.resize;
}
}
}
</script> <style lang="scss" type="text/css">
@import '../../common/scss/vars.scss';
.comprehensiveAnalysis {
width: 100%;
height: 100%;
.dispatchOrgan {
padding-left: 1px;
height: 24px;
line-height: 24px;
box-sizing: border-box;
font-size: 0;
.title {
margin-right: 12px;
display: inline-block;
width: 75px;
height: 24px;
background: url('./xdbg.png') no-repeat;
text-align: center;
font-size: 14px;
color: $dispatchFontColor;
}
.navList {
display: inline-block;
>li {
margin-right: 5px;
display: inline-block;
width: 66px;
height: 24px;
font-size: 14px;
color: $whiteFontColor;
text-align: center;
border: 1px solid transparent;
box-sizing: border-box;
cursor: pointer;
&.active {
color: $activeFontColor;
background-color: $dispatchBgColor;
border: 1px solid $dispatchBorderColor;
}
}
}
}
.synthesizeAnalysis {
height: calc(100% - 24px);
>li {
float: left;
position: relative;
padding: 12px 6px 0;
width: 50%;
height: 50%;
box-sizing: border-box;
&::before, &::after {
content: '';
position: absolute;
top: 6px;
width: 32px;
height: 17px;
}
&::before {
left: 0px;
background: url('./lefconer.png') no-repeat;
}
&::after {
right: 0px;
background: url('./rigconer.png') no-repeat;
}
>.cnt {
position: relative;
width: 100%;
height: 100%;
background-color: $statisticsBgColor;
border: 1px solid $statisticsBorderColor;
border-top-color: $statisticsBdTopColor;
box-sizing: border-box;
&.full {
position: fixed;
top: 0;
left: 0;
z-index: 999;
}
>.titleOperate {
padding: 10px;
height: 50px;
line-height: 30px;
color: $whiteFontColor;
box-sizing: border-box;
>.title {
float: left;
font-size: 14px;
background: url('./light.png') no-repeat center bottom;
background-size: contain;
}
>.operateWrapper {
float: right;
display: flex;
padding-top: 3px;
>li {
flex: 1;
margin: 0 3px;
width: 24px;
height: 24px;
cursor: pointer;
background: url('../../images/into.png') no-repeat center center;
&:hover,&.hover {
background: url('../../images/hover.png') no-repeat center center;
}
>span {
display: block;
width: 100%;
height: 100%;
&.tableBtn {
background: url('../../images/table.png') no-repeat center center;
}
&.lineBtn {
background: url('../../images/chart_line.png') no-repeat center center;
}
&.barBtn {
background: url('../../images/chart_bar.png') no-repeat center center;
}
&.pieBtn {
background: url('../../images/chart_pie.png') no-repeat center center;
}
&.fullBtn {
background: url('../../images/fullscreen.png') no-repeat center center;
}
&.narrowBtn {
background: url('../../images/narrow.png') no-repeat center center;
}
&.helpBtn {
background: url('../../images/help.png') no-repeat center center;
}
}
}
}
}
>.countShow {
line-height: 25px;
text-align: center;
color: $numTipFontColor;
font-size: 12px;
>span {
color: $whiteFontColor;
}
}
>.chartWrapper {
position: absolute;
top: 50px;
left: 0;
width: 100%;
height: 100%;
}
}
}
}
}
</style>
补充:如何实现点击放大按钮时全屏展示?
修改所在盒子的样式,如下:
.full {

  position: fixed;

  top: 0;

  left: 0;

  z-index: 9;

}
缩小时,移除这个类型即可。
echarts图表自适应盒子的大小(盒子的大小是动态改变的),大到需要全屏展示的更多相关文章
- echarts 图表自适应外部盒子大小
项目中用到了echarts,由于页面是自适应的,还得兼容移动, 因此图表还需要根据盒子的大小来变化. 自适应窗口及盒子大小 页面中有一个[放大.缩小]功能,及全屏展示和预览图表 窗口自适应 let m ...
- Angular echarts图表自适应屏幕指令
关于echarts图表自适应问题 一.引入js文件 1. 在html页面引入angular.min.js文件 2. 在html页面引入echarts.min.js文件 3. 在html页面引入app. ...
- echarts图表自适应浏览器窗口的大小
echarts问题描述 当浏览器窗口发生变化时,echarts图表未能自适应浏览器的变化,产生如下的效果 解决方案 在$(function(){}中添加 window.onresize = funct ...
- 给echarts加个“全屏展示”
echarts的工具箱并没有提供放大/全屏的功能, 查找文档发现可自定义工具https://www.echartsjs.com/option.html#toolbox.feature show代码 t ...
- 一起来玩echarts系列(二)------echarts图表自适应问题
为了直观查看公司服务器各个进程占用的内存动态情况,我使用echarts进行数据可视化,具体的实现过程按下不表. 最后实现的效果如图: 然后问题就来了,因UI采用了Bootstrap响应式框架,所以除了 ...
- echarts图表自适应,容器宽度设置为百分比,但是图表显示不全,缩到一起
<div id="chartContainer" style="height:100%;width:100%;"></div> cha ...
- echarts图表自适应
当页面上只引入一个图表 window.onresize= () =>{ myEchart.resize() } 当引入多个时,上面的方法只会影响最后一个图表 window.addEventLis ...
- echarts 饼图 + 全屏显示
效果图: 代码: <!DOCTYPE html> <html lang="en"> <head> <meta charset=" ...
- echarts图表初始大小问题及echarts随窗口变化自适应
最近在做一个轮播图,使用的是element的Carousel走马灯,每一个走马灯里是eachrts图,开始页面加载的时候发现echarts图并不能自适应,开始以为是走马灯的问题,后来发现不是 不知道大 ...
随机推荐
- Jenkins Publish FTP远程部署过程
步骤: 1.安装FileZilla FTP Server 2.添加FTP账号: 1.Edit——Users——Add 2.Edit——Users——Shared folders 3.下载FileZil ...
- 移动App双周版本迭代策略
对于移动互联网产品来说,迭代的速度就是生命.我创业时做移动App时是一周一版,而现在是2周1版.相比起小公司,大公司迭代时间虽长,却更为不易,因为大公司流程更多,参与人数更多,需求更多,实现这样的快速 ...
- numpy之数组属性与方法
# coding=utf-8import numpy as npimport random # nan是一个float类型 ,not a num不是一个数字;inf,infinite 无穷 # 轴的概 ...
- Appium移动自动化测试(二)之appuim + 夜神模拟器
环境搭建起来之后, 就可以开始移动自动化了. 但是使用自带的AVD开启模拟器, 速度实在太慢. 于是用夜神来做替代, 稍微能够有一些提速. 启动appuim 打开Appium,点击右上角Start按钮 ...
- layui弹出层处理(获取、操作弹出层数据等)
要点: 字符串被渲染为弹窗层之后,回自动转换为DOM,可以使用jq进行各种操作 <!DOCTYPE html> <html> <head> <meta cha ...
- css3图片变灰
html{ filter:grayscale(100%); -webkit-filter:grayscale(100%); -moz-filter:grayscale(100%); -ms-filte ...
- shader飞线改进版
项目github地址:https://github.com/ecojust/flyline 前面写过一个飞线(基于THREE.Line进行的颜色变化),只是简单地将可视区片元颜色的alpha通道值设为 ...
- PJzhang:如何在裸奔的年代找到一些遮羞布
猫宁!!! 很久以前的一篇,搬过来. 我一直在“裸奔”,而且很久了,只是不太愿意承认. 想起了“皇帝的新装”,好奇何种经历和灵感让安徒生写出了如此精彩的故事. 一次百度了一个商品,不久接到了大规模电话 ...
- mobile/immobile species的区别
在地下水反应运移模型中: “mobile species” 涉及运移和反应过程(transport+reaction) “immobile” species 只涉及反应过程 (reaction)
- 【机器学习】梯度、Hessian矩阵、平面方程的法线以及函数导数的含义
想必单独论及" 梯度.Hessian矩阵.平面方程的法线以及函数导数"等四个基本概念的时候,绝大部分人都能够很容易地谈个一二三,基本没有问题. 其实在应用的时候,这几个概念经常被混 ...