bokeh-scala
使用bokeh-scala进行数据可视化
目录
一、前言
最近在使用spark集群以及geotrellis框架(相关文章见http://www.cnblogs.com/shoufengwei/p/5619419.html)进行分布式空间地理系统设计(暂且夸大称之为地理信息系统),虽说是空间地理信息系统但是也少不了数据可视化方面的操作,所以就想寻找一款支持大数据的可视化框架,网上查阅半天发现bokeh不错(其实是老板直接指明方向说用这款),恰好bokeh也有scala语言的封装,Github地址,于是拿来练练手,算是做个技术储备。
二、bokeh简介及胡扯
bokeh是一个python下的大数据可视化框架Github地址。其官网对其介绍如下:
Bokeh is a Python interactive visualization library that targets modern web browsers for presentation. Bokeh provides elegant, concise construction of novel graphics with high-performance interactivity over very large or streaming datasets in a quick and easy way.
根据我拙劣的英语水平翻译如下:
Bokeh是一个基于Python语言的显示于新式浏览器中的交互式的可视化类库。Bokeh提供了一种快速且简单的基于大数据以及流式数据的高性能的可交互式的优雅的简洁的图表制作。
比较拗口,总体意思就是Bokeh能够很好的支持大数据下的可交互式的数据可视化,新式浏览器应当是支持HTML5的浏览器,不过还未考证。
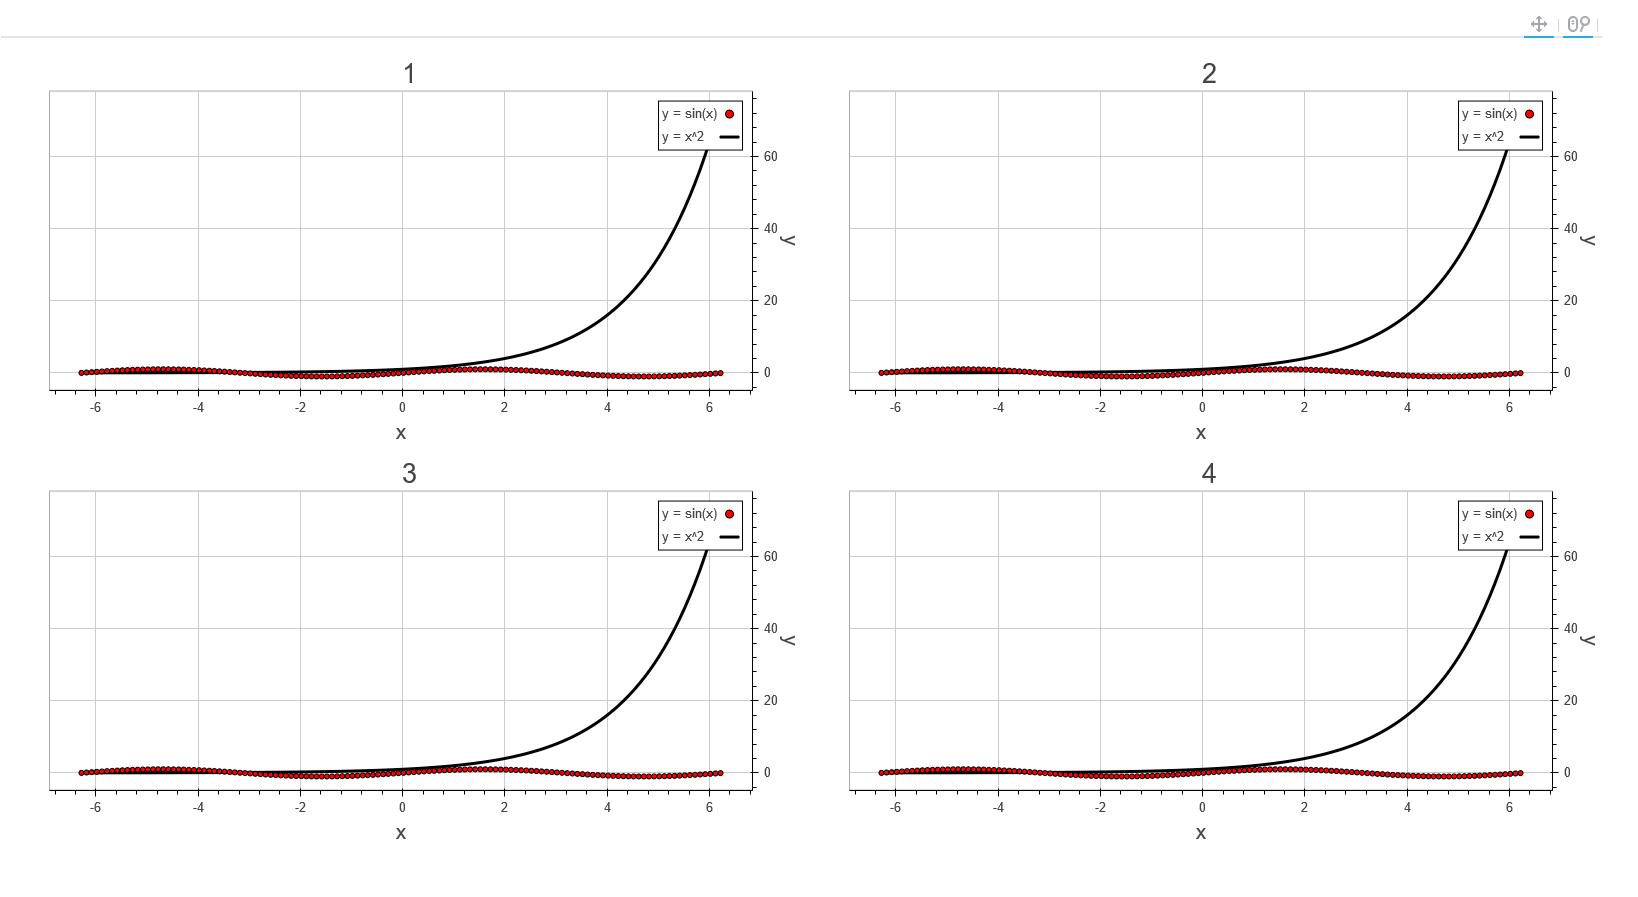
看了一下其Python代码示例,确实简单且优美,但是在看了其scala示例后,感觉写的比较死板,写起来很僵硬,没有python语言那么灵活,可能因为是在python的基础上封装的缘故,就像java的类库重写或封装成C#语言,也明显感觉不是那么舒服,更何况python是个弱类型语言。但是我觉得scala的代码其实也可以写的很优美,最近在码代码的过程中有个感觉就是实现功能很容易,但是要想代码写的漂亮看上去舒服甚至有艺术感就完全不是一件简单的事情。言归正传,我在用一个小时完成简单功能之后,又花了五六个小时进行了简单的重构、二次封装、完善,希望我的封装能用起来舒服一点,但是由于水平有限,也可能我只是画蛇添足,用起来可能还不如原来的,各位看官自行取舍。先发上几幅我做出来的效果图,各位看官可以提前有个感觉。

三、bokeh-scala基本代码
先来介绍如何使用bokeh-scala生成一个简单的图表。首先要引用其jar包,一般scala项目均采用sbt进行包管理,只需要在build.sbt文件中添加以下代码:
libraryDependencies += "io.continuum.bokeh" %% "bokeh" % "0.6"引入之后就可以开始编写代码,首先需要定义一个数据源类,代码如下;
object source extends ColumnDataSource {

    val x = column(-2 * pi to 2 * pi by 0.1)

    val y = column(x.value.map(sin))

}
该类继承自ColumnDataSource类,很明显x、y分别代表x轴数据值范围以及x轴坐标点对应的y轴坐标数据,当然此类也可以包含多个属性,只需要在后续生成图表的时候选择对应的属性即可。本例中x为-2π到2π之间的范围,y为对应的sin值,一个简单的sin函数。
然后就是生成一个Plot对象:
val xdr = new DataRange1d

val ydr = new DataRange1d

val tools = Pan | WheelZoom

val plot = new Plot().x_range(xdr).y_range(ydr).tools(tools).width(width).height(height)
其中xdr、ydr赋值new DataRange1d表示图表的x、y方向为1维连续变化的数据。tools表示在图表上显示的工具:有平移、缩放等,此处bokeh建立了相当于其他语言中枚举的概念。然后使用new Plot()即可创建一个Plot对象,width和height表示宽和高。
有了Plot对象之后就可以生成其坐标轴,有线性、对数、时间等选择,我们以线性为例,生成坐标轴代码如下:
val axis = new LinearAxis.plot(plot).location(Location.Left)

plot.left <<= (axis :: _)
上述语句会生成一个线性的y轴。这里的第二句就是我觉得bokeh-scala代码看起来不舒服的地方,明明第一句已经为plot对象指明了位置Location.Left,却还要在第二句里再次为plot.left赋刚刚生成的值,后面还有好几处这样的例子,可能是我理解不到位。用同样的方法可以再生成x轴,只需要location赋值为Location.Below。
接下来可以使用val grid = new Grid().plot(plot).dimension(0).axis(axis)生成网格,其中axis是上一步生成的坐标轴,dimension控制方向。这里又是一处繁琐的地方,明明刚刚的axis已经是有方位的能区分x、y方向的,此处却还要显式的指明dimension,实在有点不太懂,也许是没能理解开发者的意图。
接下来才进入绘制的主题,根据上面的x、y数据范围绘制图形,这里选择很多,可以绘制圆点、线、文字等多种类型,在这里以原点为例,后面封装的代码中会再给出几种。绘制圆点的代码如下;
val circle = new Circle().x(x).y(y)

val circleGlyph = new GlyphRenderer().data_source(source).glyph(circle)
第一行的x、y就是source中对应的属性,如果没有事先import,需要使用全名称source.x,source就是上面定义的类,此处source是object类型的,所以此处直接传入,相当于单例。circleGlyph就是最终生成的图表中的一系列圆点。
接下来就是最关键的一步,将生成的坐标轴、网格、圆点等对象传递给plot。此处又是繁琐的地方,明明很多对象都是由plot生成的,为什么不能直接绑定给plot呢?不得其解。代码如下:
val renderers: (List[Renderer] => List[Renderer]) = (xaxis :: yaxis :: xgrid :: ygrid :: circleGlyph :: _)

plot.renderers <<= renderers
通过上述步骤就生成了一个完整的包含各种元素的plot,但是并没有显示出来,bokeh的显示在最开始翻译的描述中说的很清楚————要通过浏览器。最简单的方式就是直接渲染一个html文件,然后在浏览器中打开,代码如下:
val document = new Document(plot)

val html = document.save(path)

html.view()
其中path是生成的html文件存放的路径,这样就能直接将plot对象以图表的形式显示到浏览器当中。
四、我的封装
下面我将今天封装的代码贴在下面,供学习交流,又稍作修改,修改后如下:
1、BokehHelper.scala
package geotrellis.bokeh

import io.continuum.bokeh.{Line => BokehLine, _}

import scala.collection.immutable.{IndexedSeq, NumericRange}

/**

  * Created by shoufengwei on 2016/7/30.

  */

object BokehHelper {

  /**

    *

    * @param xdr

    * @param ydr

    * @param tools all Tools

    *              val panTool = new PanTool().plot(plot)

    *              val wheelZoomTool = new WheelZoomTool().plot(plot)

    *              val previewSaveTool = new PreviewSaveTool().plot(plot)

    *              val resetTool = new ResetTool().plot(plot)

    *              val resizeTool = new ResizeTool().plot(plot)

    *              val crosshairTool = new CrosshairTool().plot(plot)

    *              plot.tools := List(panTool, wheelZoomTool, previewSaveTool, resetTool, resizeTool, crosshairTool)

    * @param width

    * @param height

    */

  def getPlot(xdr: DataRange, ydr: DataRange, tools: List[Tool], width: Int = 800, height: Int = 400) = {

    new Plot().x_range(xdr).y_range(ydr).tools(tools).width(width).height(height)

  }

  def getLinearAxis(plot: Plot, position: Location): ContinuousAxis = {

    getAxis(plot, new LinearAxis, position)

  }

  /**

    * get datetime axis

    *

    * @param plot

    * @param position

    * @param formatter eg. new DatetimeTickFormatter().formats(Map(DatetimeUnits.Months -> List("%b %Y")))

    * @return

    */

  def getDatetimeAxis(plot: Plot, position: Location, formatter: DatetimeTickFormatter = new DatetimeTickFormatter().formats(Map(DatetimeUnits.Months -> List("%b %Y")))): ContinuousAxis = {

    getAxis(plot, new DatetimeAxis().formatter(formatter), position)

  }

  def getAxis(plot: Plot, axisType: ContinuousAxis, position: Location): ContinuousAxis = {

    val axis = axisType.plot(plot).location(position)

    setPlotAxis(plot, axis, position)

    setRenderer(plot, axis)

    axis

  }

  def setAxisLabel(axis: ContinuousAxis, axisLabel: String) = {

    axis.axis_label(axisLabel)

  }

  def setPlotAxis(plot: Plot, axis: ContinuousAxis, position: Location) {

    position match {

      case Location.Left => plot.left <<= (axis :: _)

      case Location.Above => plot.above <<= (axis :: _)

      case Location.Below => plot.below <<= (axis :: _)

      case Location.Right => plot.right <<= (axis :: _)

      case _ =>

    }

  }

  def getCircleGlyph(column_x: ColumnDataSource#Column[IndexedSeq, Double], column_y: ColumnDataSource#Column[IndexedSeq, Double], value: DataSource, size: Int = 5, fill_Color: Color = Color.Red, line_Color: Color = Color.Black) = {

    val circle = new Circle().x(column_x).y(column_y).size(size).fill_color(fill_Color).line_color(line_Color)

    getGlyphRenderer(value, circle)

  }

  def setCircleGlyph(plot: Plot, column_x: ColumnDataSource#Column[IndexedSeq, Double], column_y: ColumnDataSource#Column[IndexedSeq, Double], value: DataSource, size: Int = 5, fill_Color: Color = Color.Red, line_Color: Color = Color.Black) = {

    val circleGlyph = getCircleGlyph(column_x, column_y, value, size, fill_Color, line_Color)

    setRenderer(plot, circleGlyph).asInstanceOf[GlyphRenderer]

  }

  def getLineGlyph(column_x: ColumnDataSource#Column[IndexedSeq, Double], column_y: ColumnDataSource#Column[IndexedSeq, Double], value: DataSource, width: Int = 3, line_Color: Color = Color.Black) = {

    val line = new BokehLine().x(column_x).y(column_y).line_width(width).line_color(line_Color)

    getGlyphRenderer(value, line)

  }

  def setLineGlyph(plot: Plot, column_x: ColumnDataSource#Column[IndexedSeq, Double], column_y: ColumnDataSource#Column[IndexedSeq, Double], value: DataSource, width: Int = 3, line_Color: Color = Color.Black) = {

    val lineGlyph = getLineGlyph(column_x, column_y, value, width, line_Color)

    setRenderer(plot, lineGlyph).asInstanceOf[GlyphRenderer]

  }

  def getPatchGlyph(column_x: ColumnDataSource#Column[IndexedSeq, Double], column_y: ColumnDataSource#Column[IndexedSeq, Double], value: DataSource, width: Int = 3, fill_Color: Color = Color.Red, line_Color: Color = Color.Black) = {

    val patch = new Patch().x(column_x).y(column_y).line_width(width).line_color(line_Color).fill_color(fill_Color)

    getGlyphRenderer(value, patch)

  }

  def setPatchGlyph(plot: Plot, column_x: ColumnDataSource#Column[IndexedSeq, Double], column_y: ColumnDataSource#Column[IndexedSeq, Double], value: DataSource, width: Int = 3, fill_Color: Color = Color.Red, line_Color: Color = Color.Black) = {

    val patchGlyph = getPatchGlyph(column_x, column_y, value, width, fill_Color, line_Color)

    setRenderer(plot, patchGlyph).asInstanceOf[GlyphRenderer]

  }

  def getCircleCrossGlyph(column_x: ColumnDataSource#Column[IndexedSeq, Double], column_y: ColumnDataSource#Column[IndexedSeq, Double], value: DataSource, size: Int = 5, fill_Color: Color = Color.Red, line_Color: Color = Color.Black) = {

    val circleCross = new CircleCross().x(column_x).y(column_y).size(size).fill_color(fill_Color).line_color(line_Color)

    getGlyphRenderer(value, circleCross)

  }

  def setCircleCrossGlyph(plot: Plot, column_x: ColumnDataSource#Column[IndexedSeq, Double], column_y: ColumnDataSource#Column[IndexedSeq, Double], value: DataSource, size: Int = 5, fill_Color: Color = Color.Red, line_Color: Color = Color.Black) = {

    val circleCrossGlyph = getCircleCrossGlyph(column_x, column_y, value, size, fill_Color, line_Color)

    setRenderer(plot, circleCrossGlyph).asInstanceOf[GlyphRenderer]

  }

  defgetTextGlyph(column_x: ColumnDataSource#Column[IndexedSeq, Double], column_y: ColumnDataSource#Column[IndexedSeq, Double], value: DataSource, size: Int = 5, fill_Color: Color = Color.Red, line_Color: Color = Color.Black) = {

    val text = new Text().x(column_x).y(column_y).text("1")

    getGlyphRenderer(value, text)

  }

  defsetTextGlyph(plot: Plot, column_x: ColumnDataSource#Column[IndexedSeq, Double], column_y: ColumnDataSource#Column[IndexedSeq, Double], value: DataSource, size: Int = 5, fill_Color: Color = Color.Red, line_Color: Color = Color.Black) = {

    val textGlyph = getTextGlyph(column_x, column_y, value, size, fill_Color, line_Color)

    setRenderer(plot, textGlyph).asInstanceOf[GlyphRenderer]

  }

  defgetGlyphRenderer(value: DataSource, glyph: Glyph) = {

    new GlyphRenderer().data_source(value).glyph(glyph)

  }

  /**    *    * @param legends eg.  val legends = List("y = sin(x)" -> List(lineGlyph, circleGlyph))    */

  defgetLegends(plot: Plot, legends: List[(String, List[GlyphRenderer])]): Legend = {

    val legend = new Legend().plot(plot).legends(legends)

    setRenderer(plot, legend)

    legend

  }

  defgetLegends(plot: Plot, name: String, glyphList: List[GlyphRenderer]): Legend = {

    getLegends(plot, List(name -> glyphList))

  }

  /**    *    * @param plot    * @param axis    * @param dimension 0 means x and 1 means y    * @return    */

  defgetGrid(plot: Plot, axis: ContinuousAxis, dimension: Int) = {

    val grid = new Grid().plot(plot).dimension(dimension).axis(axis)

    setRenderer(plot, grid)

    grid

  }

  defsetRenderers(plot: Plot, renderers: List[Renderer] => List[Renderer]) = {

    plot.renderers <<= renderers

  }

  defsetRenderer(plot: Plot, renderer: Renderer) = {

    val renderers: (List[Renderer] => List[Renderer]) = (renderer :: _)

    setRenderers(plot, renderers)

    renderer

  }

  /**    * use this method just can plot one renderer    *    * @param plot    * @param renderers    */

  defsetRenderers(plot: Plot, renderers: List[Renderer]) = {

    plot.renderers := renderers

  }

  /**    * use gridplot Multiple plots in the document    *    * @param children every child List is one row   eg. val children = List(List(microsoftPlot, bofaPlot), List(caterPillarPlot, mmmPlot))    * @return    */

  defmultiplePlots(children: List[List[Plot]], title: String = ""): Plot = {

    new GridPlot().children(children).title(title)

  }

  defsave2Document(plot: Plot, path: String = "sample.html"): Unit = {

    val document = new Document(plot)

    val html = document.save(path)

    println(s"Wrote ${html.file}. Open ${html.url} in a web browser.")

    html.view()

  }

}
2、test.scala
package geotrellis.bokeh
import io.continuum.bokeh._
import io.continuum.bokeh.Tools._
import scala.collection.immutable.{IndexedSeq, NumericRange}
import math.{Pi => pi, sin}
/**
* Created by shoufengwei on 2016/7/29.
* http://bokeh.pydata.org/en/latest/docs/user_guide/quickstart.html
*/
object BokehTest extends App {
val xdr = new DataRange1d()
val ydr = new DataRange1d()
object source extends ColumnDataSource {
val x: ColumnDataSource#Column[IndexedSeq, Double] = column(-2 * pi to 2 * pi by 0.1)
val y = column(x.value.map(sin))
val z = column(x.value.map(Math.pow(2, _)))
val p = column(x.value.map(Math.pow(3, _)))
// val x = column(-10.0 to 10 by 0.1)
// val y = column(-10.0 to 5 by 0.1)
}
import source.{x, y, z, p}
// val plot = plotOne("全图")
// BokehHelper.save2Document(plot = plot)
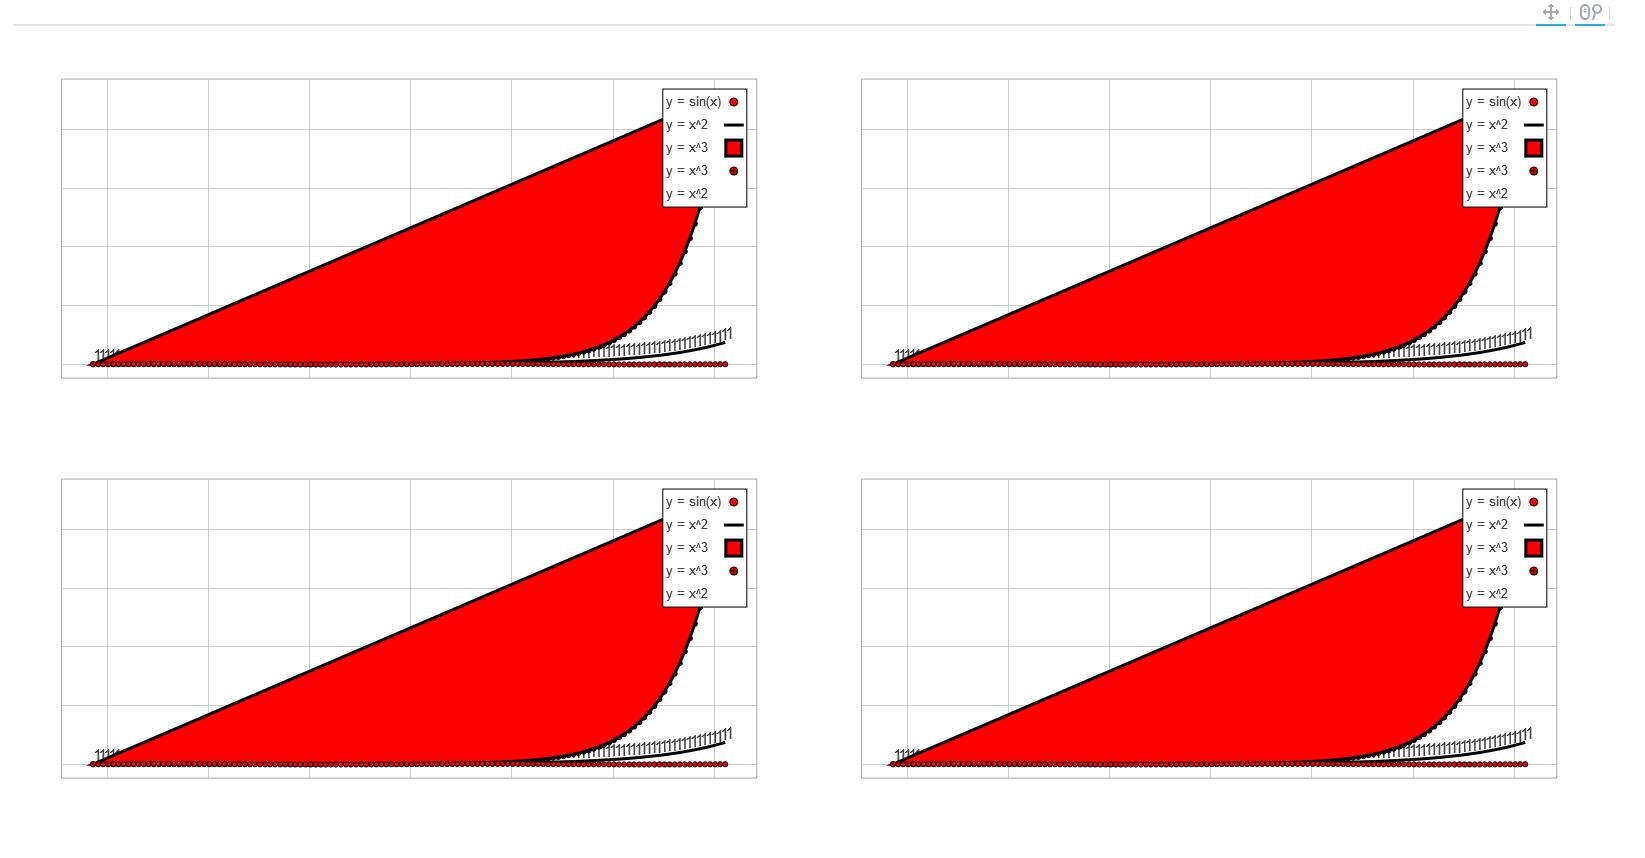
val plot = plotMulitple()
BokehHelper.save2Document(plot)
def plotMulitple() = {
val plot1 = plotOne("1")
val plot2 = plotOne("2")
val plot3 = plotOne("3")
val plot4 = plotOne("4")
BokehHelper.multiplePlots(List(List(plot1, plot2), List(plot3, plot4)), "all chart")
}
def plotOne(title: String = ""): Plot = {
val plot = BokehHelper.getPlot(xdr, ydr, Pan | WheelZoom | Crosshair)
plotBasic(plot)
val legend = plotContent(plot)
plotLegend(plot, legend)
plot.title(title)
}
def plotBasic(plot: Plot) = {
val xaxis = BokehHelper.getLinearAxis(plot, Location.Below)
BokehHelper.setAxisLabel(xaxis, "x")
val yaxis = BokehHelper.getLinearAxis(plot, Location.Right)
BokehHelper.setAxisLabel(yaxis, "y")
val xgrid = BokehHelper.getGrid(plot, xaxis, 0)
val ygrid = BokehHelper.getGrid(plot, yaxis, 1)
}
def plotContent(plot: Plot) = {
val circleGlyph = BokehHelper.setCircleGlyph(plot, x, y, source)
val lineGlyph = BokehHelper.setLineGlyph(plot, x, z, source)
val lineGlyph2 = BokehHelper.setLineGlyph(plot, x, y, source)
val patchGlyph = BokehHelper.setPatchGlyph(plot, x, p, source)
val circleCrossGlyph = BokehHelper.setCircleCrossGlyph(plot, x, p, source)
val textGlyph = BokehHelper.setTextGlyph(plot, x, z, source)
List("y = sin(x)" -> List(circleGlyph, lineGlyph2), "y = x^2" -> List(lineGlyph), "y = x^3" -> List(circleCrossGlyph, patchGlyph))
}
def plotLegend(plot: Plot, legends: List[(String, List[GlyphRenderer])]) = {
BokehHelper.getLegends(plot, legends)
}
}此处我还是沿用了C#的习惯,各种Helper,也不知道scala中是否有更好的替代方案,或者设计模式之类。最近迷上了代码整洁之道,信奉的宗旨也是最好不写注释,当然我的水平还远远不够,所以如果上述代码有什么不明白的欢迎追问,当然如果有什么更好的代码整洁、重构、设计模式等方面的建议也请不吝赐教!以上代码test中的内容看官可以根据自己的需要自行修改!
五、总结
以上就是我总结的有关于bokeh-scala数据可视化的基础,本次并没有完全封装bokeh-scala的全部功能,后续会慢慢完善,更新该篇博客或者另设新篇。欢迎探讨、交流。
bokeh-scala的更多相关文章
- geotrellis使用(十五)使用Bokeh进行栅格数据可视化统计
Geotrellis系列文章链接地址http://www.cnblogs.com/shoufengwei/p/5619419.html 目录 前言 实现方案 总结 一.前言 之前有篇文章 ...
- 学习笔记之Bokeh
Welcome to Bokeh — Bokeh 0.12.16 documentation https://bokeh.pydata.org/en/latest/ Bokeh is an inter ...
- Bokeh绘图
http://bokeh.pydata.org/en/latest Bokeh 是一个专门针对Web浏览器的呈现功能的交互式可视化Python库.这是Bokeh与其它可视化库最核心的区别. 专门针对 ...
- jdb调试scala代码的简单介绍
在linux调试C/C++的代码需要通过gdb,调试java代码呢?那就需要用到jdb工具了.关于jdb的用法在网上大家都可以找到相应的文章,但是对scala进行调试的就比较少了.其实调试的大致流程都 ...
- scala练习题1 基础知识
1, 在scala REPL中输入3. 然后按下tab键,有哪些方法可以被调用? 24个方法可以被调用, 8个基本类型: 基本的操作符, 等: 2,在scala REPL中,计算3的平方根,然 ...
- 牛顿法求平方根 scala
你任说1个整数x,我任猜它的平方根为y,如果不对或精度不够准确,那我令y = (y+x/y)/2.如此循环反复下去,y就会无限逼近x的平方根.scala代码牛顿智商太高了println( sqr(10 ...
- Scala集合和Java集合对应转换关系
作者:Syn良子 出处:http://www.cnblogs.com/cssdongl 转载请注明出处 用Scala编码的时候,经常会遇到scala集合和Java集合互相转换的case,特意mark一 ...
- Scala化规则引擎
1. 引言 什么是规则引擎 一个业务规则包含一组条件和在此条件下执行的操作,它们表示业务规则应用程序的一段业务逻辑.业务规则通常应该由业务分析人员和策略管理者开发和修改,但有些复杂的业务规则也可以由技 ...
- Scala快速概览
IDEA工具安装及scala基本操作 目录 一. 1. 2. 3. 4. 二. 1. 2. 3. 三. 1. 2. 3. 4. 5. 6. 7. 四. 1. (1) (2) (3) (4) (5) ( ...
- Scala Macros - scalamela 1.x,inline-meta annotations
在上期讨论中我们介绍了Scala Macros,它可以说是工具库编程人员不可或缺的编程手段,可以实现编译器在编译源代码时对源代码进行的修改.扩展和替换,如此可以对用户屏蔽工具库复杂的内部细节,使他们可 ...
随机推荐
- git merge 分支
把master merge到apple_campus1.git stash2.git checkout master3.git pull4.git checkout apple_campus5.git ...
- openssl 第一篇
自从老罗赞助了openssl以及心脏出血事件的新闻,得以了解了openssl.那么什么是openssl呢?下面摘自官网: The OpenSSL Project is a collaborative ...
- 实现TCP断点上传,后台C#服务实现接收
实现TCP断点上传,后台C#服务实现接收 终端实现大文件上传一直都是比较难的技术,其中涉及到后端与前端的交互,稳定性和流量大小,而且实现原理每个人都有自己的想法,后端主流用的比较多的是Http来实现, ...
- BZOJ 2301 Problem B(莫比乌斯反演)
http://www.lydsy.com/JudgeOnline/problem.php?id=2301 题意:给a,b,c,d,k,求gcd(x,y)==k的个数(a<=x<=b,c&l ...
- 直接地址跳转C实现
<C缺陷和陷阱>讲过的一种方法: ( *( void (*)() ) 0 )(); //跳转到0地址执行 解析: 1.void (*p_fun)(void); //声明函数指针 2.voi ...
- HTTP -> Asp.net (第一篇)
当用户在浏览器输入一个URL地址后,浏览器会发送一个请求到服务器.这时候在服务器上第一个负责处理请求的是IIS.然后IIS再根据请求的URL扩展名将请求分发给不同的ISAPI处理. 流程如下: 1.I ...
- html5视频小站
本文目的 练习HTML5 学习css3新特性 学习和熟悉移动html基础开发,如触摸知识 网站特点 界面设计仿360影视移动网站 支持主流现代浏览器(注:IE9,chrome,firefox.safa ...
- ObjectOutputStream 追加写入读取错误 - 自己的实现方案
本篇博客灵感来自http://blog.csdn.net/chenssy/article/details/13170015 问题描述.问题出现的原因.尝试解决办法,请参见鄙人上一编博客. 上一编文章解 ...
- 对‘pthread_create’未定义的引用
由于pthread库不是Linux系统默认的库,连接时需要使用库libpthread.a,所以在使用pthread_create创建线程时,在编译中要加-l pthread参数: gcc exampl ...
- 安装Oracle11后在SQL Developer启动时提示:enter the full pathname for the java.exe
1) Open the file ..\sqldeveloper\sqldeveloper\bin\sqldeveloper.conf and add the following line to se ...