React项目中使用HighCharts
大家都知道BizCharts是基于react封装的一套图表工具,而HighCharts是基于jQuery的。但是由于本人对BizCharts甚是不熟,所以在react项目开发中选择了HighCharts,在使用及对接数据的时候也是遇到了各种问题。
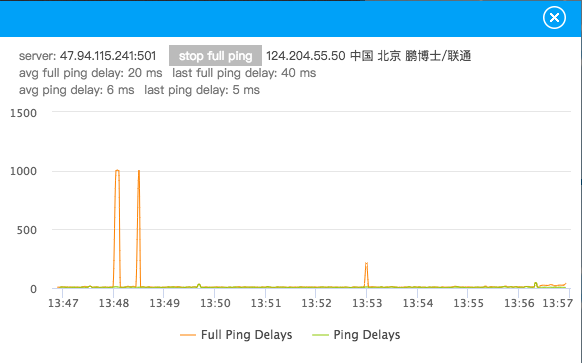
下面简单说下项目需求:首先是两个网络数据源,要求随时间的变化网络折线图不断更新,且当展示一定的数据点后开始折线图从右往左平移。
下面附上该组件所有代码。
import React, { Component } from 'react'

import PropTypes from 'prop-types'

import assign from 'object-assign'

import { autorun } from 'mobx'

import { observer } from 'mobx-react'

import Highcharts from 'highcharts'

import _ from 'lodash'

import ClassNames from 'classnames'

import './index.less'

@observer

class NetworkStatus extends Component {

  static propTypes = {

    style: PropTypes.object,

    onClose: PropTypes.func,

    localPings: PropTypes.array,

    fullPings: PropTypes.array,

  }

  static defaultProps = {

    style: {},

    onClose: _.noop,

    localPings: [],

    fullPings: [],

  }

  state = {

    stopFullPing: false,

    avgFullPingDelay: 0,

    lastFullPingDelay: 0,

    avgLocalPingDelay: 0,

    lastLocalPingDelay: 0,

  }

  componentDidMount() {

    const newChart = Highcharts.chart('chart_wrap', {

      chart: {

        type: 'spline',

        animation: false,

        marginRight: 10,

      },

      // 自定义数据列颜色,默认从第一个数据列起调用第一个颜色代码,依次往后。

      colors: ['#f08500', '#9dc239'],

      // 不显示右下角的版权信息

      credits: {

        enabled: false,

      },

      plotOptions: {

        series: {

          // 去掉鼠标悬浮到曲线上的默认线条加粗效果

          states: {

            hover: {

              enabled: false,

            },

          },

          // 禁用图例点击事件

          events: {

            legendItemClick(e) {

              return false

            },

          },

        },

      },

      // 是否使用国际标准时间

      time: {

        useUTC: false,

      },

      // 不显示头部标题

      title: {

        text: null,

      },

      xAxis: {

        type: 'datetime',

        // tickPixelInterval: 150,

        tickInterval: 60000,

        // labels: {

        //   step: 60,

        // },

      },

      yAxis: {

        title: {

          text: null,

        },

      },

      // 修改图例样式

      legend: {

        enabled: true,

        itemStyle: { color: '#4a4a4a', fontSize: '12px', fontWeight: 'normal' },

        itemHoverStyle: { cursor: 'normal' },

      },

      // 不显示导出按钮

      exporting: {

        enabled: false,

      },

      // 数据列具体数据设置

      series: [{

        // 表示使用哪个y轴

        yAxis: 0,

        name: 'Full Ping Delays',

        lineWidth: 1,

        // 不显示曲线上的实心圆点

        marker: {

          enabled: false,

        },

        data: [],

      }, {

        yAxis: 0,

        name: 'Ping Delays',

        lineWidth: 1,

        // 不显示曲线上的实心圆点

        marker: {

          enabled: false,

        },

        data: [],

      }],

    })

    this.chart = newChart

    this.initChartData(this.props.fullPings, this.props.localPings)

    // store中存储的网络数据每次更新时触发以下代码的执行,即动态往折线图中添加点。

    this.cancelAutoRuns = [

      autorun(() => {

        if (!_.isEmpty(this.props.fullPings)) {

          const fullPingsArrayLength = this.props.fullPings.length

          let totalFullPingDelay = 0

          _.forEach(this.props.fullPings, (pings) => {

            totalFullPingDelay += pings.delay

          })

          this.setState({

            avgFullPingDelay: Math.round(totalFullPingDelay / fullPingsArrayLength),

            lastFullPingDelay: this.props.fullPings[fullPingsArrayLength - 1].delay,

          })

          const x = this.props.fullPings[fullPingsArrayLength - 1].time

          const y = this.props.fullPings[fullPingsArrayLength - 1].delay

          const seriesData = this.chart.series[0].data

          const shift = seriesData.length > 200

          if (x !== seriesData[seriesData.length - 1].x) {

            this.chart.series[0].addPoint([x, y], false, shift, false)

          }

          this.chart.redraw()

        }

      }),

      autorun(() => {

        if (!_.isEmpty(this.props.localPings)) {

          const localPingsArrayLength = this.props.localPings.length

          let totalLocalPingDelay = 0

          _.forEach(this.props.localPings, (pings) => {

            totalLocalPingDelay += pings.delay

          })

          this.setState({

            avgLocalPingDelay: Math.round(totalLocalPingDelay / localPingsArrayLength),

            lastLocalPingDelay: this.props.localPings[localPingsArrayLength - 1].delay,

          })

          const x = this.props.localPings[localPingsArrayLength - 1].time

          const y = this.props.localPings[localPingsArrayLength - 1].delay

          const seriesData = this.chart.series[1].data

          const shift = seriesData.length > 200

          if (x !== seriesData[seriesData.length - 1].x) {

            this.chart.series[1].addPoint([x, y], false, shift, false)

          }

          this.chart.redraw()

        }

      }),

    ]

  }

  componentWillUnmount() {

    this.chart.destroy()

    _.forEach(this.cancelAutoRuns, f => f())

  }

  chart = null

  cancelAutoRuns = null

  // 初始化localPings和fullPings折线图数据

  initChartData = (fullPings, localPings) => {

    if (_.isEmpty(fullPings) || _.isEmpty(localPings)) {

      return

    }

    const fullPingsArrayLength = fullPings.length

    const localPingsArrayLength = localPings.length

    let totalFullPingDelay = 0

    let totalLocalPingDelay = 0

    // 初始化数据时,当store中存储的网络数据少于折线图中定义的展示的点的个数(200)时就直接循环store中所有的数据,当store中数据大于点个数时,取store中后200个数据进行展示

    if (fullPingsArrayLength > 200 && localPingsArrayLength > 200) {

      const newFullPings = fullPings.slice(-200)

      const newLocalPings = localPings.slice(-200)

      this.cyclicPingsData(newFullPings, newLocalPings)

    } else {

      this.cyclicPingsData(fullPings, localPings)

    }

    _.forEach(fullPings, (pings) => {

      totalFullPingDelay += pings.delay

    })

    _.forEach(localPings, (pings) => {

      totalLocalPingDelay += pings.delay

    })

    this.setState({

      avgFullPingDelay: Math.round(totalFullPingDelay / fullPingsArrayLength),

      lastFullPingDelay: fullPings[fullPingsArrayLength - 1].delay,

      avgLocalPingDelay: Math.round(totalLocalPingDelay / localPingsArrayLength),

      lastLocalPingDelay: localPings[localPingsArrayLength - 1].delay,

    })

  }

  cyclicPingsData = (fullPings, localPings) => {

    _.forEach(fullPings, (pings) => {

      const x = pings.time

      const y = pings.delay

      this.chart.series[0].addPoint([x, y], false, false, true)

    })

    _.forEach(localPings, (pings) => {

      const x = pings.time

      const y = pings.delay

      this.chart.series[1].addPoint([x, y], false, false, true)

    })

    this.chart.redraw()

  }

  handleClickCloseBtn = () => {

    this.props.onClose()

  }

  handleClickChangeBtn = () => {

    const { stopFullPing } = this.state

    this.setState({ stopFullPing: !stopFullPing })

    // 点击按钮的同时隐藏或显示 Full Ping Delays 折线

    if (!this.state.stopFullPing) {

      this.chart.series[0].hide()

    } else {

      this.chart.series[0].show()

    }

  }

  render() {

    const wrapStyles = assign({}, this.props.style)

    const hideFullPingTextClasses = ClassNames({

      hide: this.state.stopFullPing === true,

    })

    return (

      <div className="network_status_component_wrap" style={wrapStyles}>

        <div className="header">

          <span

            className="exit_icon"

            onClick={this.handleClickCloseBtn}

            role="button"

            tabIndex="0"

          />

        </div>

        <div className="container_wrap">

          <div className="text_information_wrap">

            <p className="text_one_p">

              <span>server: <span className="black_color">47.94.115.241:501</span></span>

              <span

                className="button_span"

                onClick={this.handleClickChangeBtn}

                role="button"

                tabIndex="0"

              >

                {

                  this.state.stopFullPing ? 'start full ping' : 'stop full ping'

                }

              </span>

              <span className="black_color">124.204.55.50 中国 北京 鹏博士/联通</span>

            </p>

            <p id="text_two_p" className={hideFullPingTextClasses}>

              <span className="margin_right">avg full ping delay: <span>{this.state.avgFullPingDelay}</span> ms</span>

              <span>last full ping delay: <span>{this.state.lastFullPingDelay}</span> ms</span>

            </p>

            <p className="text_three_p">

              <span className="margin_right">avg ping delay: <span>{this.state.avgLocalPingDelay}</span> ms</span>

              <span>last ping delay: <span>{this.state.lastLocalPingDelay}</span> ms</span>

            </p>

          </div>

          <div id="chart_wrap" />

        </div>

      </div>

    )

  }

}

export default NetworkStatus
如下是效果图:
React项目中使用HighCharts的更多相关文章
- 如何在非 React 项目中使用 Redux
本文作者:胡子大哈 原文链接:https://scriptoj.com/topic/178/如何在非-react-项目中使用-redux 转载请注明出处,保留原文链接和作者信息. 目录 1.前言 2. ...
- 如何优雅地在React项目中使用Redux
前言 或许你当前的项目还没有到应用Redux的程度,但提前了解一下也没有坏处,本文不会安利大家使用Redux 概念 首先我们会用到哪些框架和工具呢? React UI框架 Redux 状态管理工具,与 ...
- react项目中实现元素的拖动和缩放实例
在react项目中实现此功能可借助 react-rnd 库,文档地址:https://github.com/bokuweb/react-rnd#Screenshot .下面是实例运用: import ...
- React项目中实现右键自定义菜单
最近在react项目中需要实现一个,右键自定义菜单功能.找了找发现纯react项目里没有什么工具可以实现这样的功能,所以在网上搜了搜相关资料.下面我会附上完整的组件代码. (注:以下代码非本人原创,具 ...
- React项目中使用Mobx状态管理(二)
并上一节使用的是普通的数据状态管理,不过官方推荐使用装饰器模式,而在默认的react项目中是不支持装饰器的,需要手动启用. 官方参考 一.添加配置 官方提供了四种方法, 方法一.使用TypeScrip ...
- 在react项目中使用ECharts
这里我们要在自己搭建的react项目中使用ECharts,我们可以在ECharts官网上看到有一种方式是在 webpack 中使用 ECharts,我们需要的就是这种方法. 我们在使用ECharts之 ...
- 优雅的在React项目中使用Redux
概念 首先我们会用到哪些框架和工具呢? React UI框架 Redux 状态管理工具,与React没有任何关系,其他UI框架也可以使用Redux react-redux React插件,作用:方便在 ...
- 深入浅出TypeScript(5)- 在React项目中使用TypeScript
前言 在第二小节中,我们讨论了利用TypeScript创建Web项目的实现,在本下节,我们讨论一下如何结合React创建一个具备TypeScript类型的应用项目. 准备 Webpack配置在第二小节 ...
- redux在react项目中的应用
今天想跟大家分享一下redux在react项目中的简单使用 1 1.redux使用相关的安装 yarn add redux yarn add react-redux(连接react和redux) 2. ...
随机推荐
- nginx配置https访问
一.准备 环境:centos6.8 nginx:1.13.6 二.开始 首先安装依赖包: yum install -y gcc gcc-c++ autoconf automake make ...
- fiddler 修改
很多新手学习fiddler抓包的同学们都会对https网站抓包难或者抓不起来的问题无所适从,想寻求解决办法,没问题,这节课就来解决你的疑问! 最典型的网站就是目前的百度网站了,百度在近些年采用了htt ...
- [Database.System.Concepts(6th.Edition.2010)].Abraham.Silberschatz. Ch8学习笔记
Database Ch8.relational design 8.1 features of good design 8.1.1 larger alternatives why design is g ...
- 复习C++:VS2008中的宏干嘛用的
VS2008中有宏,可也进行编辑和设置. 好处: 1.快速生成代码,帮助开发. 2.个人定制化功能,IDE更合适自己用. 3.提升编程效率. 缺点: 使用VB开发,一开始用起来费事.不过有官方参考 ...
- SpringBoot-内部运行jvm参数调优
SpringBoot JVM参数调优 这个根据服务器的内存大小,来设置堆参数. -Xms :设置Java堆栈的初始化大小 -Xmx :设置最大的java堆大小 实例参数-XX:+PrintGCDeta ...
- 关于maven-resources-plugin配置的隐藏的坑
昨天发现一个问题, 一个第三方证书的文件存放于resources文件夹下,在本地环境使用该证书进行加密调用第三方接口,没有任何问题,但是发布到测试环境和生产环境(linux)报错,提示证书工厂无法初始 ...
- sx1278 手册参考
记录下芯片的重要数据和内容,方便查阅,无代码实现 参考程序地址:http://www.pudn.com/Download/item/id/3070942.html http://www.cirmal ...
- rosetta deep_analysis
此小程序可以分析backrub,enzdes类的聚类logo分析,详细路径是: /home/wangq/Programs/rosetta_2018.09.60072_bundle/tools/prot ...
- AD域与外部网站域名相同处理办法
环境 域控:Windows Server 2008 r2 AD域:example.cn 问题:DNS可以正常解析外部域名(如www.baidu.com),但是无法解析mail.example.cn 原 ...
- JVM探秘5---JVM监控命令大全
jps命令---查看JVM进程状况 格式为:jps [options] [hostid] 功能描述: jps是用于查看有权访问的hotspot虚拟机的进程. 当未指定hostid时,默认查看本机jvm ...