The dplyr package has been updated with new data manipulation commands for filters, joins and set operations.(转)
dplyr 0.4.0
January 9, 2015 in Uncategorized
I’m very pleased to announce that dplyr 0.4.0 is now available from CRAN. Get the latest version by running:
install.packages("dplyr")dplyr 0.4.0 includes over 80 minor improvements and bug fixes, which are described in detail in the release notes. Here I wanted to draw your attention to two areas that have particularly improved since dplyr 0.3, two-table verbs and data frame support.
Two table verbs
dplyr now has full support for all two-table verbs provided by SQL:
- Mutating joins, which add new variables to one table from matching rows in another:
inner_join(),left_join(),right_join(),full_join(). (Support for non-equi joins is planned for dplyr 0.5.0.) - Filtering joins, which filter observations from one table based on whether or not they match an observation in the other table:
semi_join(),anti_join(). - Set operations, which combine the observations in two data sets as if they were set elements:
intersect(),union(),setdiff().
Together, these verbs should allow you to solve 95% of data manipulation problems that involve multiple tables. If any of the concepts are unfamiliar to you, I highly recommend reading the two-table vignette (and if you still don’t understand, please let me know so I can make it better.)
Data frames
dplyr wraps data frames in a tbl_df class. These objects are structured in exactly the same way as regular data frames, but their behaviour has been tweaked a little to make them easier to work with. The new data_frames vignette describes how dplyr works with data frames in general, and below I highlight some of the features new in 0.4.0.
PRINTING
The biggest difference is printing: print.tbl_df() doesn’t try and print 10,000 rows! Printing got a lot of love in dplyr 0.4 and now:
- All
print()method methods invisibly return their input so you can interleaveprint()statements into a pipeline to see interim results. - If you’ve managed to produce a 0-row data frame, dplyr won’t try to print the data, but will tell you the column names and types:
data_frame(x = numeric(), y = character())

#> Source: local data frame [0 x 2]

#>

#> Variables not shown: x (dbl), y (chr) - dplyr never prints row names since no dplyr method is guaranteed to preserve them:
df <- data.frame(x = c(a = 1, b = 2, c = 3))

df

#>   x

#> a 1

#> b 2

#> c 3

df %>% tbl_df()

#> Source: local data frame [3 x 1]

#>

#>   x

#> 1 1

#> 2 2

#> 3 3
I don’t think using row names is a good idea because it violates one of the principles of tidy data: every variable should be stored in the same way.
To make life a bit easier if you do have row names, you can use the new
add_rownames()to turn your row names into a proper variable:df %>%
add_rownames()
#> rowname x
#> 1 a 1
#> 2 b 2
#> 3 c 3(But you’re better off never creating them in the first place.)
options(dplyr.print_max)is now 20, so dplyr will never print more than 20 rows of data (previously it was 100). The best way to see more rows of data is to useView().
COERCING LISTS TO DATA FRAMES
When you have a list of vectors of equal length that you want to turn into a data frame, dplyr provides as_data_frame() as a simple alternative to as.data.frame().as_data_frame() is considerably faster than as.data.frame() because it does much less:
l <- replicate(26, sample(100), simplify = FALSE)

names(l) <- letters

microbenchmark::microbenchmark(

  as_data_frame(l),

  as.data.frame(l)

)

#> Unit: microseconds

#>              expr      min        lq   median        uq      max neval

#>  as_data_frame(l)  101.856  112.0615  124.855  143.0965  254.193   100

#>  as.data.frame(l) 1402.075 1466.6365 1511.644 1635.1205 3007.299   100
It’s difficult to precisely describe what as.data.frame(x) does, but it’s similar todo.call(cbind, lapply(x, data.frame)) – it coerces each component to a data frame and then cbind()s them all together.
The speed of as.data.frame() is not usually a bottleneck in interactive use, but can be a problem when combining thousands of lists into one tidy data frame (this is common when working with data stored in json or xml).
BINDING ROWS AND COLUMNS
dplyr now provides bind_rows() and bind_cols() for binding data frames together. Compared to rbind() and cbind(), the functions:
- Accept either individual data frames, or a list of data frames:
a <- data_frame(x = 1:5)

b <- data_frame(x = 6:10)

bind_rows(a, b)

#> Source: local data frame [10 x 1]

#>

#>    x

#> 1  1

#> 2  2

#> 3  3

#> 4  4

#> 5  5

#> .. .

bind_rows(list(a, b))

#> Source: local data frame [10 x 1]

#>

#>    x

#> 1  1

#> 2  2

#> 3  3

#> 4  4

#> 5  5

#> .. .
If
xis a list of data frames,bind_rows(x)is equivalent todo.call(rbind, x). - Are much faster:
dfs <- replicate(100, data_frame(x = runif(100)), simplify = FALSE)

microbenchmark::microbenchmark(

  do.call("rbind", dfs),

  bind_rows(dfs)

)

#> Unit: microseconds

#>                   expr      min        lq   median        uq       max

#>  do.call("rbind", dfs) 5344.660 6605.3805 6964.236 7693.8465 43457.061

#>         bind_rows(dfs)  240.342  262.0845  317.582  346.6465  2345.832

#>  neval

#>    100

#>    100
(Generally you should avoid bind_cols() in favour of a join; otherwise check carefully that the rows are in a compatible order).
LIST-VARIABLES
Data frames are usually made up of a list of atomic vectors that all have the same length. However, it’s also possible to have a variable that’s a list, which I call a list-variable. Because of data.frame()s complex coercion rules, the easiest way to create a data frame containing a list-column is with data_frame():
data_frame(x = 1, y = list(1), z = list(list(1:5, "a", "b")))

#> Source: local data frame [1 x 3]

#>

#>   x        y         z

#> 1 1 <dbl[1]> <list[3]>
Note how list-variables are printed: a list-variable could contain a lot of data, so dplyr only shows a brief summary of the contents. List-variables are useful for:
- Working with summary functions that return more than one value:
qs <- mtcars %>%

  group_by(cyl) %>%

  summarise(y = list(quantile(mpg)))

# Unnest input to collpase into rows

qs %>% tidyr::unnest(y)

#> Source: local data frame [15 x 2]

#>

#>    cyl    y

#> 1    4 21.4

#> 2    4 22.8

#> 3    4 26.0

#> 4    4 30.4

#> 5    4 33.9

#> .. ...  ...

# To extract individual elements into columns, wrap the result in rowwise()

# then use summarise()

qs %>%

  rowwise() %>%

  summarise(q25 = y[2], q75 = y[4])

#> Source: local data frame [3 x 2]

#>

#>     q25   q75

#> 1 22.80 30.40

#> 2 18.65 21.00

#> 3 14.40 16.25 - Keeping associated data frames and models together:
by_cyl <- split(mtcars, mtcars$cyl)

models <- lapply(by_cyl, lm, formula = mpg ~ wt)

data_frame(cyl = c(4, 6, 8), data = by_cyl, model = models)

#> Source: local data frame [3 x 3]

#>

#>   cyl            data   model

#> 1   4 <S3:data.frame> <S3:lm>

#> 2   6 <S3:data.frame> <S3:lm>

#> 3   8 <S3:data.frame> <S3:lm>
dplyr’s support for list-variables continues to mature. In 0.4.0, you can join and row bind list-variables and you can create them in summarise and mutate.
My vision of list-variables is still partial and incomplete, but I’m convinced that they will make pipeable APIs for modelling much eaiser. See the draft lowliner package for more explorations in this direction.
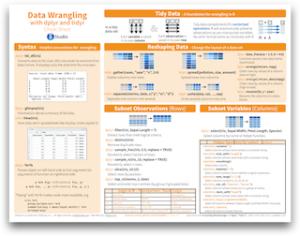
Bonus
My colleague, Garrett, helped me make a cheat sheet that summarizes the data wrangling features of dplyr 0.4.0. You can download it from RStudio’s new gallery of R cheat sheets.
The dplyr package has been updated with new data manipulation commands for filters, joins and set operations.(转)的更多相关文章
- Data Manipulation with dplyr in R
目录 select The filter and arrange verbs arrange filter Filtering and arranging Mutate The count verb ...
- Accessing data in Hadoop using dplyr and SQL
If your primary objective is to query your data in Hadoop to browse, manipulate, and extract it into ...
- HBase:Shell
HBase shell commands As told in HBase introduction, HBase provides Extensible jruby-based (JIRB) she ...
- OCP—051试题
FROM: http://blog.itpub.net/26736162/viewspace-1252569/?page=2 http://blog.csdn.net/elearnings/artic ...
- OCP考试062题库出现大量新题-19
choose three Which three statements are true about Oracle Data Pump? A) Oracle Data Pump export and ...
- 数据处理包plyr和dplyr包的整理
以下内容主要参照 Introducing dplyr 和 dplyr 包自带的简介 (Introduction to dplyr), 复制了原文对应代码, 并夹杂了个人理解和观点 (多附于括号内). ...
- R语言扩展包dplyr笔记
引言 2014年刚到, 就在 Feedly 订阅里看到 RStudio Blog 介绍 dplyr 包已发布 (Introducing dplyr), 此包将原本 plyr 包中的 ddply() 等 ...
- R Tidyverse dplyr包学习笔记2
Tidyverse 学习笔记 1.gapminder 我理解的gapminder应该是一个内置的数据集 加载之后使用 > # Load the gapminder package > li ...
- SSISDB7:查看当前正在运行的Package
在项目组中做ETL开发时,经常会被问到:“现在ETL跑到哪一个Package了?” 为了缩短ETL运行的时间,在ETL的设计上,经常会使用并发执行模式:Task 并发执行,Package并发执行.对于 ...
随机推荐
- Spring Boot 学习笔记--整合Redis
1.新建Spring Boot项目 添加spring-boot-starter-data-redis依赖 <dependency> <groupId>org.springfra ...
- 如何了解您的微软认证情况和MIC ID
- SIP DB33标准笔记 监控图像获取
实时监控图像的获取: a) 实时监控图像的获取过程应包括获取实时流.释放实时流.应使用 RFC 3261 中定义的方法INVITE 获取一个摄像机的实时监控视频流. 取消没有完成的连接应采用 CANC ...
- Latex 公式在线可视化编辑器
寻觅 最近的一个demo需要用到Latex公式在线编辑器,从搜索引擎一般会得到类似http://latex.codecogs.com/eqneditor/editor.php的结果,这个编辑器的问题在 ...
- CF #CROC 2016 - Elimination Round D. Robot Rapping Results Report 二分+拓扑排序
题目链接:http://codeforces.com/contest/655/problem/D 大意是给若干对偏序,问最少需要前多少对关系,可以确定所有的大小关系. 解法是二分答案,利用拓扑排序看是 ...
- Android之AIDL知识总结
1.AIDL介绍 AIDL是一个缩写,全称是Android Interface Definition Language,翻译为Android接口定义语言.主要用于线程之间的通信,本文主要以不同应用之间 ...
- 内存管理之slab分配器
基本思想 与传统的内存管理模式相比, slab 缓存分配器提供了很多优点.首先,内核通常依赖于对小对象的分配,它们会在系统生命周期内进行无数次分配.slab 缓存分配器通过对类似大小的对象进行缓存而提 ...
- 使用react native制作的微博客户端
简要说明: 因为微博授权权限设置,本人的微博开放者账号权限太低,如果出现 'api请求次数受限,请更换. 10023' 弹框 或者 授权界面出错,需要自行更换开放者应用的appkey,授权回调页,Ap ...
- 博弈论(Game Theory) - 01 - 前传之占优战略均衡
博弈论(Game Theory) - 01 - 前传之占优战略均衡 开始 我们现在准备攀爬博弈论的几座高峰. 我们先看看在纳什均衡产生之前,博弈论的发展情况. 我们的第一座高峰是占优战略均衡. 囚徒困 ...
- redis数据库入门
Redis入门(1) 之安装.配置.安全登录 REmote DIctionary Server(Redis) 是一个由Salvatore Sanfilippo写的key-value存储系统. Redi ...