Monitoring tools that everyone's currently using
Although a lot of new tools have arrived since 2011, it's clear that older open source tools like Nagios, and Nagios alternatives like Zabbix and Icinga, still dominate the market, with 70% of the companies we spoke to still using these tools for their core monitoring & alerting.
Around 70% of the companies used more than one monitoring tool, with most using an average of two. Nagios/Graphite configurations were most common, with many also using New Relic. However, only two of the companies we spoke to actually paid for New Relic, with most of the companies using the free version as they found the paid version too expensive.
In the "other" category, there were a lot of different tools with no particular one standing out. Types of tools that fell into this category were SaaS monitoring tools such as Librato & Datadog, used by several smaller start-ups, or many older open source tools like Cacti or Munin. Some AWS users rely on CloudWatch, and there were even a few custom built solutions.

Graph 1: Percentage of companies with monitoring tools deployed.
If we look at tool usage versus the number of servers the companies manage (< 20 being new startup services, and all the way to > 1000 servers for the large online services), you can see that the proportion of older open source tools like Nagios, or paid on-premise tools goes up as the service gets larger, whereas the smaller, newer services are more likely to use developer focused tools like Graphite, LogStash and New Relic.
This makes sense, as many of the larger services are older (> 5 years old) so have legacy monitoring infrastructure, and also have the resources to hire a dedicated operations team who tend to bring in the tools their most familiar with, namely Nagios or Nagios alternatives. They also have more money to pay for monitoring tools like Splunk (which everyone would love to have if they could afford it) or AppDynamics.
The newer smaller services tend not to have any DevOps/Operations people in their company, so developers tend to use simpler-to-install SaaS monitoring tools, or tools that help them such as Graphite or LogStash. There seems to be a tipping point between 50-100 servers when the company has the resources to bring in a DevOps/Operations person or team and they start bringing in the infrastructure monitoring tools like Nagios to provide the coverage they need.
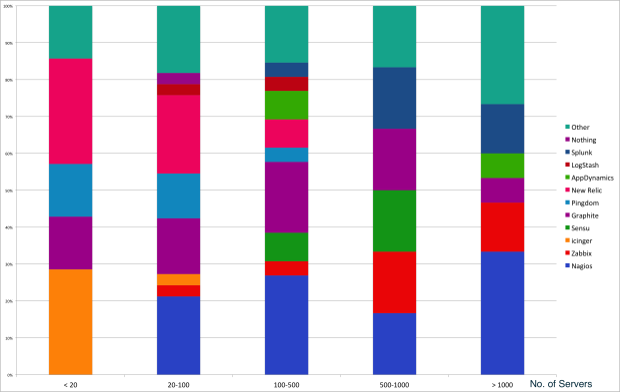
Graph 2: Tool Usage vs. Number of Servers Managed
Key Trends:
1. Many people found the newer services lacked the flexibility of open source solutions with their ability to customize them to their requirements, and didn't like the idea of learning a proprietary system with its own plugin design and features. So they built their own "kit car".
2. While the services became larger, the trend was the move towards microservices, with different cross-functional development teams building, deploying and supporting their own parts of the service.
3. There are some simpler things that can be done to reduce spammy alerts with potential of predictive & more intelligent alerting using machine learning.
[excerpt from Outlyer]
Monitoring tools that everyone's currently using的更多相关文章
- PostgreSQL Performance Monitoring Tools
PostgreSQL Performance Monitoring Tools https://github.com/CloudServer/postgresql-perf-tools This pa ...
- 4. Traffic monitoring tools (流量监控工具 10个)
4. Traffic monitoring tools (流量监控工具 10个)EttercapNtop SolarWinds已经创建并销售了针对系统管理员的数十种专用工具. 安全相关工具包括许多网络 ...
- Top 10 Free Wireless Network hacking/monitoring tools for ethical hackers and businesses
There are lots of free tools available online to get easy access to the WiFi networks intended to he ...
- Top 12 Best Free Network Monitoring Tools (12种免费网络监控工具)
1) Fiddler Fiddler(几乎)是适用于任何平台和任何操作系统的最好的免费网络工具,并提供了一些广受欢迎的关键特性.如:性能测试.捕捉记录HTTP/HTTPs请求响应.进行web调试等很多 ...
- Java Monitoring&Troubleshooting Tools
JDK Tools and Utilities Monitoring Tools You can use the following tools to monitor JVM performance ...
- troubleshooting tools in JDK 7--转载
This chapter describes in detail the troubleshooting tools that are available in JDK 7. In addition, ...
- Java Performance Optimization Tools and Techniques for Turbocharged Apps--reference
Java Performance Optimization by: Pierre-Hugues Charbonneau reference:http://refcardz.dzone.com/refc ...
- Flink监控:Monitoring Apache Flink Applications
This post originally appeared on the Apache Flink blog. It was reproduced here under the Apache Lice ...
- MySQL Performance Tuning: Tips, Scripts and Tools
With MySQL, common configuration mistakes can cause serious performance problems. In fact, if you mi ...
随机推荐
- STL中一些函数的应用
1.nth_element():找到第几大的数.用法:nth_element(a,a+k,a+n),返回一个数组a中第k大的数,时间复杂度比较小,头文件#include <algorithm&g ...
- Loop through an array in JavaScript
https://stackoverflow.com/questions/3010840/loop-through-an-array-in-javascript?page=1&tab=votes ...
- spark学习2-1(hive1.2安装)
由于前面安装版本过老,导致学习过程中出现了很多问题,今天安装了一个新一点的版本.安装结束启动时遇到一点问题,记录在这里. 第一步:hive-1.2安装 通过WinSCP将apache-hive-1.2 ...
- Codeforces Round #283 (Div. 2) E. Distributing Parts 贪心+set二分
E. Distributing Parts time limit per test 2 seconds memory limit per test 256 megabytes input standa ...
- Python之面向对象总结
一.面向对象 1.面向过程 a.优点:极大的降低了写程序的复杂度,只需要顺着执行的步骤,堆叠代码即可 b.缺点:一套流水线或者流程就是来解决一个问题,代码就是牵一发而东莞全身 2.面向对象 a.优点: ...
- js备忘录模式
备忘录(Memento):在不破坏封装的前提下,捕获一个对象的内部状态,并在该对象之外保存这个状态.这样以后就可将该对象恢复到原先保存的状态. 备忘录模式比较适用于功能比较复杂的,但需要维护或记录属性 ...
- ansible安装nginx
ansible安装nginx(实现回滚发布功能:下一篇博客.没想到写长了) 一.准备工作 1.准备两台机器 sai: 192.168.131.132 ——> ansible的服务端 luojy ...
- 配置标准的 ActiveMQ 组件
简单地说,使用 ActiveMQ 的方式是固定且直接的:启动 ActiveMQ 服务器,发送消息,接收消息.但你并未理解 ActiveMQ 背后运作的详情.在一些要求更高的场景里,需要理解并有能力自定 ...
- LINQ(数据查询)
如果只有空的构造函数,想要对字段进行初始化,可以直接在构造函数后面加上{属性名=值,属性名=值};属性与属性之间用,分割开 //查询所有武学级别大于8的武林高手 //var res = new Lis ...
- 算法练习3---水仙花数java版
所谓 "水仙花数 "是指一个三位数,其各位数字立方和等于该数本身. java程序代码如下: public class ArithTest { public static void ...