【调试】ftrace(二)新增跟踪点
内核的各个子系统已经有大量的跟踪点,如果这些跟踪点无法满足工作中的需求,可以自己手动添加跟踪点。
添加跟踪点有两种方式,一种是仿照events/目录下的跟踪点,使用TRACE_EVENT() 宏添加。另一种是参考内核目录samples/trace_events添加。本文对这两种方式分别进行介绍。
使用 TRACE_EVENT 定义 tracepoint
我们仿照events/timer/timer_start,添加一个timer_stat的跟踪点,获取start_pid和slack参数。
首先,需要在include/trace/events/timer.h头文件种添加名为timer_stat的跟踪点。
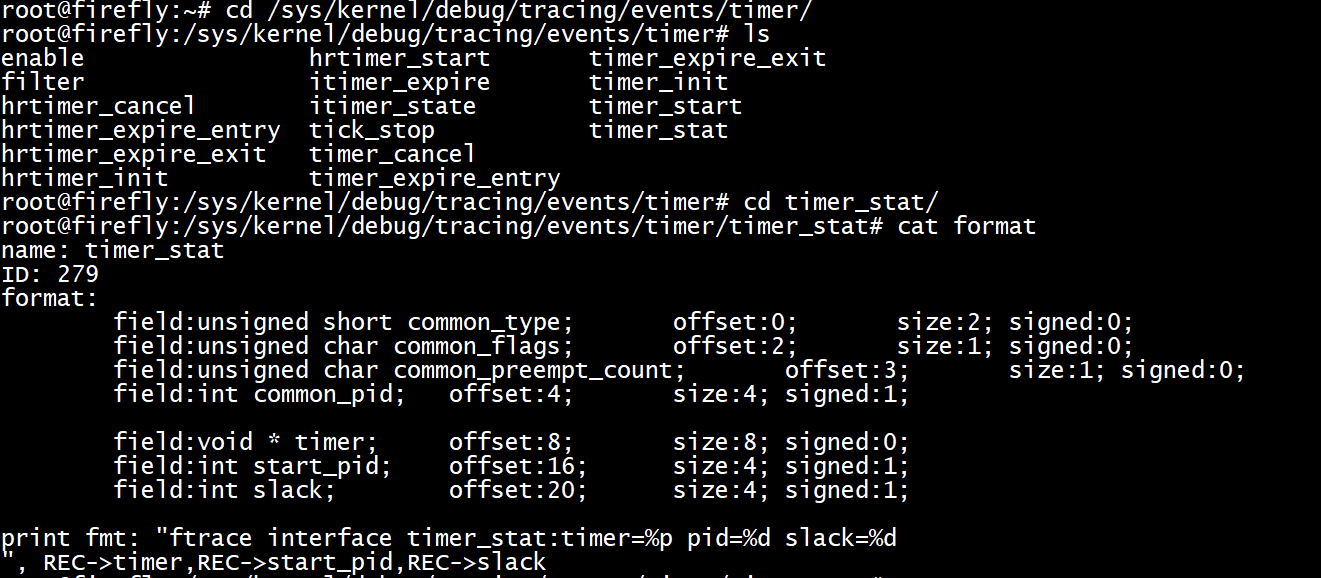
/*** timer_stat - ftrace interface timer_stat* @timer: pointer to struct timer_list*/TRACE_EVENT(timer_stat,TP_PROTO(struct timer_list *timer),TP_ARGS(timer),TP_STRUCT__entry(__field( void *, timer )__field( int, start_pid )__field( int, slack)),TP_fast_assign(__entry->timer = timer;__entry->start_pid = timer->start_pid;__entry->slack = timer->slack;),TP_printk("ftrace interface timer_stat:timer=%p pid=%d slack=%d\n",__entry->timer,__entry->start_pid,__entry->slack));
TRACE_EVENT()宏如下
#define TRACE_EVENT(name, proto, args, struct, assign, print) \DEFINE_TRACE(name)
- name:表示跟踪点的名字,如上面的timer_stat。
- proto:表示跟踪点调用的入参的原型,比如
timer类型为struct timer_list *。 - args:表示参数。
- struct:定义跟踪器内部使用的
__entry数据结构。 - assign:把参数复制到
__entry数据结构中。 - print:定义输出的格式。
接着在kernel/kernel/time/timer.c debug_activate()添加trace_timer_stat()。
static inline voiddebug_activate(struct timer_list *timer, unsigned long expires){debug_timer_activate(timer);trace_timer_start(timer, expires, timer->flags);trace_timer_stat(timer);}
重新编译内核后,烧写到设备中,即可看到sys节点已经有了新增的跟踪点。
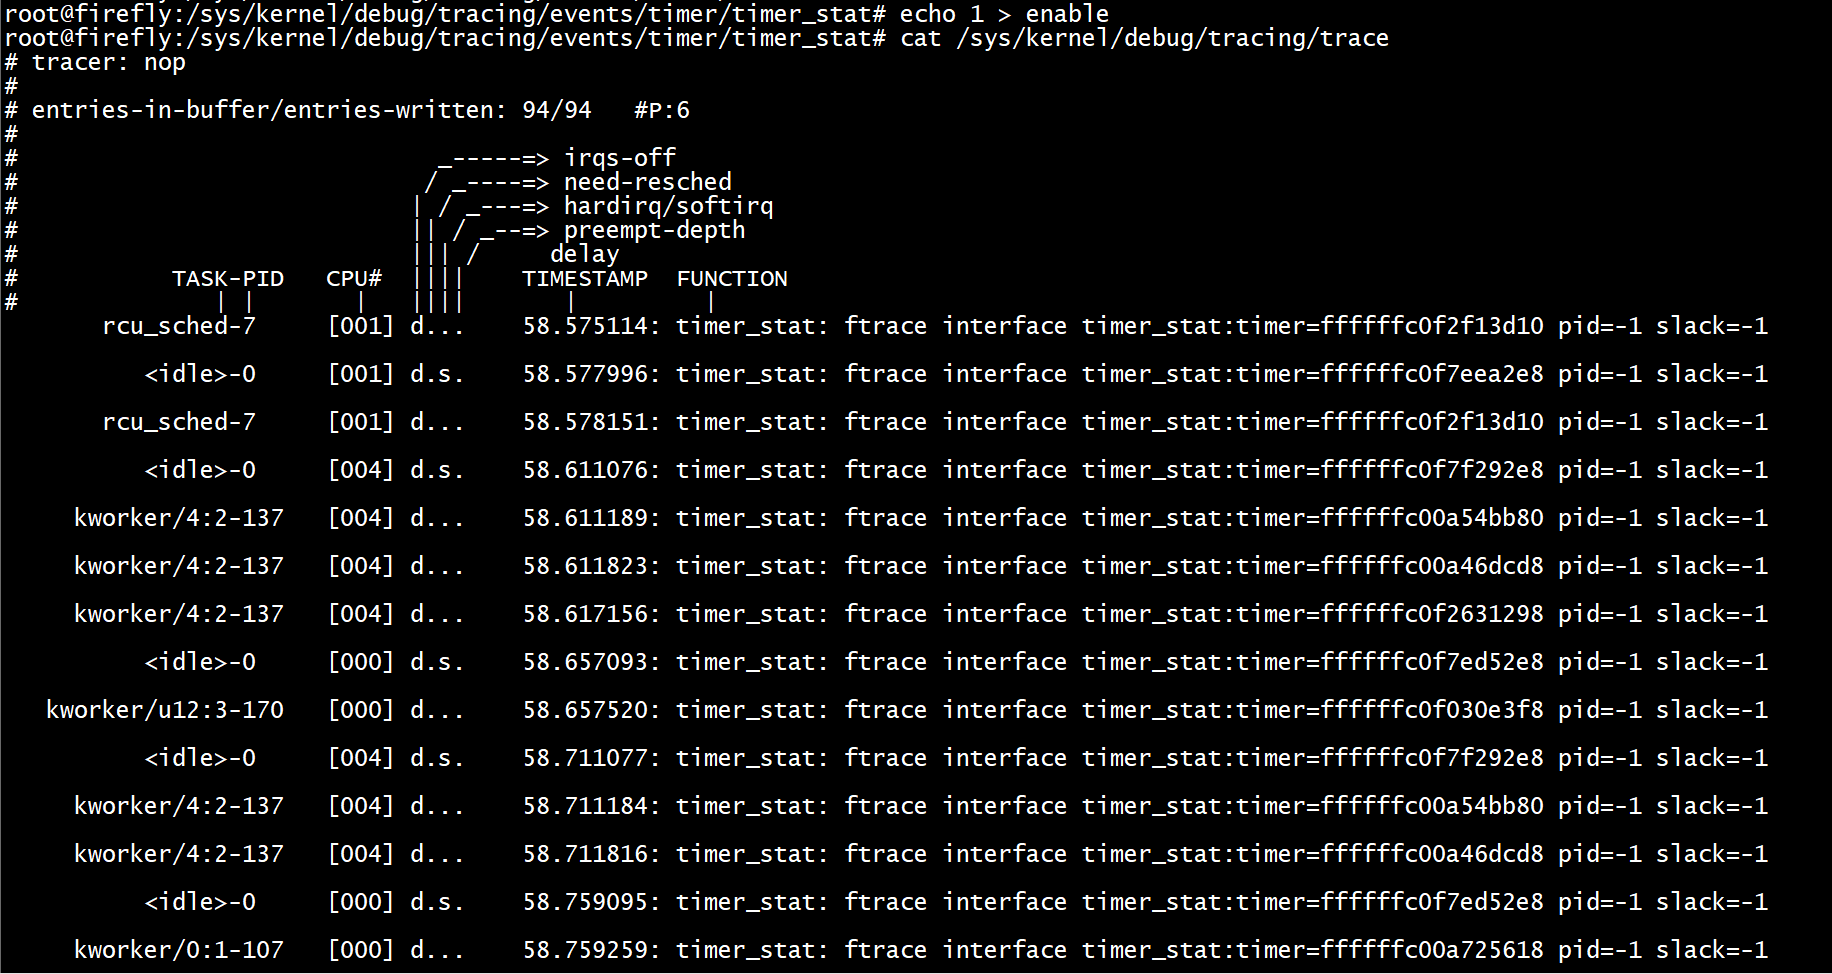
使能跟踪点后,查看trace点的输出。
编译为独立的ko文件
内核还提供了一个跟踪点的例子,在samples/trace_events 目录下。
trace_event_init()创建内核线程一个名为event-sample内核线程。
static int __init trace_event_init(void){simple_tsk = kthread_run(simple_thread, NULL, "event-sample");if (IS_ERR(simple_tsk))return -1;return 0;}
kthread_should_stop()用于创建的线程检查结束标志,并决定是否退出。
static int simple_thread(void *arg){int cnt = 0;while (!kthread_should_stop())simple_thread_func(cnt++);return 0;}
set_current_state() 来设置进程的状态,设置为TASK_INTERRUPTIBLE表示是可以被信号和wake_up()唤醒的,当信号到来时,进程会被设置为可运行。
schedule_timeout()将当前task调度出cpu,重新调度间隔为HZ。接着trace_开头的函数就会依次打印跟踪点的信息。
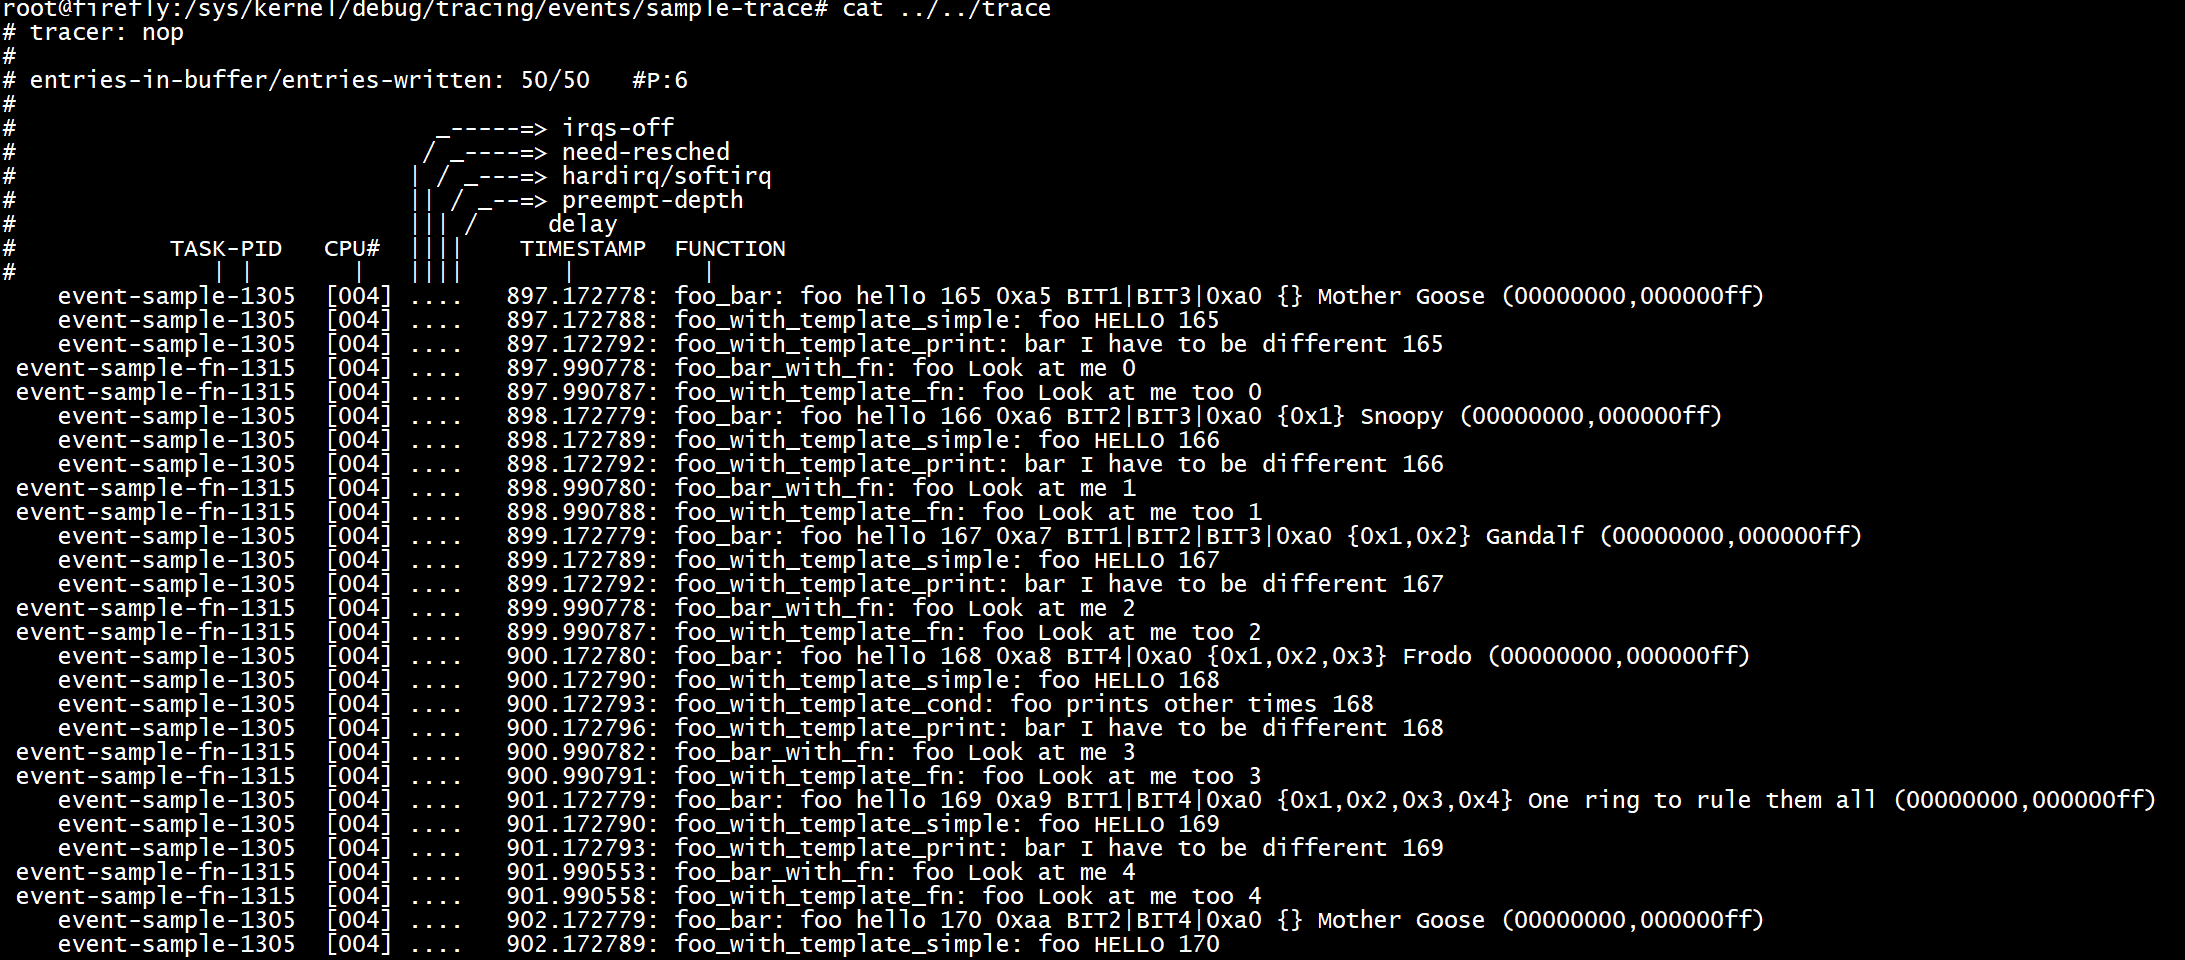
static void simple_thread_func(int cnt){int array[6];int len = cnt % 5;int i;set_current_state(TASK_INTERRUPTIBLE);schedule_timeout(HZ);for (i = 0; i < len; i++)array[i] = i + 1;array[i] = 0;/* Silly tracepoints */trace_foo_bar("hello", cnt, array, random_strings[len],tsk_cpus_allowed(current));trace_foo_with_template_simple("HELLO", cnt);trace_foo_bar_with_cond("Some times print", cnt);trace_foo_with_template_cond("prints other times", cnt);trace_foo_with_template_print("I have to be different", cnt);}
trace_foo_with_template_simple跟踪点的实现方式也是使用的TRACE_EVENT ()宏,这里不再赘述。
最后将文件编译为ko拷贝到设备上insmod后,即可看到sys目录下已经有新增的节点。
cd /home/zhongyi/code/rk3399_linux_release_v2.5.1_20210301/kernel/samples/trace_eventsmake -C /home/zhongyi/code/rk3399_linux_release_v2.5.1_20210301/kernel/ M=$(pwd) modules
root@firefly:/sys/kernel/debug/tracing# cat available_events | grep samplesample-trace:foo_barsample-trace:foo_bar_with_condrace:foo_bar_with_fnsample-trace:foo_with_template_simplesample-trace:foo_with_template_condsample-trace:foo_with_template_fnsample-trace:foo_with_template_printpower:pstate_sample
root@firefly:/sys/kernel/debug/tracing# cd events/sample-trace/root@firefly:/sys/kernel/debug/tracing/events/sample-trace# lsenable foo_bar_with_cond foo_with_template_fnfilter foo_bar_with_fn foo_with_template_printfoo_bar foo_with_template_cond foo_with_templ_simpleroot@firefly:/sys/kernel/debug/tracing/events/sample-trace# echo 1 > enableroot@firefly:/sys/kernel/debug/tracing/events/sample-trace# cat /sys/kernel/debug/tracing/trace
TRACE_EVENT_CONDITION()
在某些情况下,跟踪点只有在某个条件发生时才会被调用,类似于
if (cond)trace_foo();
TRACE_EVENT_CONDITION()宏就是这个作用,它和TRACE_EVENT()相比只是在参数中多加了一个cond条件。TP_CONDITION()会对条件做个判断。
TRACE_EVENT(name, proto, args, struct, assign, printk)TRACE_EVENT_CONDITION(name, proto, args, cond, struct, assign, printk)
详细使用方法可以参考trace-events-sample.h。
TRACE_EVENT_FN()
TRACE_EVENT_FN()是在跟踪点使能前和使能后分别打印一些信息。相比于TRACE_EVENT(),TRACE_EVENT_FN()多了两个参数reg和unreg,
TRACE_EVENT(name, proto, args, struct, assign, printk)TRACE_EVENT_FN( name, proto, args, struct, assign, printk, reg, unreg)
reg 和unreg原型为
void reg(void)
reg函数在跟踪点使能前打印,unreg函数在跟踪点使能后打印。reg 和unreg可以根据实际情况置其中一个为NULL,也可以全部置为NULL。
详细使用方法可以参考trace-events-sample.h。
本文参考
samples/trace_events
【调试】ftrace(二)新增跟踪点的更多相关文章
- OpenGL ES 2.0 Shader 调试新思路(二): 做一个可用的原型
OpenGL ES 2.0 Shader 调试新思路(二): 做一个可用的原型 目录 背景介绍 请参考前文OpenGL ES 2.0 Shader 调试新思路(一): 改变提问方式 优化 ledCha ...
- win10 下visual studio 2015 在调试模式下不能跟踪源文件
win10 下visual studio 2015 在调试模式下不能跟踪源文件,只要一调试就会关闭(隐藏)打开的文档,非常不方便.经过一番折腾,发现是配置的问题. 如果安装多个版本的VS,请删除对应版 ...
- Visual Studio调试之避免单步跟踪调试模式
Visual Studio调试之避免单步跟踪调试模式 写完Visual Studio调试之断点进阶篇之后,想分享一下我常用的一些调试技巧,后面发现写之前,一些背景知识需要介绍一下. 下面是几篇今年2月 ...
- Delphi应用程序的调试(二)使用断点
Delphi应用程序的调试(二)使用断点 使用断点(Using Breakpoints) 当用户从Delphi IDE 运行程序时,程序全速运行,只会在设置了断点的地方停住. New Term 断点( ...
- 2018-2-13-visual-Studio-无法调试,提示程序跟踪已退出
title author date CreateTime categories visual Studio 无法调试,提示程序跟踪已退出 lindexi 2018-2-13 17:23:3 +0800 ...
- postgresql编译安装与调试(二)
接前文postgresql编译安装与调试(一),继续说说postgresql的编译安装与调试. 上一篇已经详细说明了如何在Linux系统上编译安装postgresql,这次我们在此基础上简单讲讲如何在 ...
- 使用 PHPStorm + Xdebug 实现断点调试(二)
一.配置 Xdebug 配置 Xdebug 相关参数,在 php.ini 文件中新增如下配置,如果没安装的,请参考<PHP 安装 Xdebug扩展>: [xdebug] xdebug.re ...
- numpy C语言源代码调试(二)
前一篇已经介绍,可以使用gdb进行调试,但是本人不太习惯gdb的文本界面,所以希望找一个比较好用的gdb的前端gui调试器. 想到的第一个是一个非常老的调试工具,DDD. DDD - Data Dis ...
- 如何调试SSIS包之跟踪变量赋值
在SSIS开发工具SQL Server Data Tools中提供了调试功能,可以让我们方便的跟踪参数赋值或者数据流条数.本文主要介绍了如何使用SSDT的调试功能. Part A: Script ta ...
- ASP.NET WEB API 中的路由调试与执行过程跟踪
路由调试 RouteDebugger 是调试 ASP.NET MVC 路由的一个好的工具,在ASP.NET WEB API中相应的有 WebApiRouteDebugger ,Nuget安装 Inst ...
随机推荐
- vertx的学习总结6之动态代理类和测试
Beyond the event bus 一.章节覆盖: 如何在事件总线之上公开服务 verticles和事件总线服务的异步测试 动态代理: MyService 接口 package porxy.te ...
- Redis入门实践
安装Redis 下载:官网:https://redis.io/download/,选择稳定版下载. 上传至linux 解压Redis:tar -zxvf redis-6.2.7.tar.gz,得到: ...
- 年度盘点,四年的精华合集「GitHub 热点速览」
今年是 GPT 年,无论是 GitHub 还是朋友圈还是技术平台,即便你不关心 GPT 的发展情况,同大模型.AI 相关的项目总能进入你的信息流.到这期为止,热度速览也连载了四年,从一开始习惯看 Gi ...
- reboot详解
linux下reboot命令详解 linux reboot 命令详解 功能说明:重新开机. 语 法:dreboot [-dfinw] 补充说明:执行reboot指令可让系统停止运作,并重新开机. 参 ...
- electron入门之配置镜像加速(四)
electron入门到入土,配置阿里镜像加速.为了防止后面我们打包龟速,需要给electron配置阿里镜像加速 在下面的文件内添加阿里镜像加速,你的文件位置不一定是这个 C:\Program File ...
- vscode 启动go
{ "version": "0.2.0", "configurations": [ { "name": "La ...
- 为什么程序猿DD热衷于内容输出与分享?
一.热衷于内容输出与分享 我是程序猿DD,大家知道我热衷于内容输出与分享.比如我一直有在产出博客或维护开源项目,是因为平时不沉迷游戏或追剧,空下来就喜欢整理整理最近碰到的问题,那么写写博客正好是一种比 ...
- 华为云API Explorer:自动化运维的得力助手
华为云API Explorer为开发者提供一站式API解决方案统一平台,集成华为云服务所有开放API,支持全量快速检索.可视化调试.帮助文档.代码示例等能力,帮助开发者快速学习API,使用API开发代 ...
- 华为云MetaStudio全新升级,盘古数字人大模型助力数字人自由
摘要:基于盘古大模型能力,华为云MetaStudio数字内容生产线全新升级,推出数字人模型生成服务和模型驱动服务. 近日,华为开发者大会2023 ( Cloud ) 在东莞拉开帷幕.基于盘古大模型能力 ...
- 这项评测,华为云GaussDB(for MySQL)顺利通过
摘要:近日,中国信息通信研究院(简称"中国信通院")公布了第十五批"可信数据库"评测结果.华为云GaussDB(for MySQL)凭借过硬的技术实力顺利通过& ...