Python第三方库之openpyxl(4)
Python第三方库之openpyxl(4)
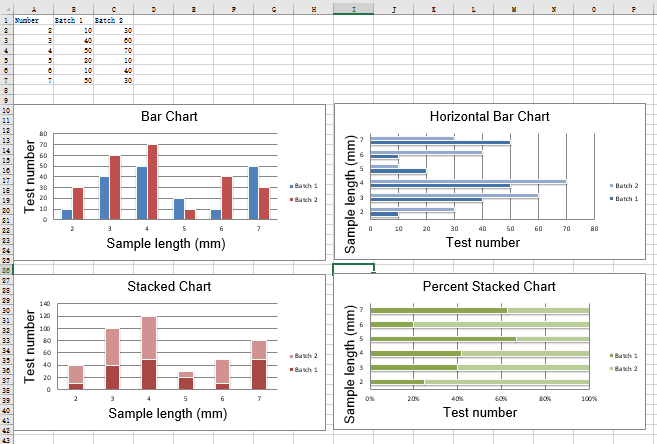
2D柱状图
在柱状图中,值被绘制成水平条或竖列。
垂直、水平和堆叠柱状图。
注意:以下设置影响不同的图表类型
1.在垂直和水平条形图之间切换,分别设置为col或bar
2.当使用堆叠图表时,overlap需要设置为100
3.如果条是水平的,x轴和y轴要反转
from openpyxl import Workbook

from openpyxl.chart import BarChart, Series, Reference

wb = Workbook(write_only=True)

ws = wb.create_sheet()

rows = [

    ('Number', 'Batch 1', 'Batch 2'),

    (2, 10, 30),

    (3, 40, 60),

    (4, 50, 70),

    (5, 20, 10),

    (6, 10, 40),

    (7, 50, 30),

]

for row in rows:

    ws.append(row)

chart1 = BarChart()

chart1.type = "col"

chart1.style = 10

chart1.title = "Bar Chart"

chart1.y_axis.title = 'Test number'

chart1.x_axis.title = 'Sample length (mm)'

data = Reference(ws, min_col=2, min_row=1, max_row=7, max_col=3)

cats = Reference(ws, min_col=1, min_row=2, max_row=7)

chart1.add_data(data, titles_from_data=True)

chart1.set_categories(cats)

chart1.shape = 4

ws.add_chart(chart1, "A10")

from copy import deepcopy

chart2 = deepcopy(chart1)

chart2.style = 11

chart2.type = "bar"

chart2.title = "Horizontal Bar Chart"

ws.add_chart(chart2, "G10")

chart3 = deepcopy(chart1)

chart3.type = "col"

chart3.style = 12

chart3.grouping = "stacked"

chart3.overlap = 100

chart3.title = 'Stacked Chart'

ws.add_chart(chart3, "A27")

chart4 = deepcopy(chart1)

chart4.type = "bar"

chart4.style = 13

chart4.grouping = "percentStacked"

chart4.overlap = 100

chart4.title = 'Percent Stacked Chart'

ws.add_chart(chart4, "G27")

wb.save("bar.xlsx")
运行结果
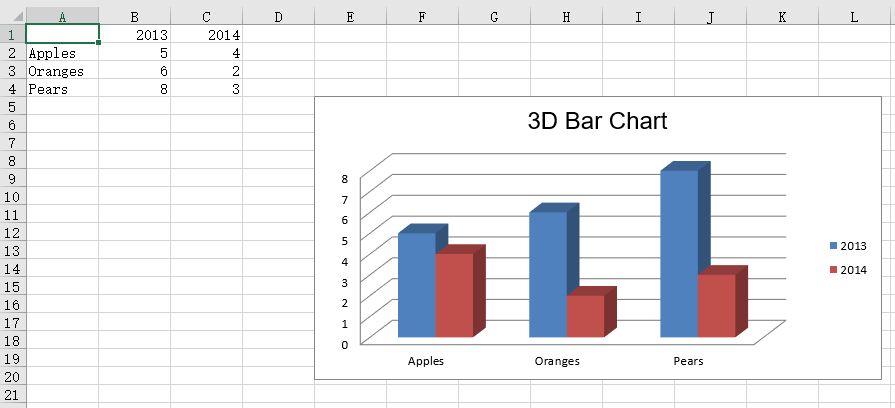
3D柱状图
from openpyxl import Workbook

from openpyxl.chart import (

    Reference,

    Series,

    BarChart3D,

)

wb = Workbook()

ws = wb.active

rows = [

    (None, 2013, 2014),

    ("Apples", 5, 4),

    ("Oranges", 6, 2),

    ("Pears", 8, 3)

]

for row in rows:

    ws.append(row)

data = Reference(ws, min_col=2, min_row=1, max_col=3, max_row=4)

titles = Reference(ws, min_col=1, min_row=2, max_row=4)

chart = BarChart3D()

chart.title = "3D Bar Chart"

chart.add_data(data=data, titles_from_data=True)

chart.set_categories(titles)

ws.add_chart(chart, "E5")

wb.save("bar3d.xlsx")
运行结果
Python第三方库之openpyxl(4)的更多相关文章
- Python第三方库之openpyxl(3)
Python第三方库之openpyxl(3) 区域图 区域图类似于折线图,绘图线下面的区域会被填充,通过将分组设置为“standard”.“stacked”或“percentStacked”,可以获得 ...
- Python第三方库之openpyxl(12)
Python第三方库之openpyxl(12) 地面天气图 在工作表上的列或行中安排的数据可以在一个表中绘制.当您想要在两组数据之间找到最佳组合时,一个表面图表是有用的.正如在地形图中一样,颜色和图案 ...
- Python第三方库之openpyxl(11)
Python第三方库之openpyxl(11) Stock Charts(股票图) 在工作表上按特定顺序排列的列或行中的数据可以在股票图表中绘制.正如其名称所暗示的,股票图表通常被用来说明股价的波动. ...
- Python第三方库之openpyxl(10)
Python第三方库之openpyxl(10) 雷达图 在工作表上的列或行中排列的数据可以在雷达图中绘制.雷达图比较多个数据系列的总值.它实际上是一个圆形x轴上的面积图的投影.有两种类型的雷达图:st ...
- Python第三方库之openpyxl(9)
Python第三方库之openpyxl(9) 油炸圈饼图 甜甜圈图表与饼图相似,只是他们用的是环而不是圆.他们还可以将几个系列的数据绘制成同心环 from openpyxl import Workbo ...
- Python第三方库之openpyxl(8)
Python第三方库之openpyxl(8) 饼图 饼图将数据绘制成一个圆片,每个片代表整体的百分比.切片是按顺时针方向绘制的,0在圆的顶部.饼图只能取一组数据.该图表的标题将默认为该系列的标题. 2 ...
- Python第三方库之openpyxl(7)
Python第三方库之openpyxl(7) 散点图 散点或xy图表类似于一些折线图.主要的区别在于,一个系列的值被绘制在另一个值上.当值未排序时,这是有用的. from openpyxl impor ...
- Python第三方库之openpyxl(6)
Python第三方库之openpyxl(6) 折线图 折线图允许在固定轴上绘制数据,它们类似于散列图,主要的区别在于,在折线图中,每个数据序列都是根据相同的值绘制的,不同的轴可以用于辅助轴,与条形图类 ...
- Python第三方库之openpyxl(5)
Python第三方库之openpyxl(5) 气泡图 气泡图类似于散点图,但使用第三个维度来确定气泡的大小,图表可以包括多个项目 from openpyxl import Workbook from ...
随机推荐
- chrome浏览器好用的一些插件
1. Listen 1(听音乐) 2. The Great Suspender(定时释放chrome 打开的页面内存) 3. Similar Web(页面流量分析) 4. Advertising Te ...
- Kettle Rest大文件上传(RestUploadFile.ktr) Rest文件下载(FileDownload.ktr)
1. Rest大文件上传(RestUploadFile.ktr) 需求描述 上传文件大于10M小于500M 上传文件进行分片(5M一片要比1M分片整体时间快) 先使用java类进行功能模拟在迁移Ktr ...
- CF1079D Barcelonian Distance
思路: 模拟. 实现: #include <bits/stdc++.h> using namespace std; ; double dis(double x1, double y1, d ...
- leetcode542 01 Matrix
思路: 多个起点的bfs. 实现: class Solution { public: vector<vector<int>> updateMatrix(vector<ve ...
- git 设置了ssh key 还是需要输入账户和密码
参考这篇文章https://blog.csdn.net/shahuhu000/article/details/86625987 git remote remove origingit remote a ...
- Android WiFi使用记录
最近在做Android的WiFi部分的开发,连接的工具类参照了这个文章的工具类. http://www.cnblogs.com/zhuqiang/p/3566686.html 开发中碰上的一些问题,在 ...
- MVC视图特性
在主界面的视图中可以使用viewdata,引用主界面的分布视图界面也可以调用主界面的分部视图,但是分部视图不可以定义viewdata并使用 例子如下: // // GET: /Home/ public ...
- java.lang.NoClassDefFoundError: org/w3c/dom/ElementTraversal问题解决
使用Maven构建项目并加载spring配置文件时,报如下异常 Caused by: java.lang.ClassNotFoundException: org.w3c.dom.ElementTrav ...
- Data truncation: Data too long for column 'id' at row 1
Caused by: java.sql.BatchUpdateException: Data truncation: Data too long for column 'titleimg' at ro ...
- django 2.0 + pycharm2017 出现的问题
在创建完成app之后,在models文件里创建两个类:BlogType , Blog, 创建超级用户,注册admin,在登陆admin之后发现,发现 BlogType , Blog,并没有导入到adm ...