R语言实战(三) 图形初阶
3.1 使用图形
- plot:基础绘图
- abline:添加回归直线
- hist:绘制直方图
- boxplot:绘制箱线图
- dev.new():returns the return value of the device opened, usually invisible NULL.
- dev.cur(): returns a length-one named integer vector giving the number and name of the active device, or 1, the null device, if none is active.
- dev.list(): returns the numbers of all open devices, except device 1, the null device. This is a numeric vector with a names attribute giving the device names, or NULL is there is no open device.
- dev.next(which = dev.cur()):return the number and name of the next device in the list of devices. This will be the null device if and only if there are no open devices.
- dev.prev(which = dev.cur()): return the number and name of the previous device in the list of devices. This will be the null device if and only if there are no open devices.
- dev.off(which = dev.cur()): returns the number and name of the new active device (after the specified device has been shut down).
- dev.set(which = dev.next()): returns the number and name of the new active device.
- graphics.off()
Only one device is the ‘active’ device: this is the device in which all graphics operations occur. There is a "null device" which is always open but is really a placeholder: any attempt to use it will open a new device specified by getOption("device").
Devices are associated with a name (e.g., "X11" or "postscript") and a number in the range 1 to 63; the "null device" is always device 1. Once a device has been opened the null device is not considered as a possible active device. There is a list of open devices, and this is considered as a circular list not including the null device. dev.next and dev.prev select the next open device in the appropriate direction, unless no device is open.

3.2 一个简单的例子
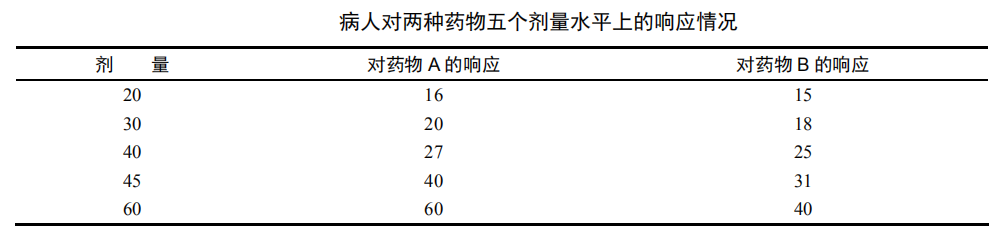
dose <- c(20, 30, 40, 45, 60)

drugA <- c(16, 20, 27, 40, 60)

drugB <- c(15, 18, 25, 31, 40)

plot(dose, drugA, type="b")

3.3 图形参数
- plot(x, y, ...): Generic function for plotting of R objects. For more details about the graphical parameter arguments, see par.
For simple scatter plots, plot.default will be used. However, there are plot methods for many R objects, including functions, data.frames, density objects, etc. Use methods(plot) and the documentation for these.
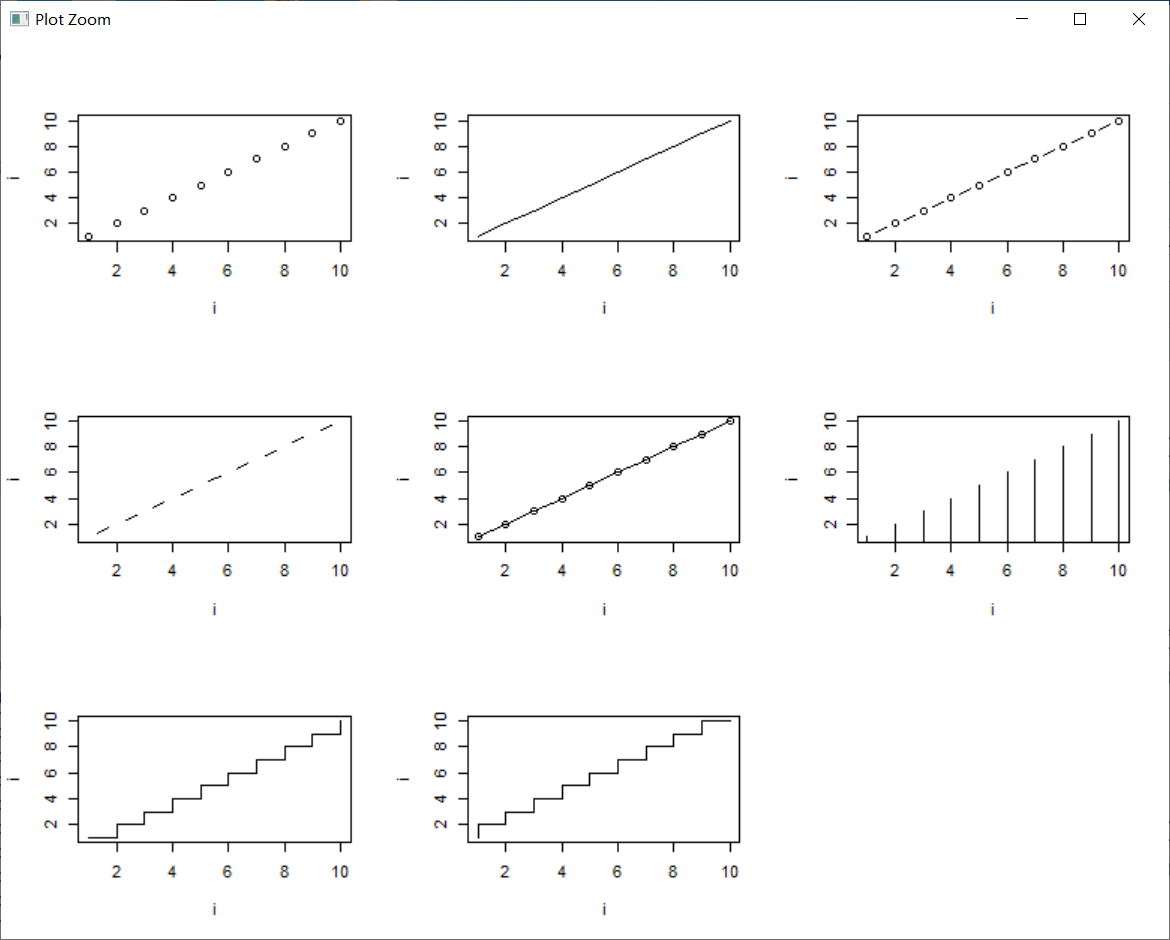
type: what type of plot should be drawn. Possible types are.
- "p" for points,
- "l" for lines,
- "b" for both,
- "c" for the lines part alone of "b",
- "o" for both ‘overplotted’,
- "h" for ‘histogram’ like (or ‘high-density’) vertical lines,
- "s" for stair steps,
- "S" for other steps, see ‘Details’ below,
- "n" for no plotting.
The two step types differ in their x-y preference: Going from (x1,y1) to (x2,y2) with x1 < x2, type = "s" moves first horizontal, then vertical, whereas type = "S" moves the other way around.
9种图形如下:
main: an overall title for the plot: see title.
sub: a sub title for the plot: see title.
xlab: a title for the x axis: see title.
ylab: a title for the y axis: see title.
asp: the y/x aspect ratio, see plot.window.(x和y的长宽比)
- par(..., no.readonly = FALSE)
par can be used to set or query(查询) graphical parameters. Parameters can be set by specifying them as arguments to par in tag = value form, or by passing them as a list of tagged values.(通过tag=value传递或者通过标记列表传递)
no.readonly: logical; if TRUE and there are no other arguments, only parameters are returned which can be set by a subsequent par() call on the same device.
| adj |
The value of adj determines the way in which text strings are justified in text, mtext and title. A value of 0 produces left-justified text, 0.5 (the default) centered text and 1 right-justified text. (Any value in [0, 1] is allowed.) Note that the adj argument of text also allows adj = c(x, y) for different adjustment in x- and y- directions. 确定文本和标题的对齐方式,0~1之间。 |
| ann | If set to FALSE, high-level plotting functions calling plot.default do not annotate the plots they produce with axis titles and overall titles. The default is to do annotation. |
| ask |
logical. If TRUE (and the R session is interactive) the user is asked for input, before a new figure is drawn. 在绘图前对用户进行提醒。 |
| bg |
The color to be used for the background of the device region. When called from par() it also sets new = FALSE. 可以通过颜色下标、颜色名称、十六进制的颜色值、RGB值或HSV值来指定颜色。举例来说,col=1、col="white"、col="#FFFFFF"、col=rgb(1,1,1)和col=hsv(0,0,1)都是表示白色的等价方式。 |
| bty |
A character string which determined the type of box which is drawn about plots. If bty is one of "o" (the default), "l", "7", "c", "u", or "]" the resulting box resembles the corresponding upper case letter. A value of "n" suppresses the box. 边框形状通过形状相似的字母或数字来定义,"n"代表没有边框。 |
| cex |
A numerical value giving the amount by which plotting text and symbols should be magnified relative to the default. This starts as 1 when a device is opened, and is reset when the layout is changed. 图形放大倍数。 |
| cex.axis | The magnification to be used for axis annotation relative to the current setting of cex. |
| cex.lab | The magnification to be used for x and y labels relative to the current setting of cex. |
| cex.main | The magnification to be used for main titles relative to the current setting of cex. |
| cex.sub | The magnification to be used for sub-titles relative to the current setting of cex. |
| cin |
R.O.; character size (width, height) in inches. 只读! > par()$cin |
| col | A specification for the default plotting color. |
| col.axis | The color to be used for axis annotation. Defaults to "black". |
| col.lab | The color to be used for x and y labels. Defaults to "black". |
| col.main | The color to be used for plot main titles. Defaults to "black". |
| col.sub | The color to be used for plot sub-titles. Defaults to "black". |
| cra |
R.O.; size of default character (width, height) in ‘rasters’ (pixels). > par()$cra |
R语言实战(三) 图形初阶的更多相关文章
- R语言实战读书笔记(三)图形初阶
这篇简直是白写了,写到后面发现ggplot明显更好用 3.1 使用图形 attach(mtcars)plot(wt, mpg) #x轴wt,y轴pgabline(lm(mpg ~ wt)) #画线拟合 ...
- R提高篇(二): 图形初阶
目录: 图形示例 图形参数 符号.线条 颜色 文本属性 尺寸与边界 自定义标题 自定义坐标轴 图例 文本标注 图形组合 图形示例 如下代码描述病人对两种药物五个剂量水平上的响应情况 > myda ...
- R语言实战(一)介绍、数据集与图形初阶
本文对应<R语言实战>前3章,因为里面大部分内容已经比较熟悉,所以在这里只是起一个索引的作用. 第1章 R语言介绍 获取帮助函数 help(), ? 查看函数帮助 exampl ...
- R语言实战(三)基本图形与基本统计分析
本文对应<R语言实战>第6章:基本图形:第7章:基本统计分析 =============================================================== ...
- R语言实战(七)图形进阶
本文对应<R语言实战>第11章:中级绘图:第16章:高级图形进阶 基础图形一章,侧重展示单类别型或连续型变量的分布情况:中级绘图一章,侧重展示双变量间关系(二元关系)和多变量间关系(多元关 ...
- R入门<三>-R语言实战第4章基本数据管理摘要
入门书籍:R语言实战 进度:1-4章 摘要: 1)实用的包 forecast:用于做时间序列预测的,有auto.arima函数 RODBC:可以用来读取excel文件.但据说R对csv格式适应更加良好 ...
- R语言实战(第二版)-part 1笔记
说明: 1.本笔记对<R语言实战>一书有选择性的进行记录,仅用于个人的查漏补缺 2.将完全掌握的以及无实战需求的知识点略去 3.代码直接在Rsudio中运行学习 R语言实战(第二版) pa ...
- R语言实战
教材目录 第一部分 入门 第一章 R语言介绍 第二章 创建数据集 第三章 图形初阶 第四章 基本数据管理 第五章 高级数据管理 第二部分 基本方法 第六章 基本图形 第七章 基本统计方法 第三部分 中 ...
- R 语言实战-Part 3 笔记
R 语言实战(第二版) part 3 中级方法 -------------第8章 回归------------------ #概念:用一个或多个自变量(预测变量)来预测因变量(响应变量)的方法 #最常 ...
- R语言实战(四)回归
本文对应<R语言实战>第8章:回归 回归是一个广义的概念,通指那些用一个或多个预测变量(也称自变量或解释变量)来预测响应变量(也称因变量.效标变量或结果变量)的方法.通常,回归分析可以用来 ...
随机推荐
- 前端-js-长期维护
############### JS简介和JS引入 ################ <!DOCTYPE html> <html lang="en" ...
- 接口测试 requests的身份认证方式
requests提供多种身份认证方式,包括基本身份认证.netrc 认证.摘要式身份认证.OAuth 1 认证.OAuth 2 与 OpenID 连接认证.自定义认证.这些认证方式的应用场景是什么呢? ...
- ZooKeeper基本讲解及使用
本文摘录于:http://blog.51cto.com/tchuairen/1859494:https://blog.csdn.net/peace1213/article/details/525714 ...
- Java包装类之实体类不要使用基本类型
[color=rgba(0, 0, 0, 0.75)]今天来记录一下,在项目中因为基本类型,所产生的bug.**U•ェ•*U** 包装类:8种基本类型的包装类 应用场景:数据库建立实体映射多用包装类 ...
- sql语句查询成绩表各科前三名
--语法形式: ROW_NUMBER() OVER(PARTITION BY COL1 ORDER BY COL2) --解释: 根据COL1分组,在分组内部根据 COL2排序,而此函数计算的值就表示 ...
- C 语言高效编程与代码优化
译文链接:http://www.codeceo.com/article/c-high-performance-coding.html英文原文:Writing Efficient C and C Cod ...
- ZOJ-1183-Scheduling Lectures
可以用贪心求最小讲课次数,贪心策略也很好想,就是对于任意主题,能早讲就早讲.这种方案的讲课次数一定是最少的,但是不满意指标不一定是最小,然后再利用动态规划求在最少讲课次数前提下的最小不满意指标. 方法 ...
- <luogu1347>排序
本来打算当打了个拓扑的板子 后来发现并不只是个板子 差不多 管他呢 #include<cstdio> #include<cstring> #include<iostrea ...
- t-检验
https://wenku.baidu.com/view/3954f9d9a58da0116c17497b.html介绍的挺好的,可以查看~ 应用方面:用于推断差异发生的概率,与f检验,卡方检验并列 ...
- springboot项目基础面试题
1.springboot与spring的区别. 引用自官方说法: java在集成spring等框架需要作出大量的配置,开发效率低,繁琐.所以官方提出 spring boot的核心思想:习惯优于配置.可 ...