prometheus-添加监控linux服务器
1. prometheus-添加监控linux服务器
prometheus添加监控linux服务器
- node_exporter:用于监控Linux系统的指标采集器。
- 常用指标:
- CPU
- 内存
- 硬盘
- 网络流量
- 文件描述符
- 系统负载
- 系统服务
- 数据接口:http://IP:9100
- 使用文档:https://prometheus.io/docs/guides/node-exporter/
- GitHub:https://github.com/prometheus/node_exporter
安装部署
下载node_exporter包
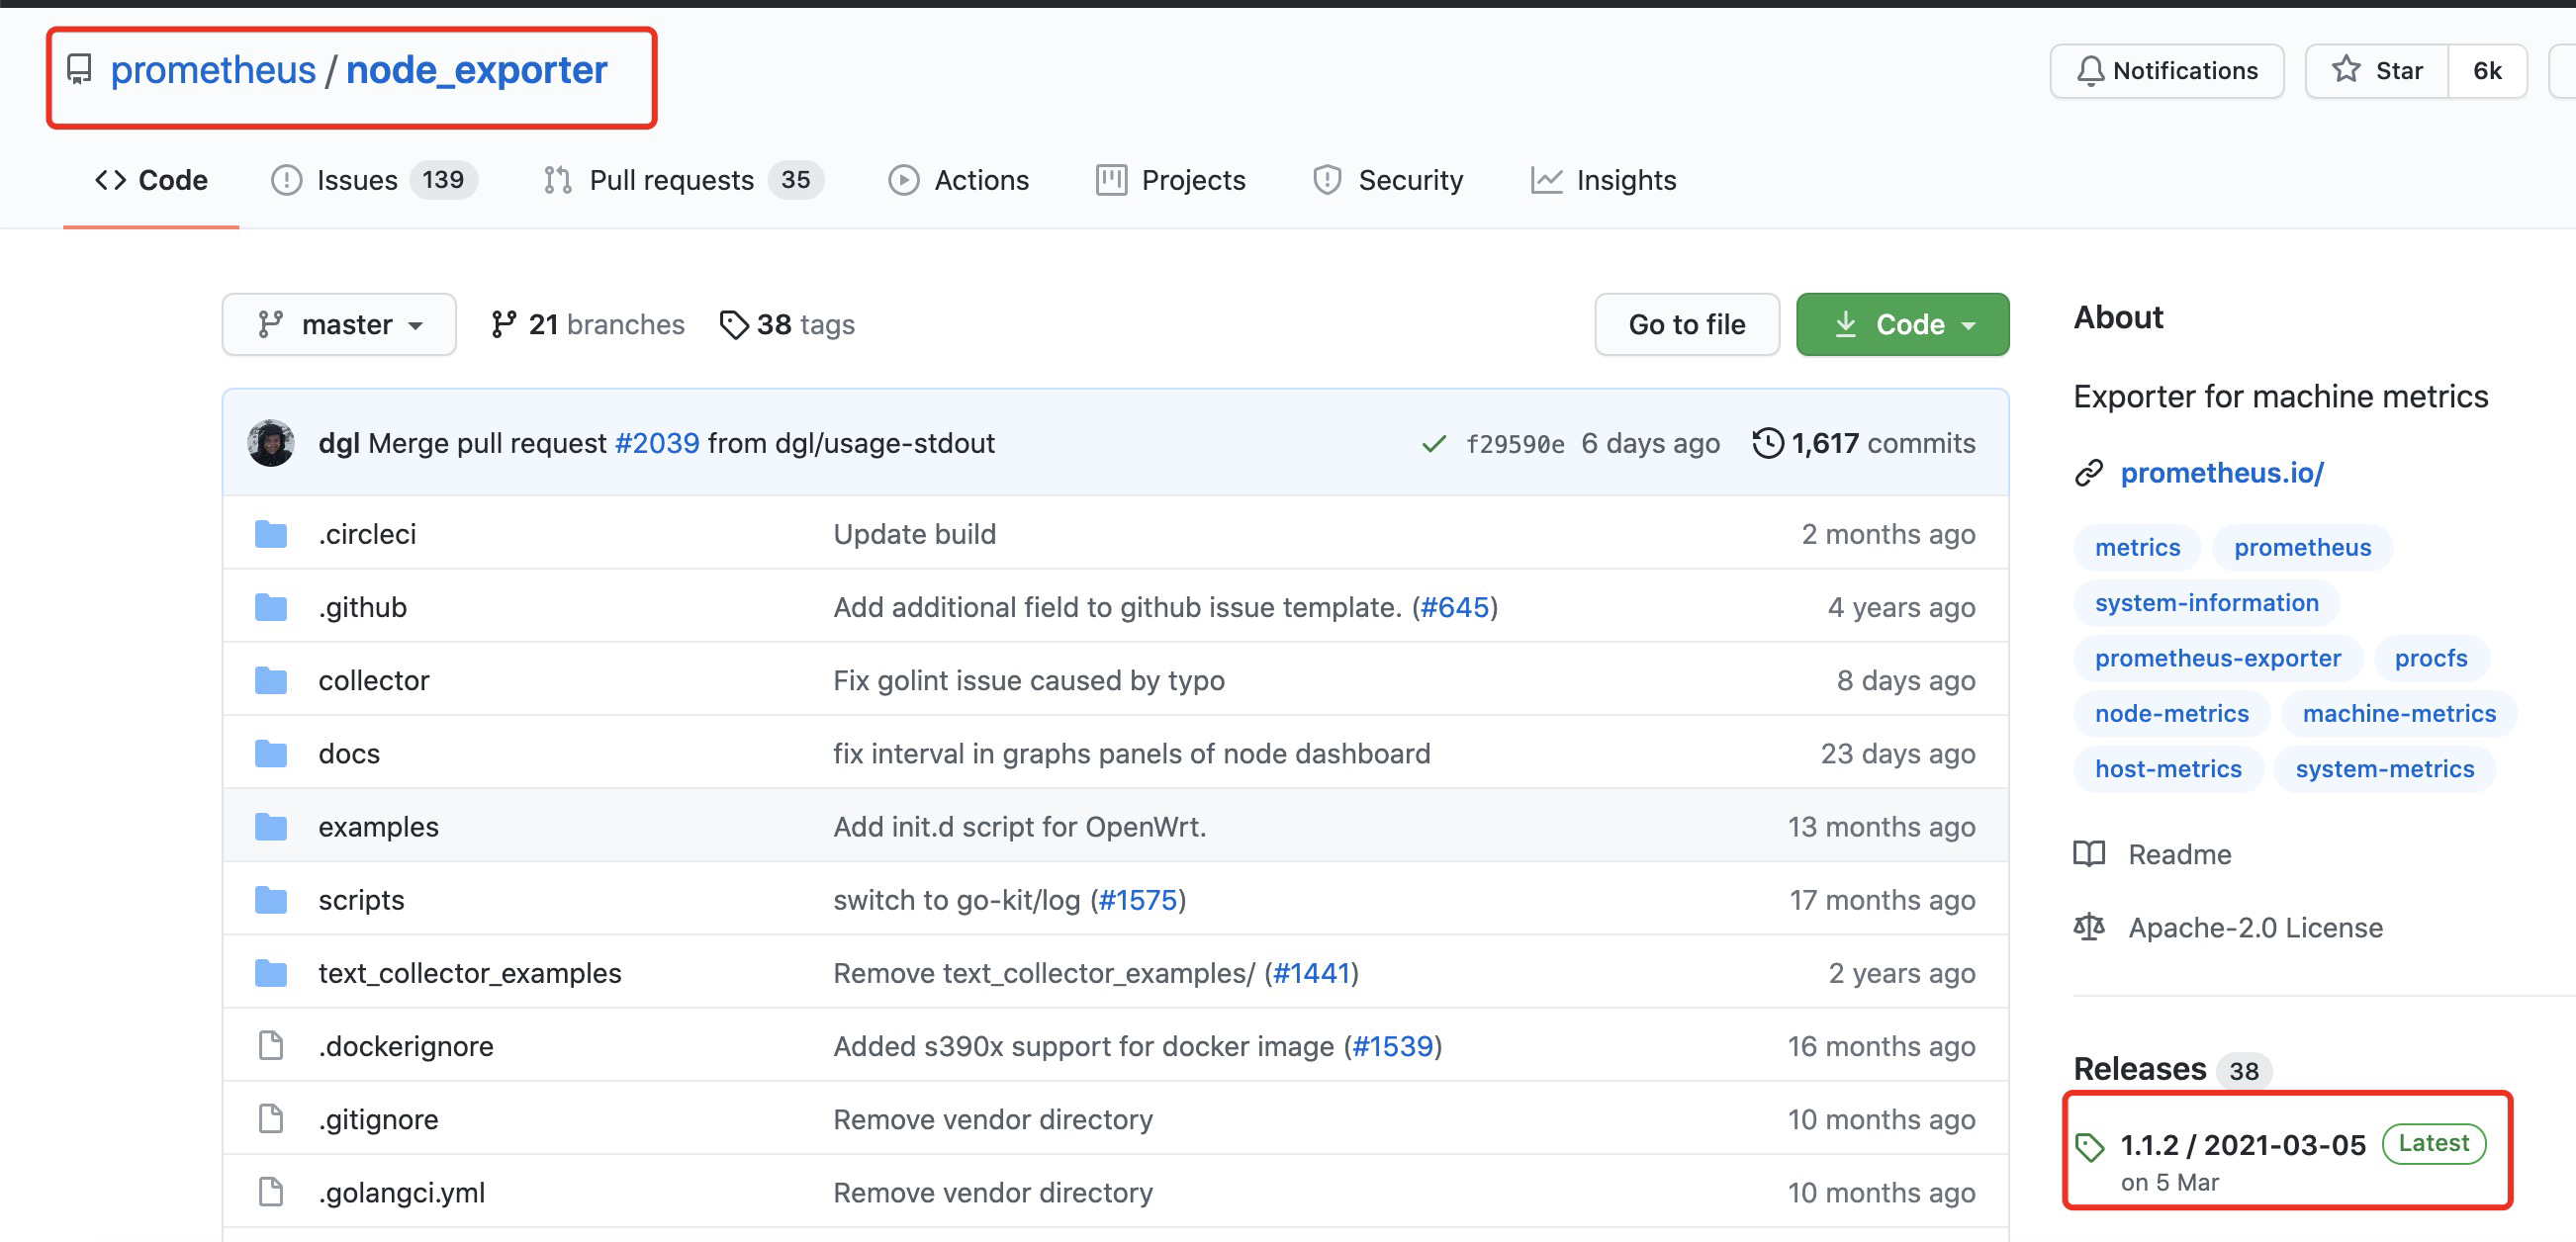
https://github.com/prometheus/node_exporter/releases/download/v1.1.2/node_exporter-1.1.2.linux-amd64.tar.gz
监控端主机下载
[root@VM-0-17-centos ~]# wget https://github.com/prometheus/node_exporter/releases/download/v1.1.2/node_exporter-1.1.2.linux-amd64.tar.gz
解压
[root@VM-0-17-centos ~]# tar  -xvf node_exporter-1.1.2.linux-amd64.tar.gz

node_exporter-1.1.2.linux-amd64/

node_exporter-1.1.2.linux-amd64/LICENSE

node_exporter-1.1.2.linux-amd64/NOTICE

node_exporter-1.1.2.linux-amd64/node_exporter
拷贝到opt目录下存放
[root@VM-0-17-centos ~]# mv node_exporter-1.1.2.linux-amd64 /opt/

[root@VM-0-17-centos ~]# ll /opt/node_exporter-1.1.2.linux-amd64/

total 18748

-rw-r--r-- 1 3434 3434    11357 Mar  5 17:41 LICENSE

-rwxr-xr-x 1 3434 3434 19178528 Mar  5 17:29 node_exporter

-rw-r--r-- 1 3434 3434      463 Mar  5 17:41 NOTICE

[root@VM-0-17-centos ~]# mv /opt/node_exporter-1.1.2.linux-amd64 /opt/node_exporter
切换目录
[root@VM-0-17-centos ~]# cd /opt/node_exporter/

[root@VM-0-17-centos node_exporter]# ll

total 18748

-rw-r--r-- 1 3434 3434    11357 Mar  5 17:41 LICENSE

-rwxr-xr-x 1 3434 3434 19178528 Mar  5 17:29 node_exporter

-rw-r--r-- 1 3434 3434      463 Mar  5 17:41 NOTICE
启动服务尝试
[root@VM-0-17-centos node_exporter]# ./node_exporter

level=info ts=2021-05-19T07:00:05.583Z caller=node_exporter.go:178 msg="Starting node_exporter" version="(version=1.1.2, branch=HEAD, revision=b597c1244d7bef49e6f3359c87a56dd7707f6719)"

level=info ts=2021-05-19T07:00:05.583Z caller=node_exporter.go:179 msg="Build context" build_context="(go=go1.15.8, user=root@f07de8ca602a, date=20210305-09:29:10)"

level=warn ts=2021-05-19T07:00:05.583Z caller=node_exporter.go:181 msg="Node Exporter is running as root user. This exporter is designed to run as unpriviledged user, root is not required."

level=info ts=2021-05-19T07:00:05.583Z caller=filesystem_common.go:74 collector=filesystem msg="Parsed flag --collector.filesystem.ignored-mount-points" flag=^/(dev|proc|sys|var/lib/docker/.+)($|/)

level=info ts=2021-05-19T07:00:05.583Z caller=filesystem_common.go:76 collector=filesystem msg="Parsed flag --collector.filesystem.ignored-fs-types" flag=^(autofs|binfmt_misc|bpf|cgroup2?|configfs|debugfs|devpts|devtmpfs|fusectl|hugetlbfs|iso9660|mqueue|nsfs|overlay|proc|procfs|pstore|rpc_pipefs|securityfs|selinuxfs|squashfs|sysfs|tracefs)$

level=info ts=2021-05-19T07:00:05.584Z caller=node_exporter.go:106 msg="Enabled collectors"

level=info ts=2021-05-19T07:00:05.584Z caller=node_exporter.go:113 collector=arp

level=info ts=2021-05-19T07:00:05.584Z caller=node_exporter.go:113 collector=bcache

level=info ts=2021-05-19T07:00:05.584Z caller=node_exporter.go:113 collector=bonding

level=info ts=2021-05-19T07:00:05.584Z caller=node_exporter.go:113 collector=btrfs

level=info ts=2021-05-19T07:00:05.584Z caller=node_exporter.go:113 collector=conntrack

level=info ts=2021-05-19T07:00:05.584Z caller=node_exporter.go:113 collector=cpu

level=info ts=2021-05-19T07:00:05.584Z caller=node_exporter.go:113 collector=cpufreq

level=info ts=2021-05-19T07:00:05.584Z caller=node_exporter.go:113 collector=diskstats

level=info ts=2021-05-19T07:00:05.584Z caller=node_exporter.go:113 collector=edac

level=info ts=2021-05-19T07:00:05.584Z caller=node_exporter.go:113 collector=entropy

level=info ts=2021-05-19T07:00:05.584Z caller=node_exporter.go:113 collector=fibrechannel

level=info ts=2021-05-19T07:00:05.584Z caller=node_exporter.go:113 collector=filefd

level=info ts=2021-05-19T07:00:05.584Z caller=node_exporter.go:113 collector=filesystem

level=info ts=2021-05-19T07:00:05.584Z caller=node_exporter.go:113 collector=hwmon

level=info ts=2021-05-19T07:00:05.584Z caller=node_exporter.go:113 collector=infiniband

level=info ts=2021-05-19T07:00:05.584Z caller=node_exporter.go:113 collector=ipvs

level=info ts=2021-05-19T07:00:05.584Z caller=node_exporter.go:113 collector=loadavg

level=info ts=2021-05-19T07:00:05.584Z caller=node_exporter.go:113 collector=mdadm

level=info ts=2021-05-19T07:00:05.584Z caller=node_exporter.go:113 collector=meminfo

level=info ts=2021-05-19T07:00:05.584Z caller=node_exporter.go:113 collector=netclass

level=info ts=2021-05-19T07:00:05.584Z caller=node_exporter.go:113 collector=netdev

level=info ts=2021-05-19T07:00:05.584Z caller=node_exporter.go:113 collector=netstat

level=info ts=2021-05-19T07:00:05.584Z caller=node_exporter.go:113 collector=nfs

level=info ts=2021-05-19T07:00:05.584Z caller=node_exporter.go:113 collector=nfsd

level=info ts=2021-05-19T07:00:05.584Z caller=node_exporter.go:113 collector=powersupplyclass

level=info ts=2021-05-19T07:00:05.584Z caller=node_exporter.go:113 collector=pressure

level=info ts=2021-05-19T07:00:05.584Z caller=node_exporter.go:113 collector=rapl

level=info ts=2021-05-19T07:00:05.584Z caller=node_exporter.go:113 collector=schedstat

level=info ts=2021-05-19T07:00:05.584Z caller=node_exporter.go:113 collector=sockstat

level=info ts=2021-05-19T07:00:05.584Z caller=node_exporter.go:113 collector=softnet

level=info ts=2021-05-19T07:00:05.584Z caller=node_exporter.go:113 collector=stat

level=info ts=2021-05-19T07:00:05.584Z caller=node_exporter.go:113 collector=textfile

level=info ts=2021-05-19T07:00:05.584Z caller=node_exporter.go:113 collector=thermal_zone

level=info ts=2021-05-19T07:00:05.584Z caller=node_exporter.go:113 collector=time

level=info ts=2021-05-19T07:00:05.584Z caller=node_exporter.go:113 collector=timex

level=info ts=2021-05-19T07:00:05.584Z caller=node_exporter.go:113 collector=udp_queues

level=info ts=2021-05-19T07:00:05.584Z caller=node_exporter.go:113 collector=uname

level=info ts=2021-05-19T07:00:05.584Z caller=node_exporter.go:113 collector=vmstat

level=info ts=2021-05-19T07:00:05.584Z caller=node_exporter.go:113 collector=xfs

level=info ts=2021-05-19T07:00:05.584Z caller=node_exporter.go:113 collector=zfs

level=info ts=2021-05-19T07:00:05.584Z caller=node_exporter.go:195 msg="Listening on" address=:9100

level=info ts=2021-05-19T07:00:05.584Z caller=tls_config.go:191 msg="TLS is disabled." http2=false
配置为系统服务管理
编写系统配置服务
[root@iZj6cbgktk3zjpge312vq1Z node_exporter]# vim  /usr/lib/systemd/system/node_exporter.service

[root@iZj6cbgktk3zjpge312vq1Z node_exporter]# cat  /usr/lib/systemd/system/node_exporter.service

[Unit]

Description=node_exporter

[Service]

# 添加认证密码文件/opt/node_exporter/config.yml ,默认可以不需要

ExecStart=/opt/node_exporter/node_exporter --web.config=/opt/node_exporter/config.yml

ExecReload=/bin/kill -HUP $MAINPID

KillMode=process

Restart=on-failure

[Install]

WantedBy=multi-user.target
添加config配置文件
[root@VM-0-17-centos node_exporter]# yum install httpd-tools –y

[root@VM-0-17-centos node_exporter]# htpasswd -nBC 12 '' | tr -d ':\n'

New password:       #这里输入的123456

Re-type new password:    #这里输入的123456

$2y$12$.YGKNPkYfSOsm.JataWRUe4vWdTS8nW6YtPQI0Jr14eTv6E5Fpdga          # 这段是生成的key
编写启动配置文件
[root@iZj6cbgktk3zjpge312vq1Z node_exporter]# vim config.yml

[root@iZj6cbgktk3zjpge312vq1Z node_exporter]# cat config.yml

basic_auth_users:

  prometheus: $2y$12$.YGKNPkYfSOsm.JataWRUe4vWdTS8nW6YtPQI0Jr14eTv6E5Fpdga
启动服务
systemctl daemon-reload

systemctl start node_exporter

systemctl enable node_exporter
在prometheus添加主机
添加配置文件
[root@iZj6cbgktk3zjpge312vq2Z prometheus]# vim prometheus.yml

[root@iZj6cbgktk3zjpge312vq2Z prometheus]# cat prometheus.yml

# my global config

global:

  scrape_interval:     15s # Set the scrape interval to every 15 seconds. Default is every 1 minute.

  evaluation_interval: 15s # Evaluate rules every 15 seconds. The default is every 1 minute.

  # scrape_timeout is set to the global default (10s).

# Alertmanager configuration

alerting:

  alertmanagers:

  - static_configs:

    - targets:

      # - alertmanager:9093

# Load rules once and periodically evaluate them according to the global 'evaluation_interval'.

rule_files:

  # - "first_rules.yml"

  # - "second_rules.yml"

# A scrape configuration containing exactly one endpoint to scrape:

# Here it's Prometheus itself.

scrape_configs:

  # The job name is added as a label `job=<job_name>` to any timeseries scraped from this config.

  - job_name: 'prometheus'

    # metrics_path defaults to '/metrics'

    # scheme defaults to 'http'.

    static_configs:

    - targets: ['127.0.0.1:9090']

  - job_name: linux

    # 添加监控主机的用户和密码

    basic_auth:

      username: prometheus

      password: 123456

    static_configs:

      - targets: ['10.1.2.211:9100']

        labels:

          prod: web
重启服务
[root@iZj6cbgktk3zjpge312vq2Z prometheus]# /bin/systemctl restart prometheus
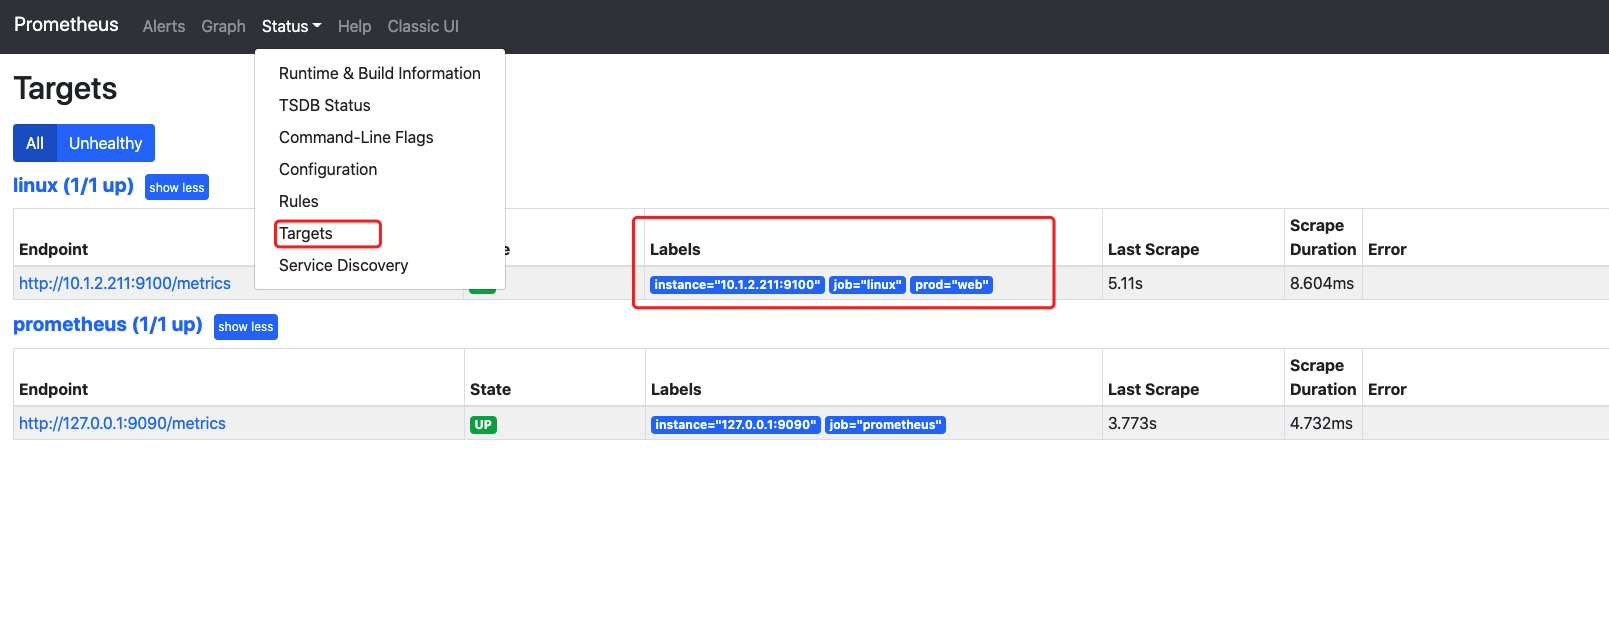
在Prometheus配置文件添加被监控端:
验证prometheus配置文件

验证发现已经有数据了
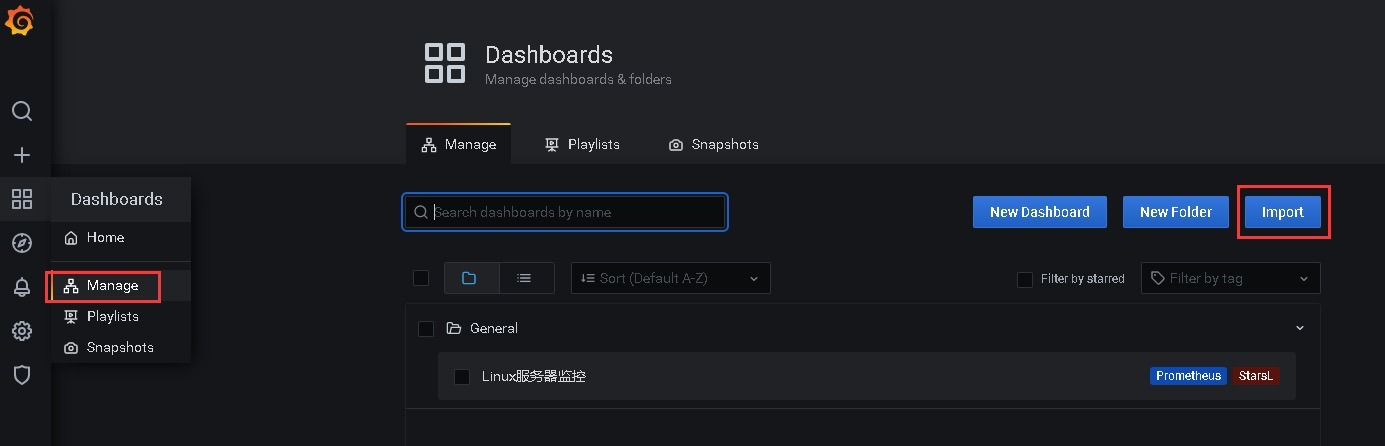
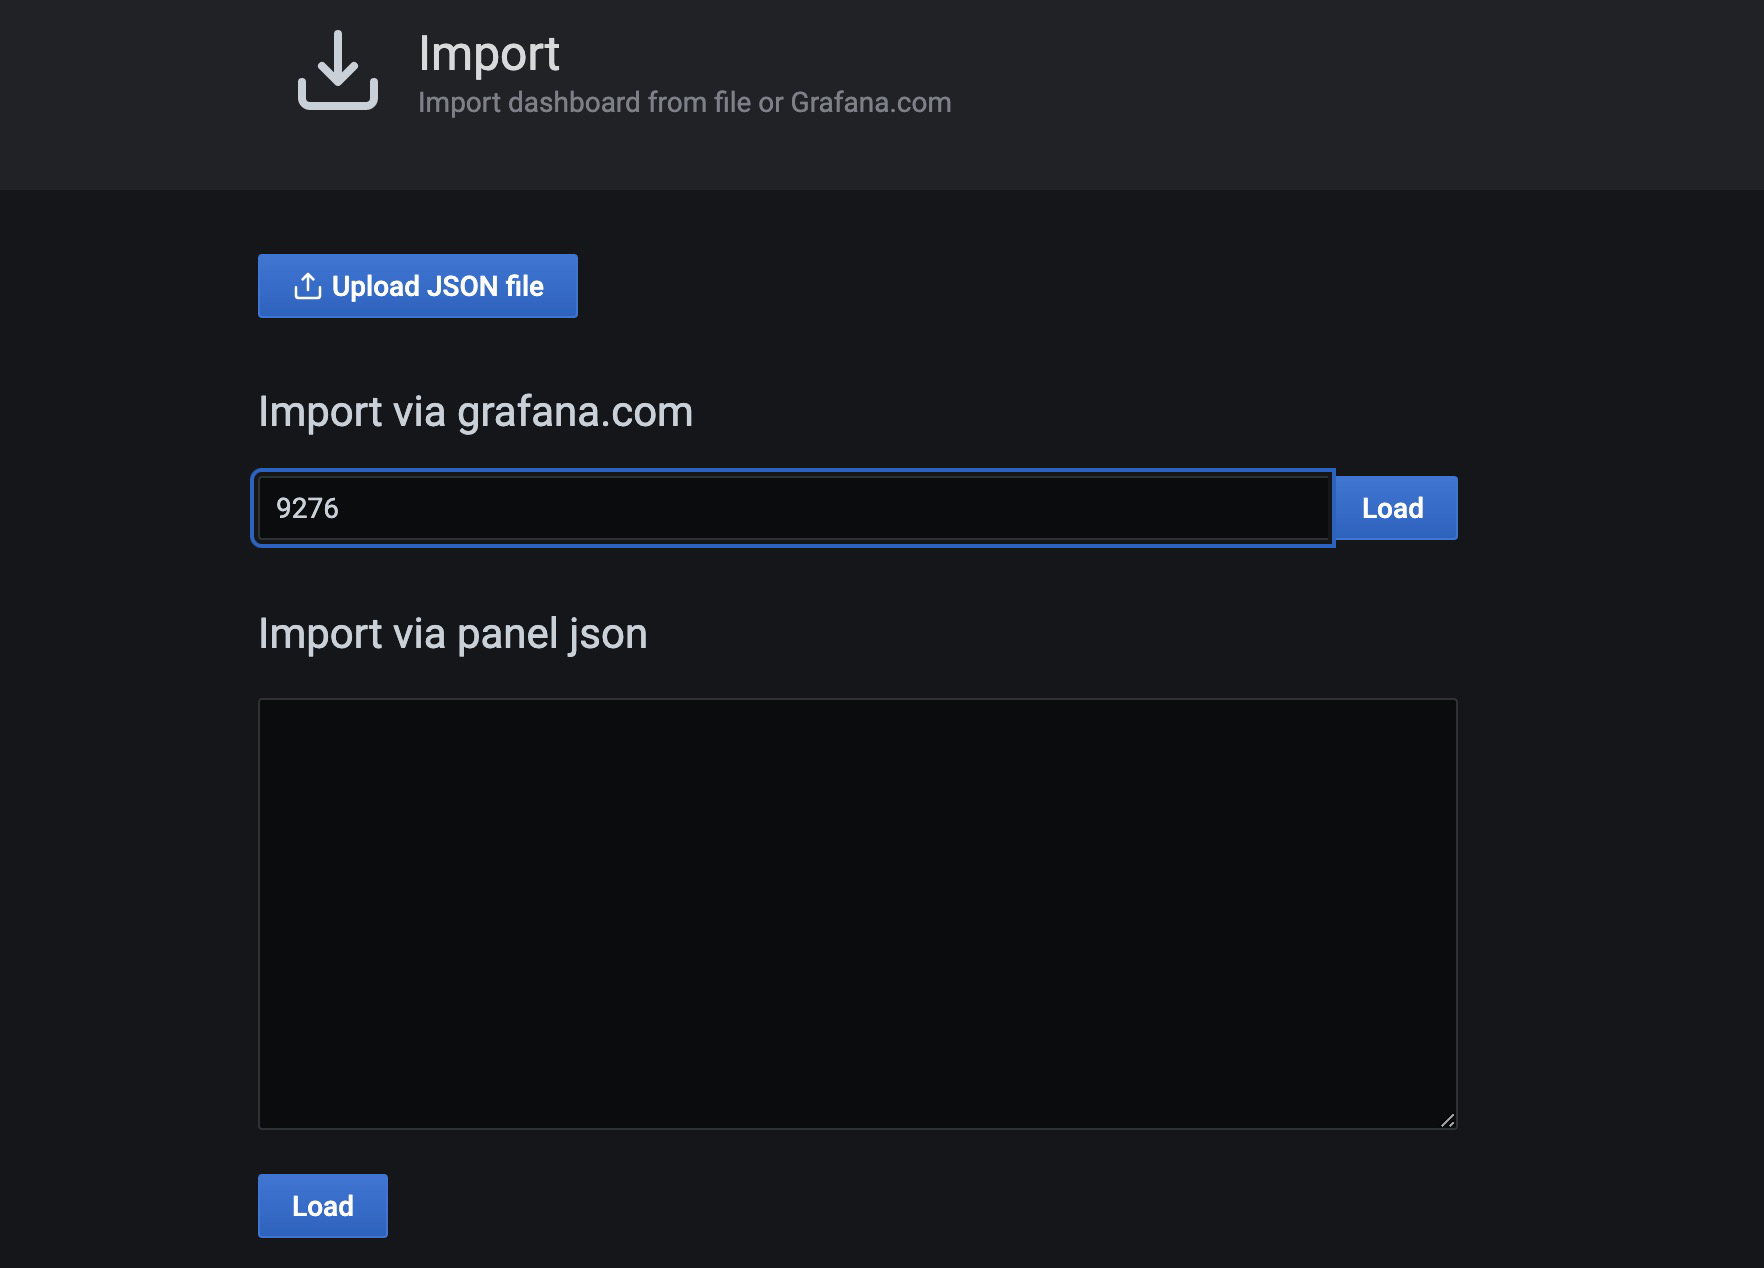
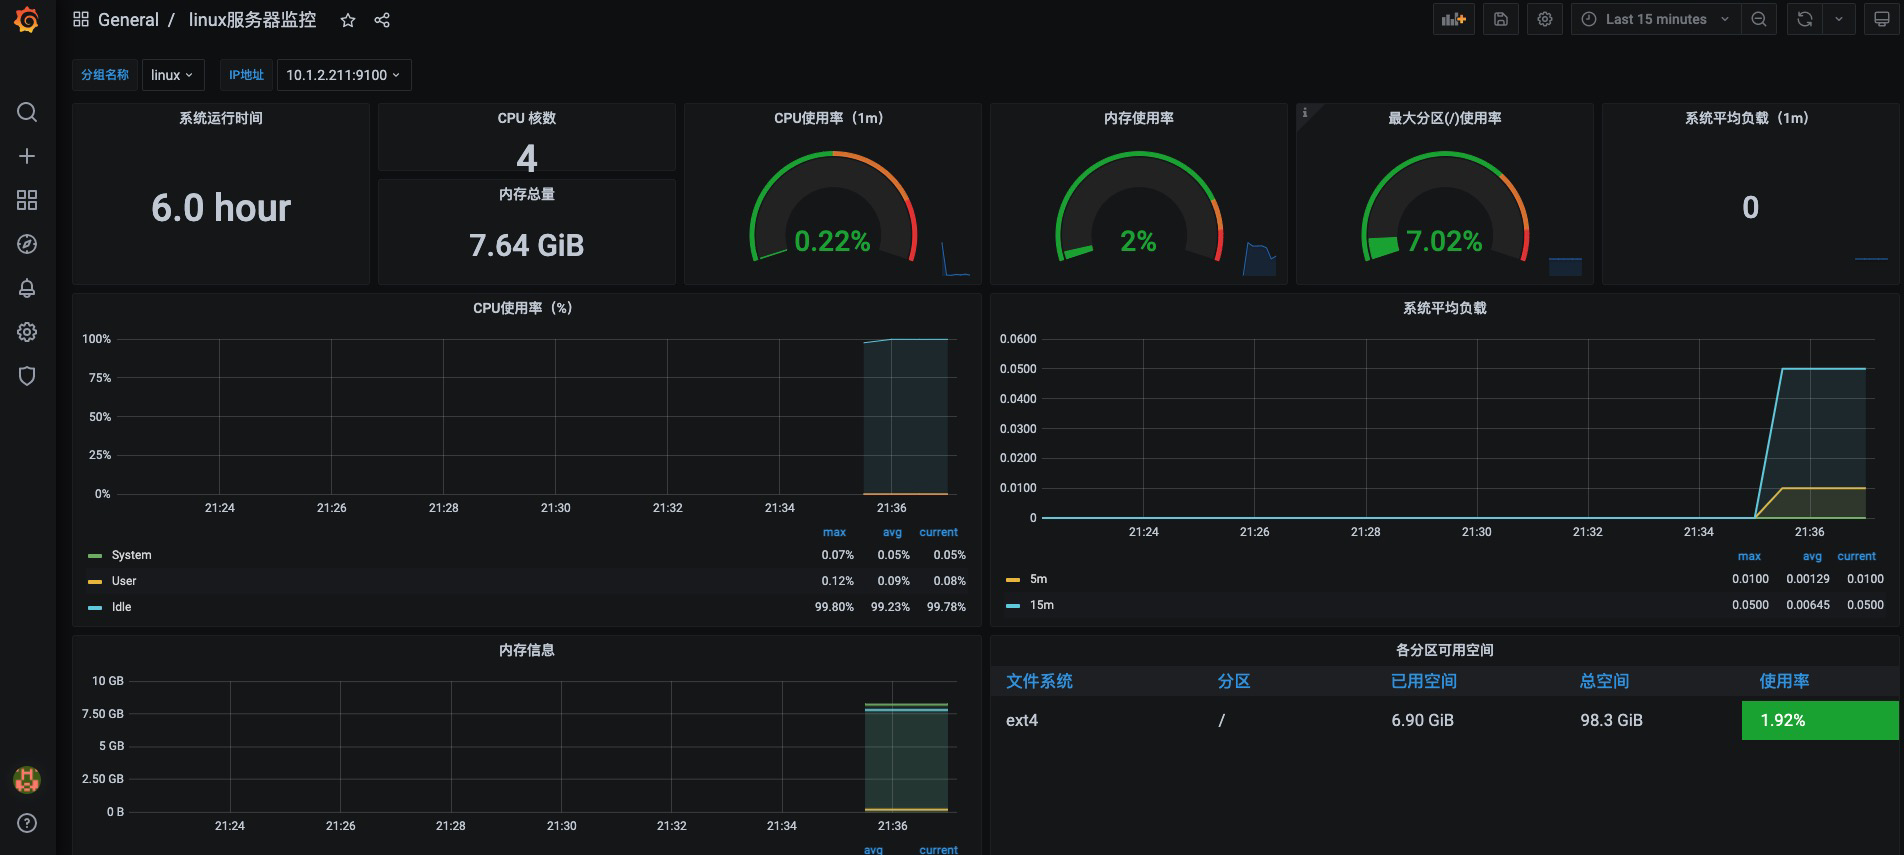
使用Grafana展示node_exporter数据指标,仪表盘ID:9276
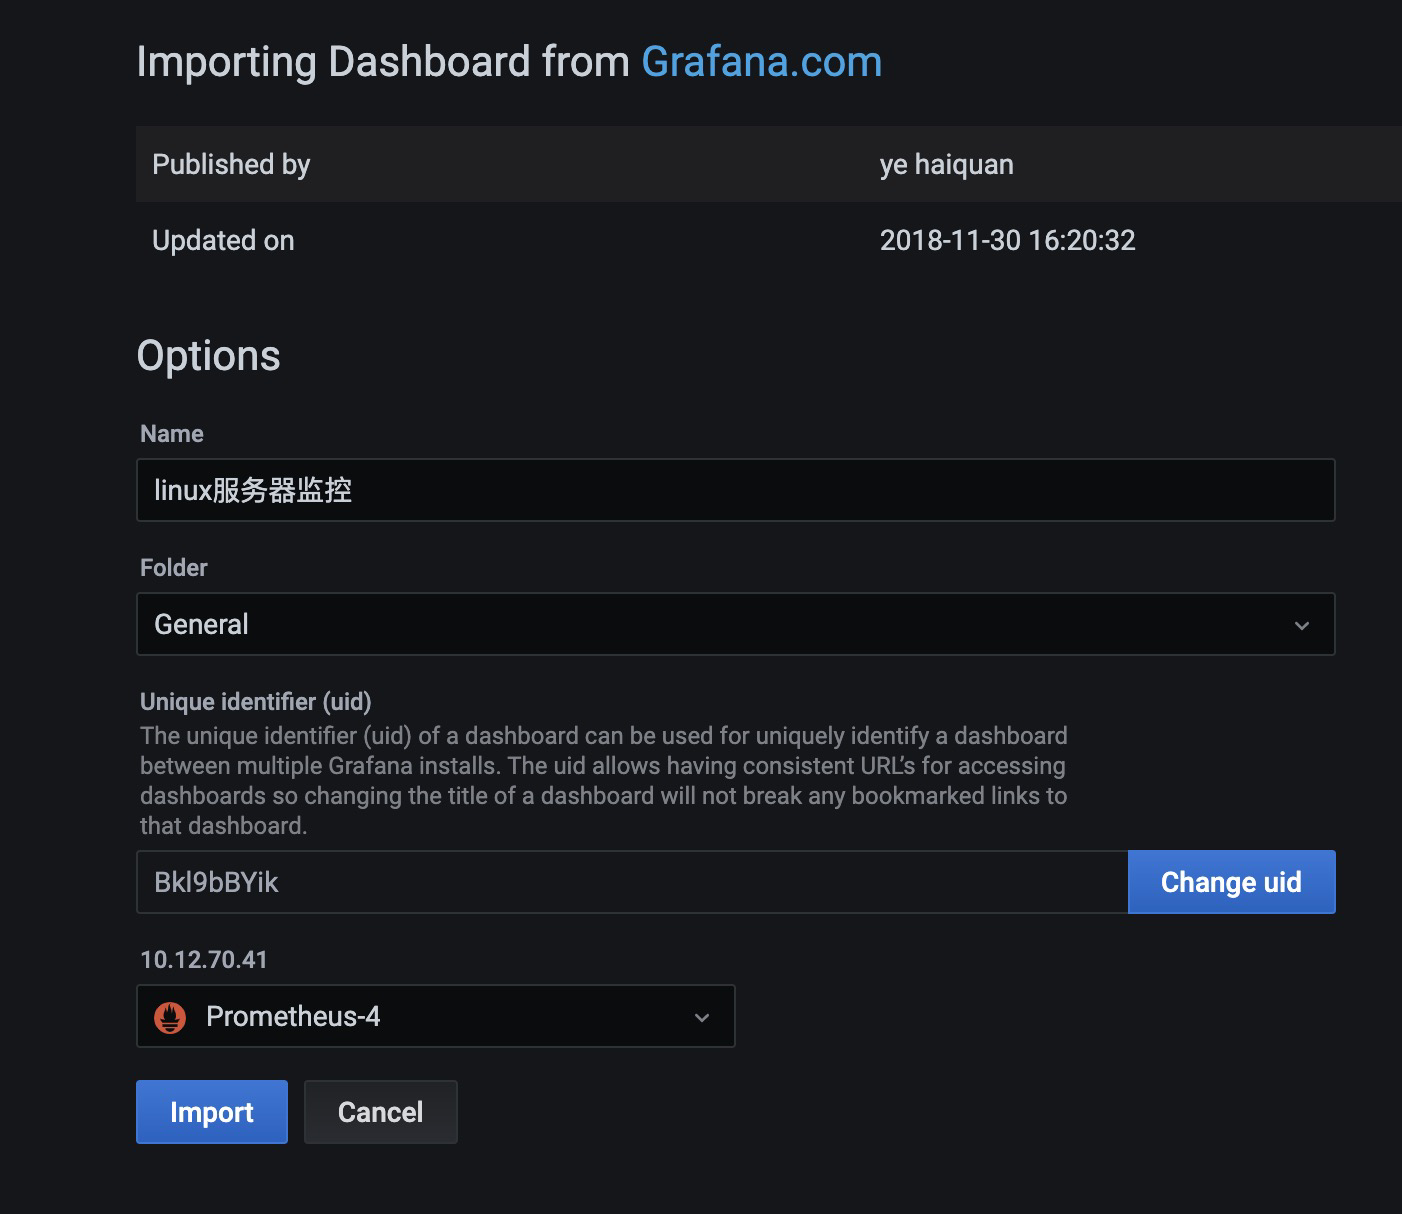
导入仪表盘
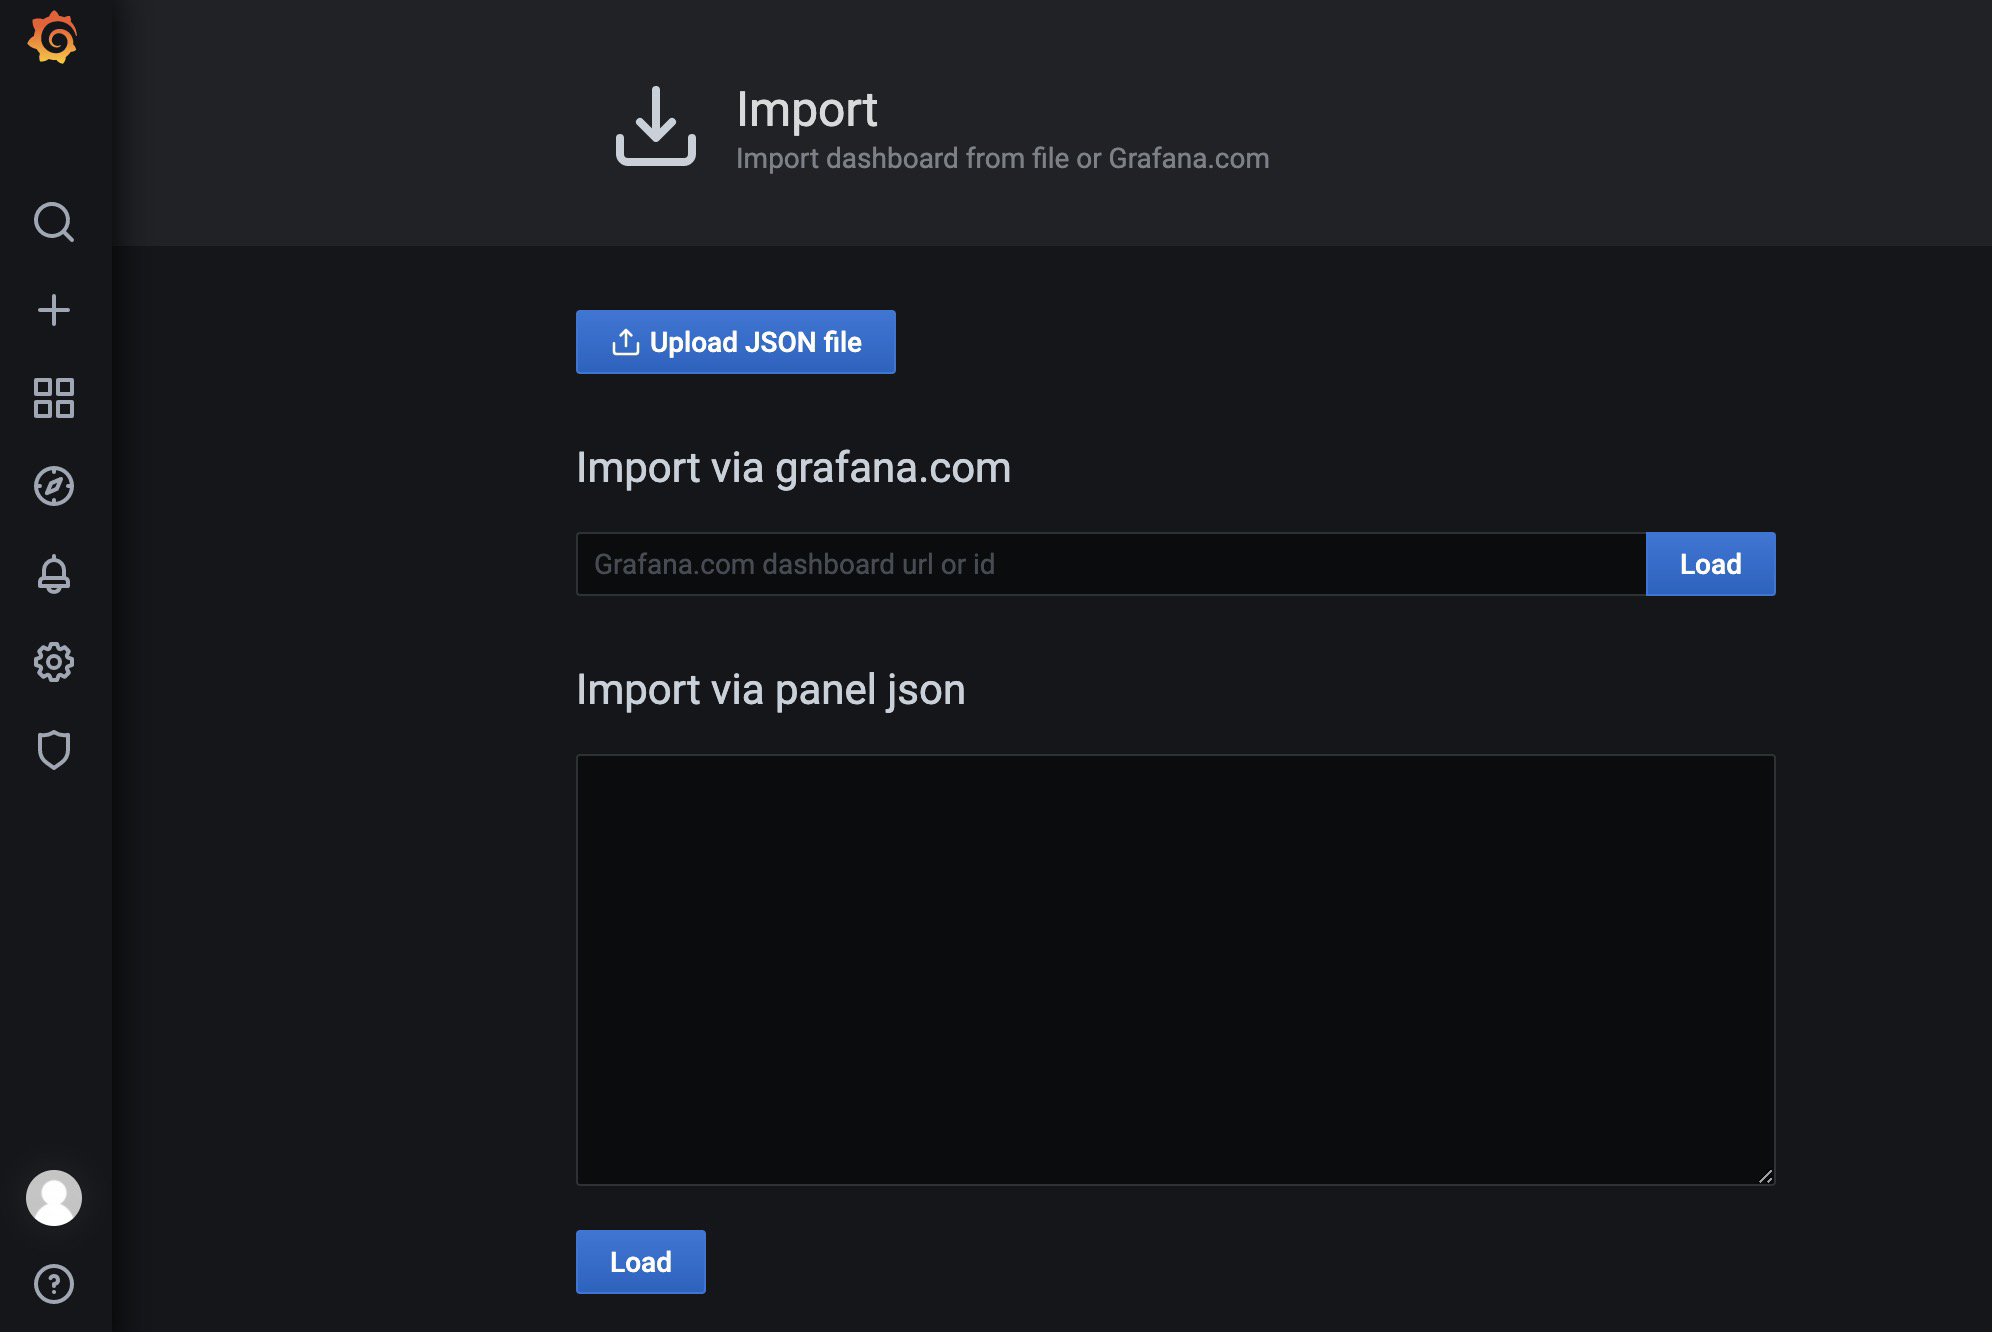
添加
prometheus-添加监控linux服务器的更多相关文章
- Prometheus 监控linux服务器
Prometheus 监控linux服务器 node_exporter:用于*NIX系统监控,使用Go语言编写的收集器. 使用版本 node_exporter 0.17.0 相关文档 使用文档:htt ...
- Grafana+Prometheus通过node_exporter监控Linux服务器信息
Grafana+Prometheus通过node_exporter监控Linux服务器信息 一.Grafana+Prometheus通过node_exporter监控Linux服务器信息 1.1nod ...
- 监控linux服务器网卡流量
监控linux服务器网卡流量 作者:尹正杰 版权声明:原创作品,谢绝转载!否则将追究法律责任. 欢迎加入:高级运维工程师之路 598432640 前言:众所周知,我们安装zabbix服务器 ...
- JMC监控(Windows上远程连接监控Linux服务器的JVM)
Windows上远程连接监控Linux服务器的JVM:1.Linux服务器上配置:在Tomcat的tomcat-wms/bin/catalina.sh中添加CATALINA_OPTS="-X ...
- 监控linux服务器工具nmon的使用
做压测时,需要查看服务器中的cpu.内存变化,但由于服务器是linux环境,则需要监控linux服务器的工具,下面用到的工具是nmon. 1.安装nmon.在网上下载nmon安装包,在linux服务器 ...
- Jmeter监控Linux服务器性能
①.下载JMeterPlugins相关的jar包,放jmeter的安装路径\lib\ext下——这个时候启动jmeter会发现,添加监听器时,出现了一堆的jp@jc……,这些就是插件的功劳. JMet ...
- Windows负载机JVM 远程监控Linux服务器下tomcat
基本是跟着网上的操作进行的,除了遇到一个Local host name unknown的问题: 一.Linux服务器操作部分 服务器地址:10.64.111.68 首先配置JMX: 1.找到jdk目录 ...
- 监控 Linux 服务器活动的几个命令(watch top ac)
watch.top 和 ac 命令为我们监视 Linux 服务器上的活动提供了一些十分高效的途径. 为了在获取系统活动时更加轻松,Linux 系统提供了一系列相关的命令.在这篇文章中,我们就一起来看看 ...
- loadrunner监控linux服务器
参考http://www.cnblogs.com/yangxia-test/archive/2012/11/27/2790771.html http://www.cnblogs.com/candle8 ...
- Spotlight 监控Linux服务器的性能
Spotlight功能:详细的进程跟踪功能远程连接在线的Unix/Linux的调优指南事件日志跟踪配置警报 详细的进程跟踪功能:Spotlight对具体的Unix / Linux的进程长达24小时的历 ...
随机推荐
- HTML5中新增实用的标签
1:progress 进度条 <h3>progress</h3> <progress value="75" max="100"& ...
- 关于Vue多线程的思考
在前端调用的时候,我们难免需要同一时刻向后端请求多组数据或是总是期待着是否存在一个独立的线程去处理一系列的数据.线程相应,资源的抢占这是前端较为麻烦的点.这里就来聊聊我在前端踩的坑. 首先是线程问题说 ...
- 如何去了解Spring
对于你想了解的技术 官方总是一个合适的选择 首先,我们所指的Spring 一般指的是Spring Framework,伴随着的时代的进步,Spring全家桶也逐渐完善起来 Spring 1.Why S ...
- 从0搭建vue3组件库:Shake抖动组件
先看下效果 其实就是个抖动效果组件,实现起来也非常简单.之所以做这样一个组件是为了后面写Form表单的时候会用到它做一个规则校验,比如下面一个简单的登录页面,当点击登录会提示用户哪个信息没输入,当然这 ...
- spring boot+vue前后端项目的分离(我的第一个前后端分离项目)
文章目录 1.前端vue的搭建 2.后端项目的构建 pom文件中引入的jar包 yml文件用来配置连接数据库和端口的设置 application.property进行一些整合 controller层( ...
- 基于 Redis 实现分布式锁
1.主流分布式锁实现方案 基于数据库实现分布式锁 基于缓存(redis 等) 基于 Zookeeper 2.根据实现方式分类 类 CAS 自旋式分布式锁:询问的方式,类似 java 并发编程中的线程获 ...
- JavaScript进阶(Learning Records)
背景:对JavaScript的深入学习 参考:<JavaScript高级程序设计><冴羽 JavaScript 深入> 从原型到原型链 prototype prototype是 ...
- 一个基于角色的访问控制(RBAC)的简单示例
关于"基于角色的访问控制"是什么,本文不再赘述,如果不明白,请自行查阅资料了解. 本文参考用户·角色·权限·表的设计的思想设计. 本文用到的技术有Spring Boot.Sprin ...
- 系统启动后bond配置不生效问题定位
背景描述 为了适配新功能,裸金属服务的磁盘镜像中做了如下修改: dracut添加network, iscsi模块 grub添加rd.iscsi.firmware=1参数 删除网卡配置文件/etc/sy ...
- 嵌入式-C语言基础:联合体和共用体的概念
有时候同一块内存空间存放类型不同,不同类型的变量共享一块空间. 结构体和共用体的区别: (1)结构体元素有各自单独空间,共用体元素共享空间,空间大小由最大类型确定. (2)结构体元素互不影响共用体赋值 ...