ceph rgw的使用,dashboard和监控
1.部署RadosGW 服务
将ceph-mgr1、ceph-mgr2 服务器部署为高可用的radosGW 服务
1.1 安装radosgw 服务
root@mgr1:~# apt install radosgw root@mgr2:~# apt install radosgw
1.2 初始化rgw节点
$ ceph-deploy --overwrite-conf rgw create mgr1

$ ceph-deploy --overwrite-conf rgw create mgr2
1.3 验证radosgw 服务状态
$ ceph -s

cluster:

    id:     54ed6318-9830-4152-917c-f1af7fa1002a

    health: HEALTH_OK

    services:     mon: 3 daemons, quorum mon1,mon2,mon3 (age 3d)

    mgr: mgr1(active, since 3d), standbys: mgr2

    mds: 2/2 daemons up, 2 standby

    osd: 20 osds: 20 up (since 3d), 20 in (since 3d)

    rgw: 2 daemons active (2 hosts, 1 zones)

data:

    volumes: 1/1 healthy

    pools:   8 pools, 217 pgs

    bjects: 477 objects, 774 MiB

    usage:   11 GiB used, 1.9 TiB / 2.0 TiB avail

    pgs:     217 active+clean
1.4 验证radosgw 服务进程
root@mgr1:~# ps -ef |grep radosgw

ceph      1261     1  0 10:40 ?        00:00:02 /usr/bin/radosgw -f --cluster ceph --name client.rgw.mgr1 --setuser ceph --setgroup ceph

root@mgr2:~# ps -ef |grep radosgw

ceph     32197     1  0 10:41 ?        00:00:02 /usr/bin/radosgw -f --cluster ceph --name client.rgw.mgr2 --setuser ceph --setgroup ceph
2.radosgw 服务配置
2.1 自定义端口
2.1.1 配置文件可以在ceph deploy 服务器修改然后统一推送,或者单独修改每个radosgw 服务器的配置为同一配置。
[client.rgw.mgr1] rgw_host = mgr1 rgw_frontends = civetweb port=8080

[client.rgw.mgr2] rgw_host = mgr2 rgw_frontends = civetweb port=8080
2.1.2 同步配置文件到rgw1(mgr1),rgw2(mgr2)
cephuser@ceph-deploy:~/ceph-cluster$ scp ceph.conf root@mgr1:/etc/ceph/

cephuser@ceph-deploy:~/ceph-cluster$ scp ceph.conf root@mgr2:/etc/ceph/
2.1.3 在rgw节点重启rgw服务
root@mgr1:~# systemctl restart ceph-radosgw@rgw.mgr1.service

root@mgr2:~# systemctl restart ceph-radosgw@rgw.mgr2.service
root@mgr2:~# netstat -ntlp |grep radosgw

Active Internet connections (only servers) Proto Recv-Q Send-Q Local Address

Foreign Address         State       PID/Program name     tcp        0      0

0.0.0.0:8080            0.0.0.0:*               LISTEN      32197/radosgw
2.2 配置nginx 代理
2.2.1 安装nginx并配置
apt install nginx

rm -f /etc/nginx/sites-enabled/default

vim /etc/nginx/sites-enabled/ceph_rgw.conf

upstream rgw_yanceph {

    server 192.168.2.31:8080;

    server 192.168.2.32:8080;

}

server {

    listen       80;

    server_name  rgw.yanceph.com;

    charset utf-8;

    location / {

        proxy_pass  http://rgw_yanceph;

        proxy_set_header    Host   $host;

        access_log /var/log/nginx/rgw.yanceph.com.log;

    }

}

# nginx 配置检查

nginx -t

# nginx 后台启动

nginx
2.2.2 winows测试机上配置hosts
192.168.2.2 rgw.yanceph.com
2.2.3 访问rgw.yanceph.com 测试:
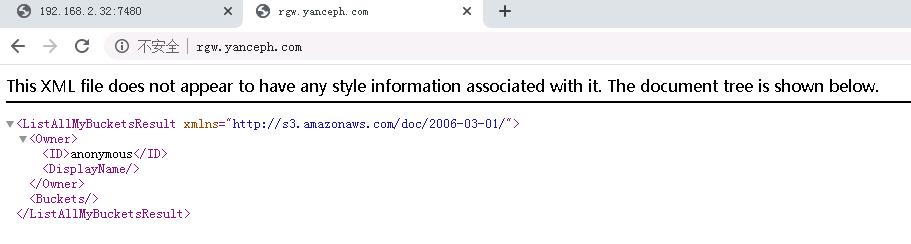
2.2.4 如需https协议, 可以申请域名的ssl证书并在nginx配置即可,配置文件修改如下
listen       443 ssl;

server_name  lrgw.yanceph.com;

ssl_certificate      cert/rgw.yanceph.comt.pem;

ssl_certificate_key  cert/rgw.yanceph.com.key;

charset utf-8;
3.Ceph dashboard
Ceph dashboard 是通过一个web 界面,对已经运行的ceph 集群进行状态查看及功能配置等功能,
3.1 启用dashboard 插件
Ceph mgr 是一个多插件( 模块化) 的组件, 其组件可以单独的启用或关闭
root@mgr1:~# apt install ceph-mgr-dashboard
3.2 查看开启的模块
cephuser@ceph-deploy:~/ceph-cluster$ ceph mgr module ls |head -n 30

{

...

    "enabled_modules": [

        "dashboard",

        "iostat",

        "nfs",

        "restful"

    ],

...

}
3.3 启用dashboard 模块
Ceph dashboard 在mgr 节点进行开启设置,并且可以配置开启或者关闭SSL
# 开启dashboard模块

$ ceph mgr module enable dashboard

# 开启dashboard模块的ssl (关闭是false)

$ ceph config set mgr mgr/dashboard/ssl true

# 设置监听地址

ceph confi set mgr mgr/dashboard/mgr1/server_addr 192.168.2.31

#设置监听端口

ceph confi set mgr mgr/dashboard/mgr1/server_port 9009
如果集群报错,需要重启mgr服务
cephuser@ceph-deploy:~/ceph-cluster$ ceph -s

  cluster:

    id:     54ed6318-9830-4152-917c-f1af7fa1002a

    health: HEALTH_ERR

            Module 'dashboard' has failed: OSError("Port 8080 not free on '192.168.2.31'",)
root@mgr1:~# systemctl restart ceph-mgr@mgr1.service
3.4 查看dashboard服务状态
cephuser@ceph-deploy:~/ceph-cluster$ ceph mgr services

{

    "dashboard": "http://192.168.2.31:9009/"

}
3.5 设置dashboard账号和密码
$  touch ceph-dashboard-passwd.txt

$ echo admin123123 >> ceph-dashboard-passwd.txt

$ ceph dashboard set-login-credentials admin -i ceph-dashboard-passwd.txt

******************************************************************

***          WARNING: this command is deprecated.              ***

*** Please use the ac-user-* related commands to manage users. ***

******************************************************************
3.6 验证并访问dashboard
3.7 配置dashboard SSL
# ceph 自签名证书

$ ceph dashboard create-self-signed-cert

Self-signed certificate created

$ ceph config set mgr mgr/dashboard/ssl true
如果不生效需要重启mgr服务
root@mgr1:~# systemctl restart ceph-mgr@mgr1.service
3.8 查看dashboard ssl
cephuser@ceph-deploy:~/ceph-cluster$ ceph mgr services

{

    "dashboard": "https://192.168.2.31:8443/"

}
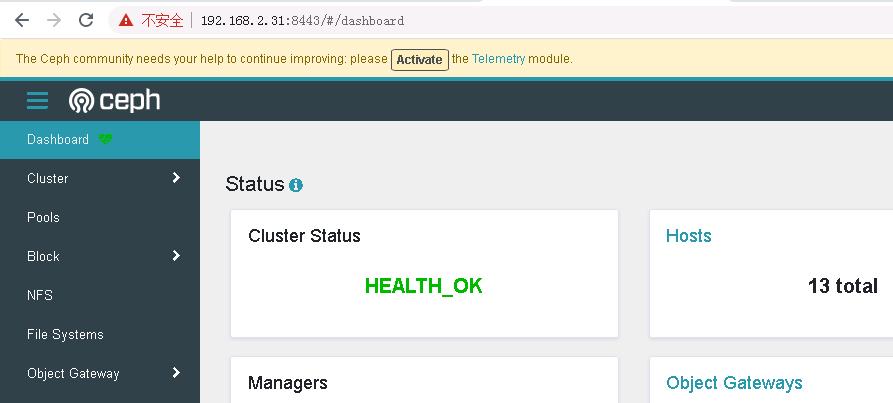
3.9 使用https访问dashboard
4.使用prometheus监控ceph node节点
4.1 部署prometheus
# 创建专用目录

mkdir /apps

cd /apps

# 下载安装包

root@mgr1:/apps# wget https://mirrors.tuna.tsinghua.edu.cn/github-release/prometheus/prometheus/LatestRelease/prometheus-2.29.2.linux-amd64.tar.gz

# 解压安装包

root@mgr1:/apps# tar xf prometheus-2.29.2.linux-amd64.tar.gz

# 创建软连接,主要方便后续版本升级,执行修改软连接即可

root@mgr1:/apps# ln -s /apps/prometheus-2.29.2.linux-amd64 /apps/prometheus
4.2 配置prometheus
# 新建配置文件

# vim /etc/systemd/system/prometheus.service

[Unit]

Description=Prometheus Server

Documentation=https://prometheus.io/docs/introduction/overview/

After=network.target

[Service]

Restart=on-failure

WorkingDirectory=/apps/prometheus/

ExecStart=/apps/prometheus/prometheus --config.file=/apps/prometheus/prometheus.yml

[Install]

WantedBy=multi-user.target

#启动服务

root@mgr1:/apps/prometheus# systemctl daemon-reload

root@mgr1:/apps/prometheus# systemctl restart prometheus

root@mgr1:/apps/prometheus# systemctl enable prometheus
4.3 浏览器访问prometheus
4.4 部署node_exporter
各node(osd)节点安装node_exporter
# 创建目录

root@osd1:/apps# mkdir /apps && cd !$

# 下载安装包

root@osd1:/apps# wget https://github.com/prometheus/node_exporter/releases/download/v1.2.2/node_exporter-1.2.2.linux-amd64.tar.gz

# 解压

root@osd1:/apps# tar xf node_exporter-1.2.2.linux-amd64.tar.gz

# 为方便后续版本升级创建软连接

root@osd1:/apps# ln -sv /apps/node_exporter-1.2.2.linux-amd64
4.5 配置node_exporter
# 创建配置文件

root@osd1:/apps# vim /etc/systemd/system/node-exporter.service

[Unit]

Description=Prometheus Node Exporter

After=network.target

[Service]

ExecStart=/apps/node_exporter/node_exporter

[Install]

WantedBy=multi-user.target

# 启动服务

root@osd1:/apps# systemctl daemon-reload

root@osd1:/apps# systemctl restart node-exporter

root@osd1:/apps# systemctl enable node-exporter

# 查看进程和监听端口号

root@osd1:/apps# ps -ef |grep exporter

root       29396       1  0 16:23 ?        00:00:00 /apps/node_exporter/node_exporter

root       29457   29017  0 16:23 pts/0    00:00:00 grep --color=auto exporter

root@osd1:/apps# netstat -ntlp |grep exporter

tcp6       0      0 :::9100                 :::*                    LISTEN      29396/node_exporter
其他node节点也需安装
4.6 配置prometheus server,增加node节点监控配置
root@mgr1:/apps/prometheus# vim prometheus.yml

  - job_name: 'ceph-node-data'

    static_configs:

            - targets: ['192.168.2.41:9100','192.168.2.42:9100','192.168.2.43:9100','192.168.2.44:9100']

            -

# 重启服务

root@mgr1:/apps/prometheus# systemctl restart prometheus.service
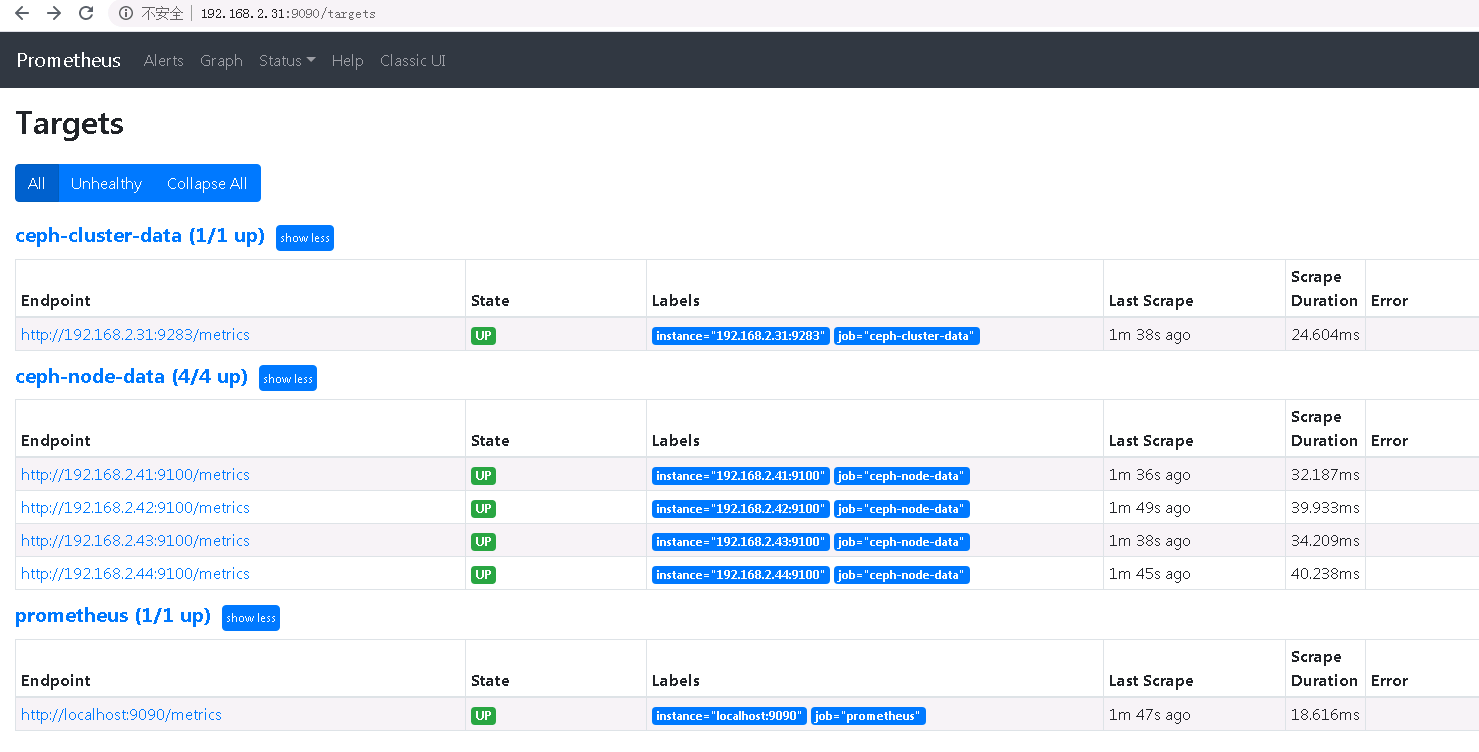
4.7浏览器访问
5.通过prometheus 监控ceph 服务
Ceph manager 内部的模块中包含了prometheus 的监控模块,并监听在每个manager 节点的9283 端口,该端口用于将采集到的信息通过http 接口向prometheus 提供数据
5.1 启用ceph prometheus 监控模块
$ ceph mgr module enable prometheus
5.2 prometheus server 验证监听端口
root@mgr1:/apps/prometheus# netstat -ntlp |grep 9283

tcp        0      0 192.168.2.31:9283       0.0.0.0:*               LISTEN      2687/ceph-mgr
5.3 验证manager 数据
curl "http://192.168.2.31:9283"
5.4 配置prometheus采集数据
root@mgr1:/apps/prometheus# vim prometheus.yml

  - job_name: 'ceph-cluster-data'

    static_configs:

            - targets: ['192.168.2.31:9283']
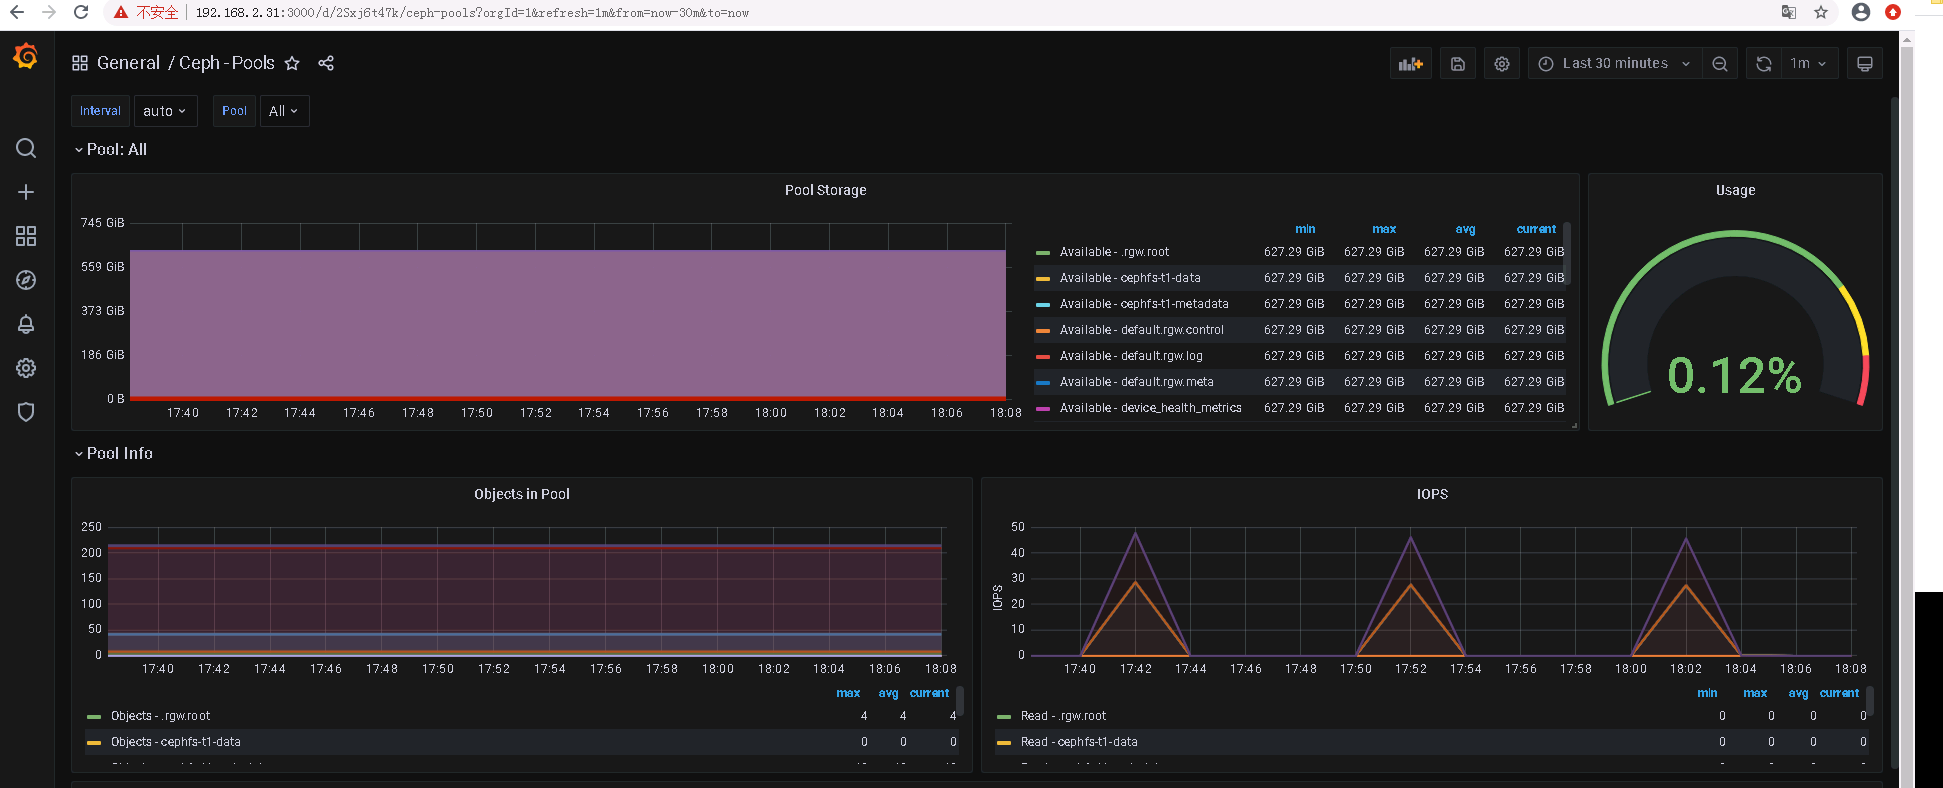
6. 通过grafana显示监控数据
通过granfana 显示对ceph 的集群监控数据及node 数据
6.1 安装grafana
# 安装依赖包

root@mgr1:/apps# apt-get install -y adduser libfontconfig1

# 下载安装包

root@mgr1:/apps# wget https://dl.grafana.com/oss/release/grafana_8.1.2_amd64.deb

# 安装

root@mgr1:/apps# dpkg -i grafana_8.1.2_amd64.deb

# 启动

root@mgr1:/apps# systemctl restart grafana-server.service

# 设置开机自启动

root@mgr1:/apps# systemctl enable grafana-server.service
6.2 浏览器访问
初始账号密码admin:admin
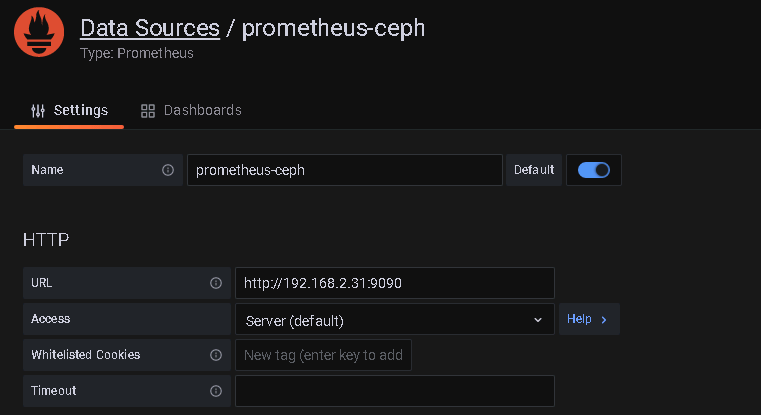
6.3 配置数据源
configuration -> Data souces
6.4 导入模板
create -> import
2842
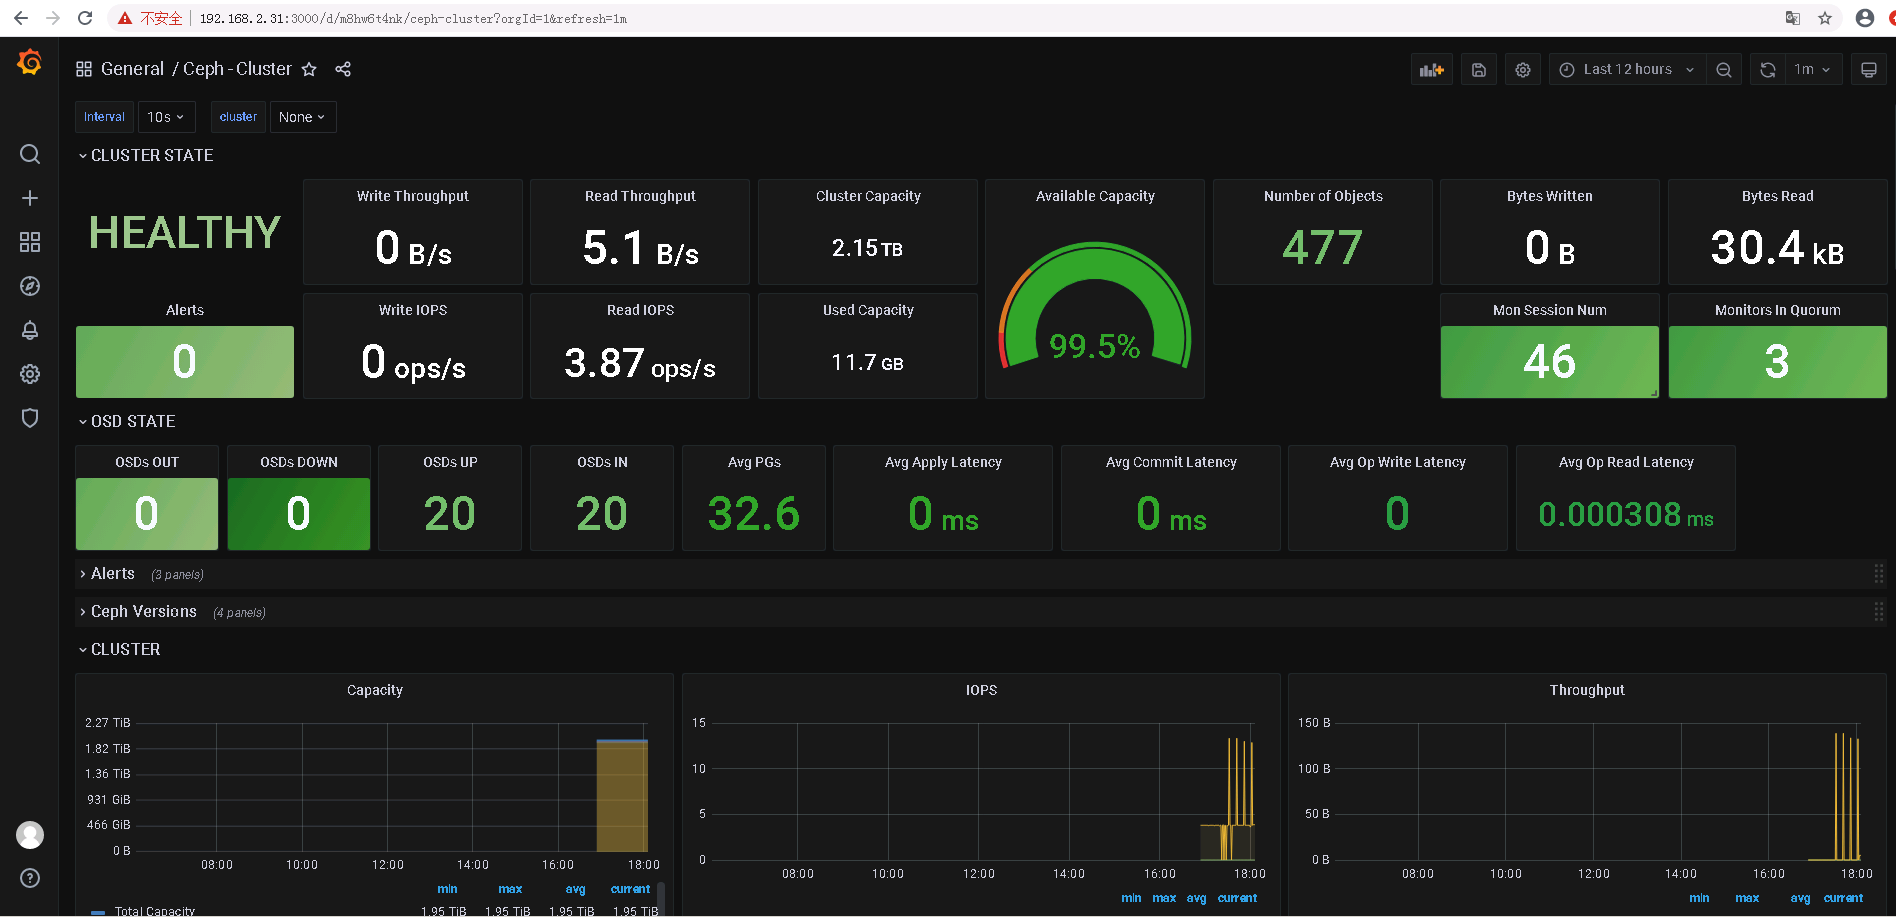
5346
ceph rgw的使用,dashboard和监控的更多相关文章
- Centos7下设置ceph 12.2.1 (luminous)dashboard UI监控功能
前言 本文所使用的集群是作者在博客 Centos7下部署ceph 12.2.1 (luminous)集群及RBD使用 中所搭建的集群 dashboard是为了完成对集群状态进行UI监控所开发的功能, ...
- 分布式存储系统之Ceph集群启用Dashboard及使用Prometheus监控Ceph
前文我们了解了Ceph之上的RadosGW基础使用相关话题,回顾请参考https://www.cnblogs.com/qiuhom-1874/p/16768998.html:今天我们来聊一聊Ceph启 ...
- ceph rgw java sdk 使用域名访问服务时需要设置s3client的配置项 PathStyleAccess 为true, 负责将报域名异常
Caused by: java.net.UnknownHostException: my-new-bucket.s3.yyclouds.com at java.net.InetAddress.getA ...
- 趣解 ceph rgw multisite data sync 机制
multisite是ceph rgw对象数据异地容灾备份的一个有效方案,笔者希望深入理解该技术,并应用于生产环境中,然而rgw的这部分代码晦涩难懂,笔者多次尝试阅读,仍云里雾里不解其意,最终流着泪咬着 ...
- CEPH RGW多 ZONE的配置
相关的名称解释 Region :可以理解为区域,是基于地理位置的逻辑划分:如:华南,华北之类,包含多个region的Ceph集群必须指定一个master region,一个region可以包含一个或者 ...
- SpringCloud学习笔记(5):Hystrix Dashboard可视化监控数据
简介 上篇文章中讲了使用Hystrix实现容错,除此之外,Hystrix还提供了近乎实时的监控.本文将介绍如何进行服务监控以及使用Hystrix Dashboard来让监控数据图形化. 项目介绍 sc ...
- 010 Ceph RGW对象存储
一.对象存储 1.1 介绍 通过对象存储,将数据存储为对象,每个对象除了包含数据,还包含数据自身的元数据 对象通过Object ID来检索,无法通过普通文件系统操作来直接访问对象,只能通过API来访问 ...
- Ceph RGW服务 使用s3 java sdk 分片文件上传API 报‘SignatureDoesNotMatch’ 异常的定位及规避方案
import java.io.File; import com.amazonaws.AmazonClientException; import com.amazonaws.auth.profile ...
- Ceph RGW 创建默认的pool
使用Ceph-deploy完成RGW服务部署后(最好是在部署RGW服务前建立如下这些pool),使用sudo ceph osd lspools 命令,会发现RGW自动以默认参数创建了N个rgw相关的p ...
随机推荐
- WPF实现Win10汉堡菜单
WPF开发者QQ群: 340500857 | 微信群 -> 进入公众号主页 加入组织 前言 有小伙伴提出需要实现Win10汉堡菜单效果. 由于在WPF中没有现成的类似UWP的汉堡菜单,所以我们 ...
- AOP的简单介绍
1.AOP简介 AOP面向切面编程,采取横向抽取机制,取代了传统纵向继承体系重复性代码(性能监视.安全检查.缓存) SpringAOP使用纯java实现,不需要专门的编译过程和类加载器,在运行期间以代 ...
- 一次简单的SQL注入绕WAF
本人也是小白一枚,大佬请绕过,这个其实是六月份的时候做的,那时候想多点实战经验,就直接用谷歌搜索找了一些网站,这个是其中一个 1.目标网站 2.发现有WAF防护 3.判断存在注入 4.猜测了一下闭合为 ...
- 【死磕 NIO】— Reactor 模式就一定意味着高性能吗?
大家好,我是大明哥,我又来了. 为什么是 Reactor 一般所有的网络服务,一般分为如下几个步骤: 读请求(read request) 读解析(read decode) 处理程序(process s ...
- 【UE4 C++】 Datatable 读写、导入导出 CSV/Json
Datatable 读取行数据 1. 创建结构体 继承自 FTableRowBase USTRUCT(BlueprintType) struct FSimpleStruct :public FTabl ...
- 小白学习C语言必背的18个经典程序
1./*输出9*9口诀.共9行9列,i控制行,j控制列.*/ #include "stdio.h" main() {int i,j,result; for (i=1;i<10 ...
- POJ 1274 The Perfect Stall(二分图最大匹配)
题意: N头牛M个牛棚,每只牛都有它自己指定的若干个它愿意呆的牛棚. 每个牛棚最多呆一头牛. 问最多可以满足多少头牛的愿望. 思路: 裸二分图最大匹配. 代码: int n,m; vector< ...
- Mac 搭建后端PHP+Go环境
准备工作 1. 安装brew命令 #很慢很慢.. ruby -e "$(curl -fsSL https://raw.githubusercontent.com/Homebrew/insta ...
- Linux内核内存检测工具KASAN
KASAN 是 Kernel Address Sanitizer 的缩写,它是一个动态检测内存错误的工具,主要功能是检查内存越界访问和使用已释放的内存等问题.KASAN 集成在 Linux 内核中,随 ...
- macos proxy_bypass_macosx_sysconf exception
macos, 在rpc调用request请求时,在proxy_bypass_macosx_sysconf 无法返回 解决方法: import requests session = requests.S ...