利用Python爬取疫情数据并使用可视化工具展示
import requests, json
from pyecharts.charts import Map, Page, Pie, Bar
from pyecharts import options as opts
from pyecharts.globals import ThemeType def chinaTotal():
re = requests.get(
"https://view.inews.qq.com/g2/getOnsInfo?name=disease_h5&callback=jQuery341045890055561903065_1592206473904&_=1592206473905")
data = str(re.text)[42:-1]
data = json.loads(data)
data = json.loads(data["data"])
print(data["chinaTotal"])
data = data["chinaTotal"]
confirm = data["confirm"]
heal = data["heal"]
dead = data["dead"]
nowConfirm = data["nowConfirm"]
suspect = data["suspect"]
nowSevere = data["nowSevere"]
importedCase = data["importedCase"]
noInfect = data["noInfect"]
print(
"confirm:" + str(confirm) + "\n"
"heal:" + str(heal) + "\n"
"dead:" + str(dead) + "\n"
"nowConfirm:" + str(nowConfirm) + "\n"
"suspect:" + str(
suspect) + "\n"
"nowSevere:" + str(nowSevere) + "\n"
"importedCase:" + str(importedCase) + "\n"
"noInfect:" + str(
noInfect) + "\n\n"
) def areatotal():
global province_distribution
re = requests.get(
"https://view.inews.qq.com/g2/getOnsInfo?name=disease_h5&callback=jQuery341045890055561903065_1592206473904&_=1592206473905")
data = str(re.text)[42:-1]
data = json.loads(data)
data = data["data"]
data = json.loads(data)
data = data["areaTree"]
data = data[0]
data = data["children"]
print(data)
for i in data:
temp = []
areaname = str(i["name"])
nowConfirm = str(i["total"]["nowConfirm"])
confirm = str(i["total"]["confirm"])
suspect = str(i["total"]["suspect"])
dead = str(i["total"]["dead"])
deadRate = str(i["total"]["deadRate"])
heal = str(i["total"]["heal"])
healRate = str(i["total"]["healRate"])
temp.append(areaname)
temp.append(confirm)
kv.append(temp)
province_distribution[areaname] = province_distribution.get(areaname, confirm)
print(
"areaname:" + str(areaname) + "\n"
"nowConfirm:" + str(nowConfirm) + "\n"
"confirm:" + str(confirm) + "\n"
"suspect:" + str(
suspect) + "\n"
"dead:" + str(dead) + "\n"
"deadRate:" + str(deadRate) + "\n"
"heal:" + str(heal) + "\n"
"healRate:" + str(
healRate) + "\n\n" ) def initMap():
map = Map()
map.set_global_opts(
title_opts=opts.TitleOpts(title="中国疫情地图"),
visualmap_opts=opts.VisualMapOpts(max_=3600, is_piecewise=True,
pieces=[
{"max": 100000, "min": 10001, "label": ">10000", "color": "#680606"},
{"max": 10000, "min": 5001, "label": "5001-10000", "color": "#8A0808"},
{"max": 5000, "min": 1001, "label": "1001-5000", "color": "#B40404"},
{"max": 1000, "min": 600, "label": "600-1000", "color": "#DF0101"},
{"max": 599, "min": 100, "label": "100-599", "color": "#F78181"},
{"max": 99, "min": 1, "label": "1-99", "color": "#F5A9A9"},
{"max": 0, "min": 0, "label": "0", "color": "#FFFFFF"},
], ) # 最大数据范围,分段
)
pie = (
Pie() .add("", kv, center=["50%", "80%"], radius=[30, 100]) # 加入数据
.set_global_opts(title_opts=opts.TitleOpts(title="疫情统计饼图"),
legend_opts=opts.LegendOpts(pos_left=160)) # 全局设置项
.set_series_opts(label_opts=opts.LabelOpts(formatter="{b}: {c}"))) # 样式设置项
# V1 版本开始支持链式调用
# 你所看到的格式其实是 `black` 格式化以后的效果
# 可以执行 `pip install black` 下载使用
# Bar是柱状图/条形图 # 不习惯链式调用的开发者依旧可以单独调用方法
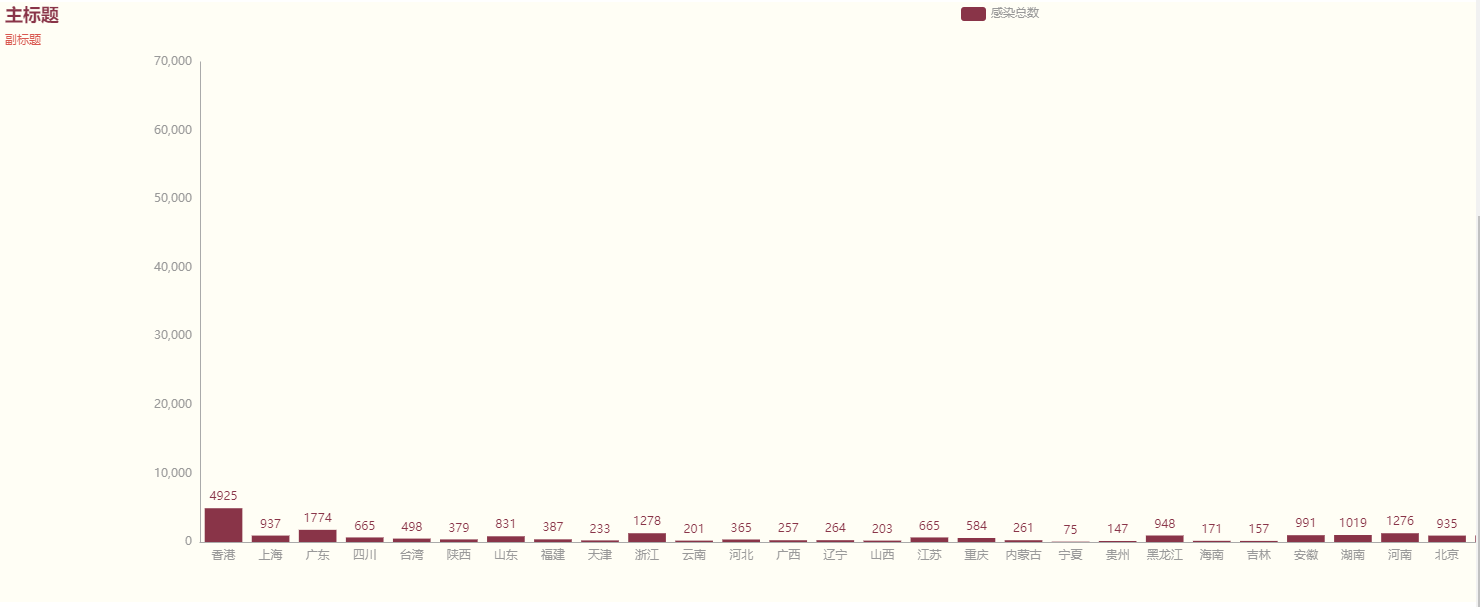
bar = Bar(init_opts=opts.InitOpts(bg_color='rgba(255,250,205,0.2)',
width='2000px',
height='600px',
page_title='page',
theme=ThemeType.ESSOS
))
bar.add_xaxis(xaxis_data=list(province_distribution.keys()))
bar.add_yaxis("感染总数", list(province_distribution.values()))
bar.set_global_opts(title_opts=opts.TitleOpts(title="主标题", subtitle="副标题"))
bar.set_series_opts(markpoint_opts=opts.MarkPointOpts(
data=[opts.MarkPointItem(type_='max', name='最大值'), opts.MarkPointItem(type_='min', name='最小值')]))
bar.render(r"testBar.html")
map.add("中国疫情地图", data_pair=province_distribution.items(), maptype="china", is_roam=True)
page.add(map)
page.add(pie)
page.add(bar) if __name__ == '__main__':
province_distribution = {}
kv = []
chinaTotal()
areatotal()
page = Page()
initMap()
print(province_distribution)
page.render('中国疫情地图.html')


利用Python爬取疫情数据并使用可视化工具展示的更多相关文章
- 如何使用Python爬取基金数据,并可视化显示
本文的文字及图片来源于网络,仅供学习.交流使用,不具有任何商业用途,版权归原作者所有,如有问题请及时联系我们以作处理 以下文章来源于Will的大食堂,作者打饭大叔 前言 美国疫情越来越严峻,大选也进入 ...
- python爬取旅游数据+matplotlib简单可视化
题目如下: 共由6个函数组成: 第一个函数爬取数据并转为DataFrame: 第二个函数爬取数据后存入Excel中,对于解题来说是多余的,仅当练手以及方便核对数据: 后面四个函数分别对应题目中的四个m ...
- python爬取疫情数据详解
首先逐步分析每行代码的意思: 这是要引入的东西: from os import path import requests from bs4 import BeautifulSoup import js ...
- python爬取疫情数据存入MySQL数据库
import requests from bs4 import BeautifulSoup import json import time from pymysql import * def mes( ...
- 毕设之Python爬取天气数据及可视化分析
写在前面的一些P话:(https://jq.qq.com/?_wv=1027&k=RFkfeU8j) 天气预报我们每天都会关注,我们可以根据未来的天气增减衣物.安排出行,每天的气温.风速风向. ...
- 利用python爬取58同城简历数据
利用python爬取58同城简历数据 利用python爬取58同城简历数据 最近接到一个工作,需要获取58同城上面的简历信息(http://gz.58.com/qzyewu/).最开始想到是用pyth ...
- 利用python爬取城市公交站点
利用python爬取城市公交站点 页面分析 https://guiyang.8684.cn/line1 爬虫 我们利用requests请求,利用BeautifulSoup来解析,获取我们的站点数据.得 ...
- 没有内涵段子可以刷了,利用Python爬取段友之家贴吧图片和小视频(含源码)
由于最新的视频整顿风波,内涵段子APP被迫关闭,广大段友无家可归,但是最近发现了一个"段友"的app,版本更新也挺快,正在号召广大段友回家,如下图,有兴趣的可以下载看看(ps:我不 ...
- 利用Python爬取朋友圈数据,爬到你开始怀疑人生
人生最难的事是自我认知,用Python爬取朋友圈数据,让我们重新审视自己,审视我们周围的圈子. 文:朱元禄(@数据分析-jacky) 哲学的两大问题:1.我是谁?2.我们从哪里来? 本文 jacky试 ...
随机推荐
- Jmeter 常用函数(13)- 详解 __machineIP
如果你想查看更多 Jmeter 常用函数可以在这篇文章找找哦 https://www.cnblogs.com/poloyy/p/13291704.html 作用 返回机器(电脑)IP 语法格式 ${_ ...
- hdu.2042 超级楼梯
这种递归来写,除了递归我也想不到怎么写了 AC代码: #include<iostream>using namespace std;int x[41];//打表,不打表我不用想就知道过不了, ...
- Java 8新特性(三):Optional类
在上一篇介绍Stream流式数据处理的文章中提到了Optional类,这是Java 8新增的一个类,用以解决程序中常见的NullPointerException异常问题.本篇文章将详细介绍Option ...
- 数据分析-RFM模型用户分析
RFM模型 根据美国数据库营销研究所Arthur Hughes的研究,客户数据库中有3个神奇的要素,这3个要素构成了数据分析最好的指标: 最近一次消费 (Recency) 消费频率 (Frequenc ...
- 关于对MyBatis.net框架的学习笔记( MyBatis.net是一款灵活性极大,sql由开发者自行在xml中编写, 轻量的ORM映射框架). 同时避免了sql硬编码到代码中不易维护的问题...
对于为什么要用ORM,为什么又要选择MyBatis.net,这个问题希望读者自行查找资料.这里直接贴出相关的调试笔记. 步骤1)下载与引用. http://code.google.com/p/myba ...
- 码云git clone报错Incorrect username or password ( access token )
使用码云将仓库clone到本地,报错信息如下: D:\>git clone https://gitee.com/ycyzharry/helloworld.git Cloning into 'he ...
- 【Flutter 实战】17篇动画系列文章带你走进自定义动画
老孟导读:Flutter 动画系列文章分为三部分:基础原理和核心概念.系统动画组件.8篇自定义动画案例,共17篇. 动画核心概念 在开发App的过程中,自定义动画必不可少,Flutter 中想要自定义 ...
- Docker 私有镜像仓库的搭建及认证
DockerHub 为我们提供了很多官方镜像和个人上传的镜像,我们可以下载机构或个人提供的镜像,也可以上传我们自己的本地镜像,但缺点是: 由于网络的原因,从 DockerHub 下载和上传镜像速度可能 ...
- Labview学习之路(十一)日常编程技巧
此文章用于记录自己在学习Labview过程中所用到的编程技巧,会一直更新下去. (一)移动控件 直接鼠标拖动. 按住shift键,鼠标移动,可以水平和竖直移动(取决于鼠标最开始的移动方向). 使用键盘 ...
- C# .NET容器的源码
这里有List<T>的源码http://referencesource.microsoft.com/#mscorlib/system/collections/generic/list.cs