vue教程6-图表
引入
- cnpm install echarts --save
- #在vue项目目录下安装echarts
静态折线图

linechart.js
- import echarts from 'echarts'
- export const option = {
- // backgroundColor: 'rgba(57,64,86,0.02)',
- // 标题
- title: {
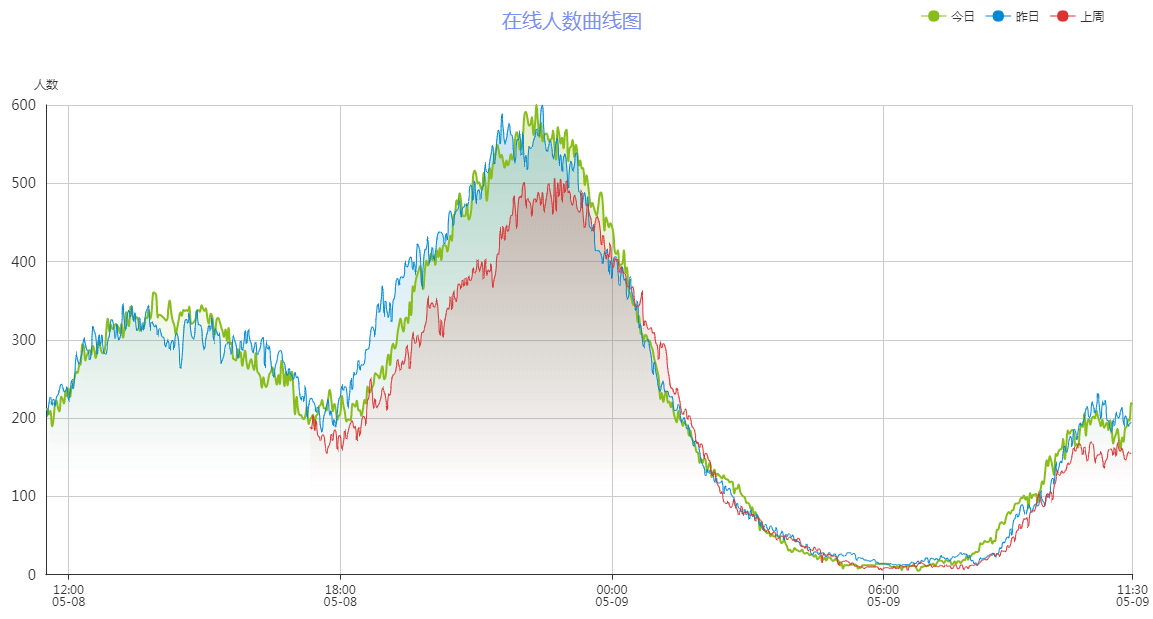
- text: '在线人数曲线图',
- x: 'center',
- textStyle: {
- fontWeight: 'normal',
- fontSize: 20,
- color: '#7a8ff3'
- }
- },
- // 鼠标悬浮提示框
- tooltip: {
- trigger: 'axis'
- },
- // 图示
- legend: {
- data: ['今日', '昨日', '上周'],
- right: '4%'
- },
- // 边框栅格
- grid: {
- top: 100,
- left: '2%',
- right: '2%',
- bottom: '2%',
- containLabel: true
- },
- // X轴
- xAxis: [{
- type: 'category',
- boundaryGap: false,
- data: ['13:00', '13:05', '13:10', '13:15', '13:20', '13:25', '13:30', '13:35', '13:40', '13:45', '13:50', '13:55']
- }],
- // Y轴
- yAxis: [{
- type: 'value',
- name: '人数',
- axisTick: {
- show: false
- },
- axisLabel: {
- margin: 10,
- textStyle: {
- fontSize: 14
- }
- }
- }],
- // 图示数据
- series: [{
- name: '今日',
- type: 'line',
- smooth: true,
- symbol: 'circle',
- symbolSize: 5,
- showSymbol: false,
- areaStyle: {
- normal: {
- color: new echarts.graphic.LinearGradient(0, 0, 0, 1, [{
- offset: 0,
- color: 'rgba(137, 189, 27, 0.3)'
- }, {
- offset: 0.8,
- color: 'rgba(137, 189, 27, 0)'
- }], false),
- shadowColor: 'rgba(0, 0, 0, 0.1)',
- shadowBlur: 10
- }
- },
- itemStyle: {
- normal: {
- color: 'rgb(137,189,27)',
- borderColor: 'rgba(137,189,2,0.27)',
- borderWidth: 12
- }
- },
- data: []
- }, {
- name: '昨日',
- type: 'line',
- smooth: true,
- symbol: 'circle',
- symbolSize: 5,
- showSymbol: false,
- lineStyle: {
- normal: {
- width: 1
- }
- },
- areaStyle: {
- normal: {
- color: new echarts.graphic.LinearGradient(0, 0, 0, 1, [{
- offset: 0,
- color: 'rgba(0, 136, 212, 0.3)'
- }, {
- offset: 0.8,
- color: 'rgba(0, 136, 212, 0)'
- }], false),
- shadowColor: 'rgba(0, 0, 0, 0.1)',
- shadowBlur: 10
- }
- },
- itemStyle: {
- normal: {
- color: 'rgb(0,136,212)',
- borderColor: 'rgba(0,136,212,0.2)',
- borderWidth: 12
- }
- },
- data: []
- }, {
- name: '上周',
- type: 'line',
- smooth: true,
- symbol: 'circle',
- symbolSize: 5,
- showSymbol: false,
- lineStyle: {
- normal: {
- width: 1
- }
- },
- areaStyle: {
- normal: {
- color: new echarts.graphic.LinearGradient(0, 0, 0, 1, [{
- offset: 0,
- color: 'rgba(219, 50, 51, 0.3)'
- }, {
- offset: 0.8,
- color: 'rgba(219, 50, 51, 0)'
- }], false),
- shadowColor: 'rgba(0, 0, 0, 0.1)',
- shadowBlur: 10
- }
- },
- itemStyle: {
- normal: {
- color: 'rgb(219,50,51)',
- borderColor: 'rgba(219,50,51,0.2)',
- borderWidth: 12
- }
- },
- data: []
- }]
- }
chart.vue
- <template>
- <div class="chart-container">
- <!--创建一个echarts的容器,给定高宽-->
- <div id="gamechart" style="width:100%; height:100%"/>
- </div>
- </template>
- <script>
- // 安装echarts后,直接引入
- import echarts from 'echarts'
- import { option } from './linechart'
- export default {
- data() {
- return {
- chart: {},
- option: option
- }
- },
- created() {
- this.fetchData()
- },
- // 挂载图表函数
- mounted() {
- this.initChart()
- },
- methods: {
- fetchData() {
- this.chart = {
- today: [220, 182, 191, 134, 150, 120, 110, 125, 145, 122, 165, 122],
- lastday: [120, 110, 125, 145, 122, 165, 122, 220, 182, 191, 134, 150],
- lastweek: [220, 182, 125, 145, 122, 191, 134, 150, 120, 110, 165, 122]
- }
- this.option.series[0].data = this.chart.today
- this.option.series[1].data = this.chart.lastday
- this.option.series[2].data = this.chart.lastweek
- },
- initChart() {
- // 将chart初始化的实例绑定到一个DOM
- this.chart = echarts.init(document.getElementById('gamechart'))
- this.chart.setOption(this.option)
- }
- }
- }
- </script>
- <style scoped>
- .chart-container{
- position: relative;
- width: 100%;
- height: calc(100vh - 84px);
- }
- </style>
从后台获取数据
- echarts的时间戳格式是13位,精确到毫秒
- 后台给出的时间戳是变化的,所以在图表上,会展示最新时间的数据
- [[[1557309121000,5901],[1557309241000,5962],[1557309361000,5992],[1557309480000,5983],[1557309600000,5949],[1557309720000,6047]]
- #这是后台给出的api数据
- #echarts可以从后台获取包含时间戳和数据的二维数组
- methods: {
- fetchData() {
- getGameChart(this.gameid).then(response => {
- this.option.series[0].data = response.today
- this.option.series[1].data = response.lastday
- this.option.series[2].data = response.lastweek
- this.chart.setOption(this.option)
- this.chart.hideLoading()
- }).catch(error => {
- this.$message.error('图表请求数据失败啦!')
- console.log(error)
- })
- },
- initChart() {
- // 将chart初始化的实例绑定到一个DOM
- this.chart = echarts.init(document.getElementById('gamechart'))
- this.chart.showLoading({
- text: '正在努力的读取数据中...'
- })
- }
- }
- #在vue中请求后台api,然后将返回的数据赋值给this.option.series的几个数组
vue教程6-图表的更多相关文章
- 网页图表Highcharts实践教程之图表代码构成
网页图表Highcharts实践教程之图表代码构成 Highcharts第一个实例 下面我们来实现本书的第一个Highcharts实例. [实例1-1]下面来制作北京连续一周最高温度折线图.操作过程如 ...
- vue教程3-05 vue组件数据传递、父子组件数据获取,slot,router路由
vue教程3-05 vue组件数据传递 一.vue默认情况下,子组件也没法访问父组件数据 <!DOCTYPE html> <html lang="en"> ...
- vue教程3-04 vue.js vue-devtools 调试工具的下载安装和使用
vue教程3-04 vue.js vue-devtools vue调试工具的安装和使用 一.vue-devtools 下载与安装 1.需要 fan qiang 2.打开谷歌浏览器设置--->扩展 ...
- vue教程3-03 vue组件,定义全局、局部组件,配合模板,动态组件
vue教程3-03 vue组件,定义全局.局部组件,配合模板,动态组件 一.定义一个组件 定义一个组件: 1. 全局组件 var Aaa=Vue.extend({ template:'<h3&g ...
- vue教程3-02 vue动画
vue教程3-02 vue动画 以下代码,已经用包管理器下载好vue,animate <!DOCTYPE html> <html lang="en"> &l ...
- vue教程3-01 路由、组件、bower包管理器使用
vue教程3-01 路由.组件.包管理器 以下操作前提是 已经安装好node.js npm bower-> (前端)包管理器 下载: npm install bower -g 验证: bower ...
- vue教程2-08 自定义键盘信息、监听数据变化vm.$watch
vue教程2-08 自定义键盘信息 @keydown.up @keydown.enter @keydown.a/b/c.... 自定义键盘信息: Vue.directive('on').keyCode ...
- vue教程2-07 自定义指令
vue教程2-07 自定义指令 自定义指令: 一.属性: Vue.directive(指令名称,function(参数){ this.el -> 原生DOM元素 }); <div v-re ...
- vue教程2-07 微博评论功能
vue教程2-07 微博评论功能 <!doctype html> <html> <head> <meta charset="utf-8"& ...
- vue教程2-06 过滤器
vue教程2-06 过滤器 过滤器: vue提供过滤器: capitalize uppercase currency.... <div id="box"> {{msg| ...
随机推荐
- SDUT OJ 2616 简单计算
简单计算 Time Limit: 1000ms Memory limit: 65536K 有疑问?点这里^_^ 题目描述 某天,XX 给YY 出了一道题,题目是: 给出n 个十进制的数,找出这n ...
- elementaryos必装软件
所使用版本:elementaryos-0.4-stable-amd64.20160909.iso vmtools jdk sougouinput IntellijIEAD
- struts2 自定义类型转化 第三弹
1.Struts2的类型转化,对于8种原生数据类型以及Date,String等常见类型,Struts2可以使用内建的类型转化器实现自动转化:但对于自定义的对象类型来说,就需要我们自己指定类型转化的的方 ...
- VC++动态链接库(DLL)编程深入浅出:Q&A(原创)
Q1:extern “C” 是做什么用的? A1:一种情况是多个文件中,变量声明或者函数声明,需要extern “C”,这种情况在这里不做讨论. 在dll工程中,被extern "C&quo ...
- POJ3417Network(LCA+树上查分||树剖+线段树)
Yixght is a manager of the company called SzqNetwork(SN). Now she's very worried because she has jus ...
- 1131 Subway Map(30 分)
In the big cities, the subway systems always look so complex to the visitors. To give you some sense ...
- 1107 Social Clusters (30)(30 分)
When register on a social network, you are always asked to specify your hobbies in order to find som ...
- ACM学习历程——NOJ1113 Game I(贪心 || 线段树)
Description 尼克发明了这样一个游戏:在一个坐标轴上,有一些圆,这些圆的圆心都在x轴上,现在给定一个x轴上的点,保证该点没有在这些圆内(以及圆上),尼克可以以这个点为圆心做任意大小的圆,他想 ...
- 3170: [Tjoi 2013]松鼠聚会
题目大意 给定n个点,找到一个点使这个点到其他所有点的切比雪夫距离之和最小. 题解 我们知道切比雪夫距离和曼哈顿距离的转化公式 \(1\)表示切比雪夫距离,\(2\)表示曼哈顿距离 我们有: \(x_ ...
- mongodb入门-关系型RDMS数据库对比及适用场景
引言 最近工作接触到了mongodb数据库,记录下个人对其的理解和使用情况.虽然mongodb 出来的时间已经不短,但是相对mysql mssql oracle 这样传统的关系型数据库来说还是比较年轻 ...