[D3] 9. Scatter Plot
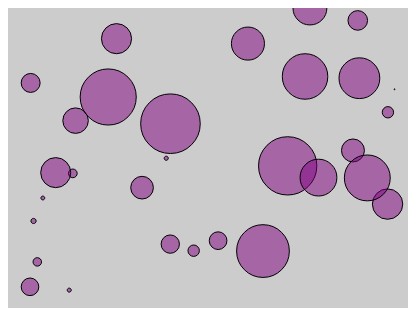
Up until now we've just looked at bar charts. A handy chart, no doubt, but D3 offers a variety of charts you can work with. In this lesson we'll convert the bar chart into a basic scatter (or bubble) chart.
<!DOCTYPE html>

<html>

<head lang="en">

    <meta charset="UTF-8">

    <title></title>

    <script src="../bower_components/underscore/underscore-min.js"></script>

    <script src="../ventor/d3.min.js"></script>

    <style type="text/css">

        body

        {

            padding-top: 50px;

            padding-left: 100px;

        }

        #chartArea {

            width: 400px;

            height: 300px;

            background-color: #CCC;

        }

        .bar

        {

            display: inline-block;

            width: 20px;

            height: 75px; /* Gets overriden by D3-assigned height below */

            margin-right: 2px;

           /* fill: teal; *//* SVG doesn't have background prop, use fill instead*/

            z-index:99;

        }

        .bubble {

            display: inline-block;

            fill: purple;

            fill-opacity: 0.5;

            stroke: black;

            stroke-weight: 1px;

        }

    </style>

</head>

<body>

<section id="chartArea"></section>

<script>

    var dataset = _.map(_.range(30), function(num) {

        return {

            x: Math.random() * 100,

            y: Math.random() * 100,

            r: Math.random() * 30

        }

    }), //reandom generate 15 data from 1 to 50

            margin = {top: 0, bottom: 0, left: 0, right: 0},

            w = 400 - margin.left - margin.right,

            h = 300 -margin.top - margin.bottom;

    var svg = d3.select('#chartArea').append('svg')

            .attr('width', w + margin.left + margin.right)

            .attr('height', h + margin.top + margin.bottom)

            .append('g') //The last step is to add a G element which is a graphics container in SBG.

            .attr('transform', 'translate(' + margin.left + ', ' + margin.top + ')'); //Then offset that graphic element by our left and top margins.

    var yScale = d3.scale.linear()

            .domain([0, d3.max(dataset, function(d) {

                return d.y; //tell the max function just need to care about y prop

            })])

            .range([h, 0]);

    var xScale = d3.scale.linear()

            .domain([0, 100])

            .range([0, w]);

    svg.selectAll('circle')

            .data(dataset)

            .enter()

            .append('circle')// svg doesn't have div, use rect instead

            .attr('class', "bubble")

            .attr('cx', function(each_data, index){

                return xScale(each_data.x);

            })

            .attr('cy', function(each_data){

                return yScale(each_data.y);

            })

            .attr('r', function(each_data, i){

                return each_data.r;

            });

</script>

</body>

</html>
[D3] 9. Scatter Plot的更多相关文章
- [D3] Build a Scatter Plot with D3 v4
Scatter plots, sometimes also known as bubble charts, are another common type of visualization. They ...
- Matplotlib学习---用matplotlib画散点图,气泡图(scatter plot, bubble chart)
Matplotlib里有两种画散点图的方法,一种是用ax.plot画,一种是用ax.scatter画. 一. 用ax.plot画 ax.plot(x,y,marker="o",co ...
- [Python] Scatter Plot for daily return
Sploe = 2: means that SPY move up 1, ABC move up 2 Correlation: how close those dots close to the li ...
- use matplotlib to draw scatter plot
There are many pionts in this kind of table. How to do it? We can use scatter() to draw it. Code: im ...
- D3 JS study notes
如何使用d3来解析自定义格式的数据源? var psv = d3.dsvFormat("|"); // This parser can parse pipe-delimited t ...
- d3基础图形模板笔记
散点图(scatter plot): http://bl.ocks.org/weiglemc/6185069 雷达图(radar): http://xgfe.github.io/uploads/che ...
- matplotlib多plot可视化
代码: # -*- coding: utf-8 -*- """ Created on Thu Jul 12 16:37:47 2018 @author: zhen &qu ...
- Python基础-画图:matplotlib.pyplot.scatter
转载自博客:https://blog.csdn.net/qiu931110/article/details/68130199 matplotlib.pyplot.scatter 1.scatter函数 ...
- Python中scatter函数参数用法详解
1.scatter函数原型 2.其中散点的形状参数marker如下: 3.其中颜色参数c如下: 4.基本的使用方法如下: #导入必要的模块 import numpy as np import matp ...
随机推荐
- ipad ------ 与iPhone的差别
1. 差异 iPhone是手机,iPad.iPad Mini是平板电脑 iPhone和iPad开发的区别 屏幕的尺寸 \分辨率 UI元素的排布 \设计 键盘 API 屏幕方向的支持 … … 2. iP ...
- C#中的委托事件的分析
推荐:http://www.cnblogs.com/SkySoot/archive/2012/04/05/2433639.html 委托和事件在 .NET Framework 中的应用非常广泛,然而, ...
- android app修改包名
change package nameA.使用到得工具 notepad++,everything搜索工具(C:\Users\Administrator\Desktop\MusicScanResu ...
- python 重载 __hash__ __eq__
__author__ = 'root' from urlparse import urlparse class host_news(): def __init__(self, id, url): se ...
- [原博客] POI系列(2)
正规.严谨.精妙. -POI bzoj 1098 : [POI2007]办公楼biu 如果把互相有手机号的建边得到一个无向图,那么这个图的补图的连通分量个数就是答案了.因为互相没手机号的必然在同一个连 ...
- Spring+SpringMVC+Mybatis 利用AOP自定义注解实现可配置日志快照记录
http://my.oschina.net/ydsakyclguozi/blog/413822
- POJ 2528 Mayor's posters(线段树)
点我看题目 题意 :建一堵墙粘贴海报,每个候选人只能贴一张海报,海报的高度与墙一样高,一张海报的宽度是整数个单位,墙被划分为若干个部分,每个部分的宽度为一个单位,每张海报完全的覆盖一段连续的墙体,墙体 ...
- Application对象的使用-数据传递以及内存泄漏
Application的使用 What is Application Application和Activity,Service一样是android框架的一个系统组件,当android程序启动时系统会创 ...
- BZOJ_1588_&_Codevs_1296_[HNOI2002]_营业额统计(平衡树/set)
描述 http://www.lydsy.com/JudgeOnline/problem.php?id=1588 给出每一天的营业值,求出之前的天当中与它相差最小的营业值与它的差的绝对值(第一天的差值为 ...
- 【转】为ListView每个Item上面的按钮添加事件
原文网址:http://blog.csdn.net/qq435757399/article/details/8256453 1.先看下效果图: 在这里仅供测试,我把数据都写死了,根据需要 ...