spring cloud深入学习(六)-----熔断监控Hystrix Dashboard和Turbine
Hystrix-dashboard是一款针对Hystrix进行实时监控的工具,通过Hystrix Dashboard我们可以在直观地看到各Hystrix Command的请求响应时间, 请求成功率等数据。但是只使用Hystrix Dashboard的话, 你只能看到单个应用内的服务信息, 这明显不够. 我们需要一个工具能让我们汇总系统内多个服务的数据并显示到Hystrix Dashboard上, 这个工具就是Turbine.
Hystrix Dashboard
除了隔离依赖服务的调用以外,Hystrix还提供了准实时的调用监控(Hystrix Dashboard),Hystrix会持续地记录所有通过Hystrix发起的请求的执行信息,并以统计报表和图形的形式展示给用户,包括每秒执行多少请求多少成功,多少失败等。Netflix通过hystrix-metrics-event-stream项目实现了对以上指标的监控。Spring Cloud也提供了Hystrix Dashboard的整合,对监控内容转化成可视化界面。
该demo基于本人之前的eureka-feign-consumer项目,eureka-feign-consumer地址:https://github.com/ali-mayun/eureka-feign-consumer
1、添加依赖
<?xml version="1.0" encoding="UTF-8"?>

<project xmlns="http://maven.apache.org/POM/4.0.0" xmlns:xsi="http://www.w3.org/2001/XMLSchema-instance"

         xsi:schemaLocation="http://maven.apache.org/POM/4.0.0 http://maven.apache.org/xsd/maven-4.0.0.xsd">

    <modelVersion>4.0.0</modelVersion>

    <parent>

        <groupId>org.springframework.boot</groupId>

        <artifactId>spring-boot-starter-parent</artifactId>

        <version>2.1.4.RELEASE</version>

        <relativePath/> <!-- lookup parent from repository -->

    </parent>

    <groupId>com.ty</groupId>

    <artifactId>eureka-feign-consumer</artifactId>

    <version>0.0.1-SNAPSHOT</version>

    <name>eureka-feign-consumer</name>

    <description>Demo project for Spring Boot</description>

    <properties>

        <java.version>1.8</java.version>

    </properties>

    <dependencies>

        <dependency>

            <groupId>org.springframework.boot</groupId>

            <artifactId>spring-boot-starter</artifactId>

        </dependency>

        <dependency>

            <groupId>org.springframework.boot</groupId>

            <artifactId>spring-boot-starter-test</artifactId>

            <scope>test</scope>

        </dependency>

        <dependency>

            <groupId>org.springframework.boot</groupId>

            <artifactId>spring-boot-starter-web</artifactId>

        </dependency>

        <dependency>

            <groupId>org.springframework.cloud</groupId>

            <artifactId>spring-cloud-starter-netflix-eureka-client</artifactId>

            <version>2.1.1.RELEASE</version>

        </dependency>

        <dependency>

            <groupId>org.springframework.cloud</groupId>

            <artifactId>spring-cloud-starter-openfeign</artifactId>

            <version>2.1.1.RELEASE</version>

        </dependency>

        <dependency>

            <groupId>org.springframework.cloud</groupId>

            <artifactId>spring-cloud-starter-netflix-hystrix</artifactId>

            <version>2.1.1.RELEASE</version>

        </dependency>

        <dependency>

            <groupId>org.springframework.cloud</groupId>

            <artifactId>spring-cloud-starter-netflix-hystrix-dashboard</artifactId>

            <version>2.1.1.RELEASE</version>

        </dependency>

        <dependency>

            <groupId>org.springframework.boot</groupId>

            <artifactId>spring-boot-starter-actuator</artifactId>

        </dependency>

    </dependencies>

    <dependencyManagement>

        <dependencies>

            <dependency>

                <groupId>org.springframework.cloud</groupId>

                <artifactId>spring-cloud-dependencies</artifactId>

                <version>Finchley.RELEASE</version>

                <type>pom</type>

            </dependency>

        </dependencies>

    </dependencyManagement>

    <build>

        <plugins>

            <plugin>

                <groupId>org.springframework.boot</groupId>

                <artifactId>spring-boot-maven-plugin</artifactId>

            </plugin>

        </plugins>

    </build>

</project>
这三个包必须添加:spring-cloud-starter-netflix-hystrix、spring-cloud-starter-netflix-hystrix-dashboard、spring-boot-starter-actuator
2、启动类
启动类添加启用Hystrix Dashboard
package com.ty.eurekafeignconsumer;

import com.netflix.hystrix.contrib.metrics.eventstream.HystrixMetricsStreamServlet;

import org.springframework.boot.SpringApplication;

import org.springframework.boot.autoconfigure.SpringBootApplication;

import org.springframework.boot.web.servlet.ServletRegistrationBean;

import org.springframework.cloud.netflix.eureka.EnableEurekaClient;

import org.springframework.cloud.netflix.hystrix.dashboard.EnableHystrixDashboard;

import org.springframework.cloud.openfeign.EnableFeignClients;

import org.springframework.context.annotation.Bean;

@SpringBootApplication

@EnableEurekaClient

//让程序拥有feign的功能

@EnableFeignClients

@EnableHystrixDashboard

public class EurekaFeignConsumerApplication {

    public static void main(String[] args) {

        SpringApplication.run(EurekaFeignConsumerApplication.class, args);

    }

    //这地方有个坑,因为我们spring boot是用的2.1.4,所以在打开hystrix dashboard的时候,地址会出错

    @Bean

    public ServletRegistrationBean getServlet() {

        HystrixMetricsStreamServlet streamServlet = new HystrixMetricsStreamServlet();

        ServletRegistrationBean registrationBean = new ServletRegistrationBean(streamServlet);

        registrationBean.setLoadOnStartup(1);

        registrationBean.addUrlMappings("/hystrix.stream");

        registrationBean.setName("HystrixMetricsStreamServlet");

        return registrationBean;

    }

}
3、测试
启动工程后访问 http://localhost:4001/hystrix,将会看到如下界面:
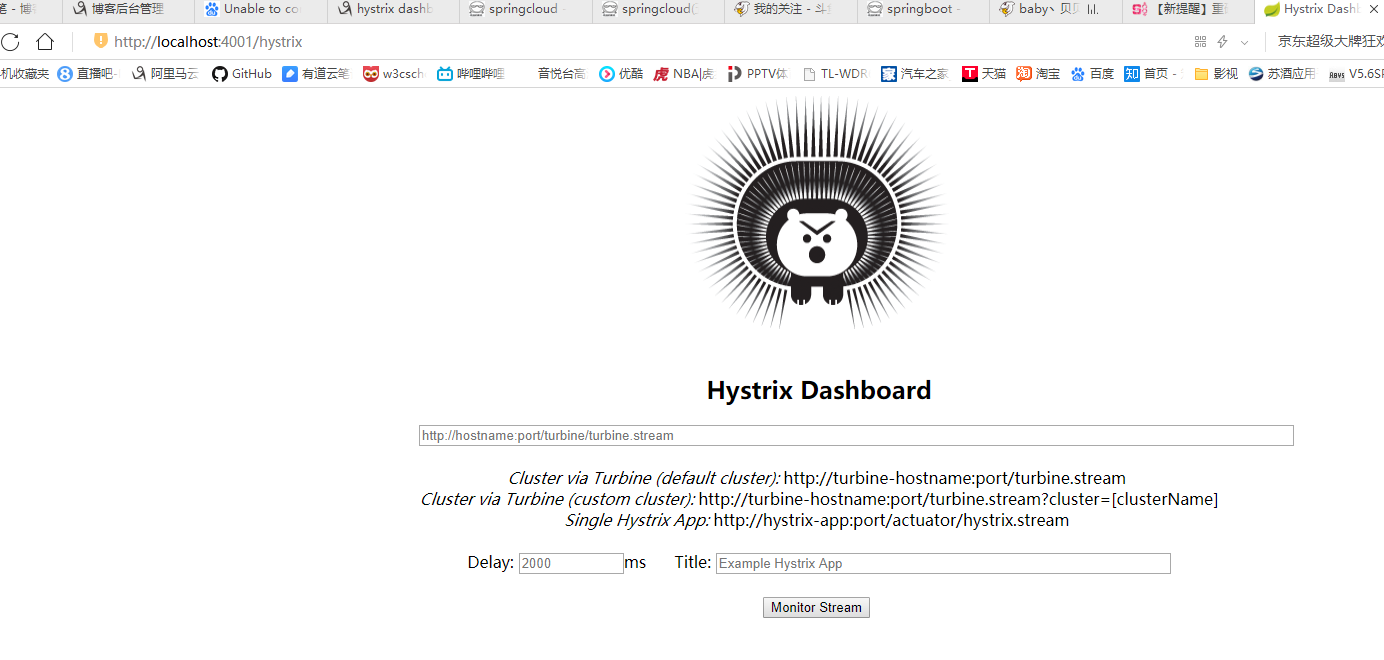
这小熊长得可以啊~~~
解释一波:
1:Delay:该参数用来控制服务器上轮询监控信息的延迟时间,默认为2000毫秒,可以通过配置该属性来降低客户端的网络和CPU消耗。
2:Title:该参数对应了头部标题Hystrix Stream之后的内容,默认会使用具体监控实例的URL,可以通过配置该信息来展示更合适的标题。
图中会有一些提示:
Cluster via Turbine (default cluster): http://turbine-hostname:port/turbine.stream
Cluster via Turbine (custom cluster): http://turbine-hostname:port/turbine.stream?cluster=[clusterName]
Single Hystrix App: http://hystrix-app:port/hystrix.stream
大概意思就是如果查看默认集群使用第一个url,查看指定集群使用第二个url,单个应用的监控使用最后一个,我们暂时只演示单个应用的所以在输入框中输入:
http://localhost:9001/hystrix.stream ,输入之后点击 monitor,进入页面。
如果没有请求会先显示Loading ...,访问http://localhost:4001/hystrix.stream 也会不断的显示ping。
请求服务http://localhost:4001/hi,就可以看到监控的效果了,首先访问http://localhost:4001/hystrix.stream,显示如下:
ping:

data: {"type":"HystrixCommand","name":"EurekaClientFeign#sayHiFromClientEureka(String)","group":"eureka-provider","currentTime":1559834223632,"isCircuitBreakerOpen":false,"errorPercentage":0,"errorCount":0,"requestCount":0,"rollingCountBadRequests":0,"rollingCountCollapsedRequests":0,"rollingCountEmit":0,"rollingCountExceptionsThrown":0,"rollingCountFailure":0,"rollingCountFallbackEmit":0,"rollingCountFallbackFailure":0,"rollingCountFallbackMissing":0,"rollingCountFallbackRejection":0,"rollingCountFallbackSuccess":0,"rollingCountResponsesFromCache":0,"rollingCountSemaphoreRejected":0,"rollingCountShortCircuited":0,"rollingCountSuccess":0,"rollingCountThreadPoolRejected":0,"rollingCountTimeout":0,"currentConcurrentExecutionCount":0,"rollingMaxConcurrentExecutionCount":0,"latencyExecute_mean":7,"latencyExecute":{"0":7,"25":7,"50":7,"75":7,"90":7,"95":7,"99":7,"99.5":7,"100":7},"latencyTotal_mean":8,"latencyTotal":{"0":8,"25":8,"50":8,"75":8,"90":8,"95":8,"99":8,"99.5":8,"100":8},"propertyValue_circuitBreakerRequestVolumeThreshold":20,"propertyValue_circuitBreakerSleepWindowInMilliseconds":5000,"propertyValue_circuitBreakerErrorThresholdPercentage":50,"propertyValue_circuitBreakerForceOpen":false,"propertyValue_circuitBreakerForceClosed":false,"propertyValue_circuitBreakerEnabled":true,"propertyValue_executionIsolationStrategy":"THREAD","propertyValue_executionIsolationThreadTimeoutInMilliseconds":1000,"propertyValue_executionTimeoutInMilliseconds":1000,"propertyValue_executionIsolationThreadInterruptOnTimeout":true,"propertyValue_executionIsolationThreadPoolKeyOverride":null,"propertyValue_executionIsolationSemaphoreMaxConcurrentRequests":10,"propertyValue_fallbackIsolationSemaphoreMaxConcurrentRequests":10,"propertyValue_metricsRollingStatisticalWindowInMilliseconds":10000,"propertyValue_requestCacheEnabled":true,"propertyValue_requestLogEnabled":true,"reportingHosts":1,"threadPool":"eureka-provider"}

data: {"type":"HystrixThreadPool","name":"eureka-provider","currentTime":1559834223632,"currentActiveCount":0,"currentCompletedTaskCount":2,"currentCorePoolSize":10,"currentLargestPoolSize":2,"currentMaximumPoolSize":10,"currentPoolSize":2,"currentQueueSize":0,"currentTaskCount":2,"rollingCountThreadsExecuted":0,"rollingMaxActiveThreads":0,"rollingCountCommandRejections":0,"propertyValue_queueSizeRejectionThreshold":5,"propertyValue_metricsRollingStatisticalWindowInMilliseconds":10000,"reportingHosts":1}
然后做如下操作:

注:如果用的是springboot2.x版本,就需要像上面一样注册一个ServletRegistrationBean
调用一把后,出现如下数据:
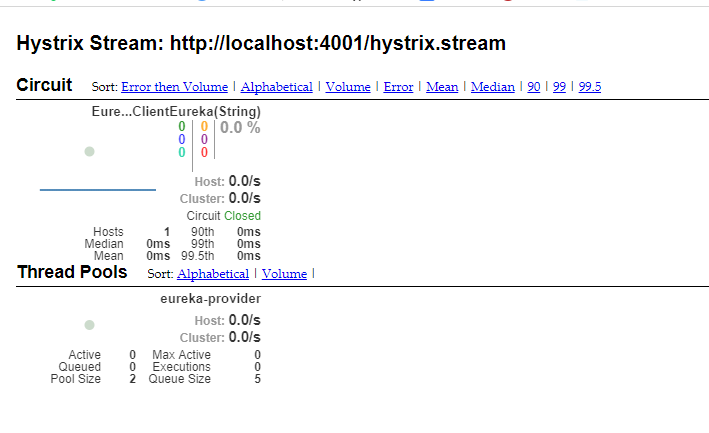
其实就是http://localhost:4001/hystrix.stream返回结果的图形化显示,Hystrix Dashboard Wiki上详细说明了图上每个指标的含义,如下图:

实心圆:共有两种含义。它通过颜色的变化代表了实例的健康程度,它的健康度从绿色<黄色<橙色<红色递减。该实心圆除了颜色的变化之外,它的大小也会根据实例的请求流量发生变化,流量越大该实心圆就越大。所以通过该实心圆的展示,就可以在大量的实例中快速的发现故障实例和高压力实例。
曲线:用来记录2分钟内流量的相对变化,可以通过它来观察到流量的上升和下降趋势。
到此单个应用的熔断监控已经完成。
Turbine
在复杂的分布式系统中,相同服务的节点经常需要部署上百甚至上千个,很多时候,运维人员希望能够把相同服务的节点状态以一个整体集群的形式展现出来,这样可以更好的把握整个系统的状态。 为此,Netflix提供了一个开源项目(Turbine)来提供把多个hystrix.stream的内容聚合为一个数据源供Dashboard展示。
1、添加依赖
<dependencies>

    <dependency>

        <groupId>org.springframework.cloud</groupId>

        <artifactId>spring-cloud-starter-netflix-turbine</artifactId>

        <version>2.1.1.RELEASE</version>

    </dependency>

    <dependency>

        <groupId>org.springframework.cloud</groupId>

        <artifactId>spring-cloud-netflix-turbine</artifactId>

        <version>2.1.1.RELEASE</version>

    </dependency>

    <dependency>

        <groupId>org.springframework.boot</groupId>

        <artifactId>spring-boot-starter-actuator</artifactId>

        <version>2.1.4.RELEASE</version>

    </dependency>

    <dependency>

        <groupId>org.springframework.cloud</groupId>

        <artifactId>spring-cloud-starter-netflix-hystrix-dashboard</artifactId>

        <version>2.1.1.RELEASE</version>

    </dependency>

</dependencies>
2、配置文件
spring.application.name=hystrix-dashboard-turbine

server.port=8001

turbine.appConfig=node01,node02

turbine.aggregator.clusterConfig= default

turbine.clusterNameExpression= new String("default")

eureka.client.serviceUrl.defaultZone=http://localhost:8000/eureka/
turbine.appConfig:配置Eureka中的serviceId列表,表明监控哪些服务turbine.aggregator.clusterConfig:指定聚合哪些集群,多个使用","分割,默认为default。可使用http://.../turbine.stream?cluster={clusterConfig之一}访问turbine.clusterNameExpression: 1. clusterNameExpression指定集群名称,默认表达式appName;此时:turbine.aggregator.clusterConfig需要配置想要监控的应用名称;2. 当clusterNameExpression: default时,turbine.aggregator.clusterConfig可以不写,因为默认就是default;3. 当clusterNameExpression: metadata['cluster']时,假设想要监控的应用配置了eureka.instance.metadata-map.cluster: ABC,则需要配置,同时turbine.aggregator.clusterConfig: ABC
3、启动类
启动类添加@EnableTurbine,激活对Turbine的支持
@SpringBootApplication

@EnableHystrixDashboard

@EnableTurbine

public class DashboardApplication {

    public static void main(String[] args) {

        SpringApplication.run(DashboardApplication.class, args);

    }

}
到此Turbine(hystrix-dashboard-turbine)配置完成
4、测试
在示例项目spring-cloud-consumer-hystrix基础上修改为两个服务的调用者spring-cloud-consumer-node1和spring-cloud-consumer-node2
spring-cloud-consumer-node1项目改动如下:
application.properties文件内容
spring.application.name=node01

server.port=9001

feign.hystrix.enabled=true

eureka.client.serviceUrl.defaultZone=http://localhost:8000/eureka/
spring-cloud-consumer-node2项目改动如下:
application.properties文件内容
spring.application.name=node02

server.port=9002

feign.hystrix.enabled=true

eureka.client.serviceUrl.defaultZone=http://localhost:8000/eureka/
HelloRemote类修改:
@FeignClient(name= "spring-cloud-producer2", fallback = HelloRemoteHystrix.class)

public interface HelloRemote {

    @RequestMapping(value = "/hello")

    public String hello2(@RequestParam(value = "name") String name);

}
对应的HelloRemoteHystrix和ConsumerController类跟随修改,具体查看代码
修改完毕后,依次启动spring-cloud-eureka、spring-cloud-consumer-node1、spring-cloud-consumer-node1、hystrix-dashboard-turbine(Turbine)
打开eureka后台可以看到注册了三个服务:

访问 http://localhost:8001/turbine.stream
返回:
: ping

data: {"reportingHostsLast10Seconds":1,"name":"meta","type":"meta","timestamp":1494921985839}
并且会不断刷新以获取实时的监控数据,说明和单个的监控类似,返回监控项目的信息。进行图形化监控查看,输入:http://localhost:8001/hystrix,返回酷酷的小熊界面,输入: http://localhost:8001/turbine.stream,然后点击 Monitor Stream ,可以看到出现了俩个监控列表。

spring cloud深入学习(六)-----熔断监控Hystrix Dashboard和Turbine的更多相关文章
- 跟我学SpringCloud | 第五篇:熔断监控Hystrix Dashboard和Turbine
SpringCloud系列教程 | 第五篇:熔断监控Hystrix Dashboard和Turbine Springboot: 2.1.6.RELEASE SpringCloud: Greenwich ...
- Spring Cloud(五)断路器监控(Hystrix Dashboard)
在上两篇文章中讲了,服务提供者 Eureka + 服务消费者 Feign,服务提供者 Eureka + 服务消费者(rest + Ribbon),本篇文章结合,上两篇文章中代码进行修改加入 断路器监控 ...
- spring cloud(五)熔断监控Hystrix Dashboard和Turbine
Hystrix-dashboard是一款针对Hystrix进行实时监控的工具,通过Hystrix Dashboard我们可以在直观地看到各Hystrix Command的请求响应时间, 请求成功率等数 ...
- Spring Cloud(五):熔断监控Hystrix Dashboard和Turbine
Hystrix-dashboard是一款针对Hystrix进行实时监控的工具,通过Hystrix Dashboard我们可以在直观地看到各Hystrix Command的请求响应时间, 请求成功率等数 ...
- spring cloud熔断监控Hystrix Dashboard和Turbine
参考: http://blog.csdn.net/ityouknow/article/details/72625646 完整pom <?xml version="1.0" e ...
- springcloud(五):熔断监控Hystrix Dashboard和Turbine
Hystrix-dashboard是一款针对Hystrix进行实时监控的工具,通过Hystrix Dashboard我们可以在直观地看到各Hystrix Command的请求响应时间, 请求成功率等数 ...
- 微服务SpringCloud之熔断监控Hystrix Dashboard和Turbine
Hystrix-dashboard是一款针对Hystrix进行实时监控的工具,通过Hystrix Dashboard我们可以在直观地看到各Hystrix Command的请求响应时间, 请求成功率等数 ...
- spring-cloud:熔断监控Hystrix Dashboard和Turbine的示例
1.运行环境 开发工具:intellij idea JDK版本:1.8 项目管理工具:Maven 4.0.0 2.GITHUB地址 https://github.com/nbfujx/springCl ...
- Spring Cloud 入门教程(八): 断路器指标数据监控Hystrix Dashboard 和 Turbine
1. Hystrix Dashboard (断路器:hystrix 仪表盘) Hystrix一个很重要的功能是,可以通过HystrixCommand收集相关数据指标. Hystrix Dashboa ...
随机推荐
- 高斯消元+期望dp——light1151
高斯消元弄了半天没弄对.. #include<bits/stdc++.h> using namespace std; #define maxn 205 #define eps 1e-8 d ...
- 莫烦pytorch学习笔记(二)——variable
.简介 torch.autograd.Variable是Autograd的核心类,它封装了Tensor,并整合了反向传播的相关实现 Variable和tensor的区别和联系 Variable是篮子, ...
- webpack 配置分离css插件
以css配置示例,less与sass同理 1. 使用旧版的ExtractTextPlugin插件 安装 npm install extract-text-webpack-plugin@next --s ...
- 02.vs插件 获取项目和解决方案路径
获取项目 解决方案路径 /// <summary> /// 获取并设置项目和解决方案绝对路径 /// </summary> /// <returns></re ...
- 基于SpringBoot+AntDesign的快速开发平台,JeecgBoot 2.0.2 版本发布
Jeecg-Boot 是一款基于SpringBoot+代码生成器的快速开发平台! 采用前后端分离架构:SpringBoot,Ant-Design-Vue,Mybatis,Shiro,JWT. 强大的代 ...
- 《DSP using MATLAB》Problem 8.28
代码: %% ------------------------------------------------------------------------ %% Output Info about ...
- Django之框架简介
了解即可: 1.MVC,全名是Model View Controller,是软件工程中的一种软件架构模式,把软件系统分为三个基本部分:模型(Model).视图(View)和控制器(Controller ...
- selenium简单应用
文章引用自:https://wenku.baidu.com/view/d5c296c75727a5e9846a6182.html 例子:
- sql草稿
参考:MySQL 内连接.外连接.左连接.右连接.全连接 SELECT count(*) FROM `t_product_base` select m_name from t_medicinal_in ...
- 02.Hibernate配置文件之映射配置文件
映射文件,即xxx.hbm.xml的配置文件 <class>标签:用来将类与数据库表建立映射关系 属性: name:类中的全路径 table:表名(如果类与表名一致,那么table属性可以 ...