matplotlib 操作子图(subplot,axes)
Matplotlib 中文用户指南 3.3 使用 GridSpec 自定义子图位置
- ax:matplotlib.axes._subplots.AxesSubplot,的基本操作
ax.set_xticks([]), ax_set_yticks([]):关闭坐标刻度ax.axis('off'):关闭坐标轴ax.set_title():设置标题
1. subplots
fig, ax = plt.subplots(nrows=1, ncols=2, figsize=(8, 4))

ax[0].plot(...)

ax[0].set_xlabel(...)

ax[0].set_title(...)

ax[1].plot(...)

ax[1].set_xlabel(...)

...
fig, (ax1, ax2, ax3) = plt.subplots(3, 1, sharex=True)更一般的做法(也是matlab的风格)是这样的:
fig = plt.figure()          # 创建一个figure对象,底下的一切显示均在此figure上完成

plt.subplot(121)

plt.imshow(img1)

plt.subplot(122)

plt.imshow(img2)

plt.show()

# 当然放在一个range里边

for i in range(ndim):

    plt.subplot(ndim//5, 5, i+1)

    plt.hist()
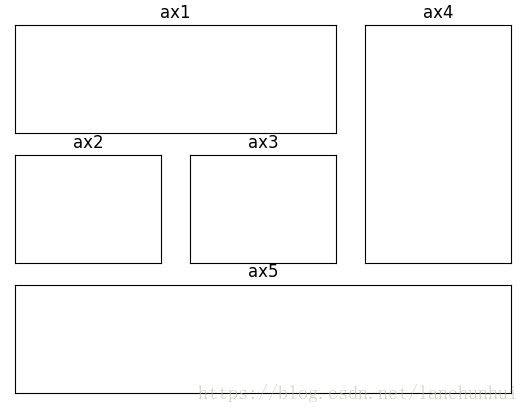
2. subplot2grid
subplot2grid
# 以下两条语句等价

ax = plt.subplot2grid((2,2),(0, 0))

ax = plt.subplot(221) # 下标从 0 开始- colspan、rowspan 与 索引的对应关系
import matplotlib.pyplot as plt

def disable_axis(ax):

    ax.set_xticks([])

    ax.set_yticks([])

    # ax.axis('off')

def set_title(ax, title):

    ax.set_title(title)

def subplot2grid_demo():

    ax1 = plt.subplot2grid((3, 3), (0, 0), colspan=2)

    disable_axis(ax1)

    set_title(ax1, 'ax1')

    ax2 = plt.subplot2grid((3, 3), (1, 0))

    disable_axis(ax2)

    set_title(ax2, 'ax2')

    ax3 = plt.subplot2grid((3, 3), (1, 1))

    disable_axis(ax3)

    set_title(ax3, 'ax3')

    ax4 = plt.subplot2grid((3, 3), (0, 2), rowspan=2)

    disable_axis(ax4)

    set_title(ax4, 'ax4')

    ax5 = plt.subplot2grid((3, 3), (2, 0), colspan=3)

    disable_axis(ax5)

    set_title(ax5, 'ax5')

    # plt.xticks([])

    # plt.yticks([])

    # plt.axis('off')

    plt.show()

if __name__ == '__main__':

    subplot2grid_demo()
3. GridSpec:方便的切片操作
GridSpec 提供了十分方便的切片操作,实现上述功能,则只需如下代码:
def gridspec_demo():

    gs = gridspec.GridSpec(3, 3)

    ax1 = plt.subplot(gs[0, :2])

    ax2 = plt.subplot(gs[1, 0])

    ax3 = plt.subplot(gs[1, 1])

    ax4 = plt.subplot(gs[0:2, 2])

    ax5 = plt.subplot(gs[2:, :])

    plt.show()
matplotlib 操作子图(subplot,axes)的更多相关文章
- (转)Matplotlib的子图subplot的使用
转:https://www.jianshu.com/p/de223a79217a 前言 Matplotlib的可以把很多张图画到一个显示界面,这就设计到面板切分成一个一个子图.这是怎么做到的呢.mat ...
- Matlab绘制子图subplot使用攻略
参考:https://jingyan.baidu.com/article/915fc414ad794b51394b20e1.html Matlab绘制子图subplot使用攻略 听语音 原创 | 浏览 ...
- matplotlib 的 subplot, axes and axis
fig = plt.figure('多图', (10, 10), dpi=80) #第一个指定窗口名称,第二个指定图片大小,创建一个figure对象 plt.subplot(222) #2*2的第二个 ...
- matplotlib ----- 多子图, subplots
这一篇讲的比较详细. http://matplotlib.org/examples/pylab_examples/subplots_demo.html 官方文档给出的subplots用法, http: ...
- matplotlib添加子图(拼图功能)
我们已经知道,matplotlib是python中的一个十分好用的作图库,它的简单的使用方法可以在之前的随笔中找到.传送门:https://www.cnblogs.com/chester-cs/p/1 ...
- matplotlib画子图时设置总标题
matplotlib subplots绘图时 设置总标题 :fig.suptitle(name)
- matplotlib调整子图大小
因为子图太多而导致每个子图很小,很密,如何调整
- matplotlib绘制子图
fig,subs = plt.subplots(2,2) subs[0][0].plot(data_math_C1) subs[0][0].set_title('C_1 曲线') subs[0][1] ...
- python使用matplotlib:subplot绘制多个子图
1 问题描述 matploglib 能够绘制出精美的图表, 有些时候, 我们希望把一组图放在一起进行比较, 有没有什么好的方法呢? matplotlib 中提供的 subplot 可以很好的解决这个问 ...
随机推荐
- Windows上玩转TensorFlow(一)
Windows上TensorFlow的安装和环境搭建: 1.安装Python 3.5.2 2.通过Pip3安装TensorFlow CPU版 https://www.tensorflow.org/in ...
- python 获取指定文件夹的大小
def getdirsize(dirpath): size = for root, dirs, files in os.walk(dirpath): size += sum([getsize(join ...
- 常见dos命令汇总
常用的内部命令有md.cd.rd.dir.path.copy.type.edit.ren.del.cls.ver.date.time.prompt.常用的外部命令有deltree.format.dis ...
- STL_算法_03_拷贝和替换算法
◆ 常用的拷贝和替换算法: 1.1.复制(容器A(全部/部分) 复制到 容器B(全部/部分)),返回的值==>iteratorOutBegin.end() iterator copy(itera ...
- 正则表达式中 (?=pattern) (?!pattern) (?<=pattern) (?<!pattern) 的使用
2018-08-06 12:33:58 StackOverFlow上有个如下的问题: 这里就会用到正向肯定预查(?=pattern):
- centos7: iptables保存(配置完nginx的web规则后)
centos7: iptables保存(配置完nginx的web规则后) 以本地虚拟机为例: 添加规则:入站规则 iptables -I INPUT -p tcp --dport 80 -j ACCE ...
- English trip M1 - PC12 I'd Like a Room Please Teacher:Taalan
In this lesson you will learn to say what you need. 在本课中,您将学习如何说出您的需求. Words list elevator 电梯 ...
- LeetCode--083--删除排序链表中的重复元素
问题描述: 给定一个排序链表,删除所有重复的元素,使得每个元素只出现一次. 示例 1: 输入: 1->1->2 输出: 1->2 示例 2: 输入: 1->1->2-&g ...
- Report CodeForces - 631C (栈)
题目链接 题目大意:给定序列, 给定若干操作, 每次操作将$[1,r]$元素升序或降序排列, 求操作完序列 首先可以发现对最后结果有影响的序列$r$一定非增, 并且是升序降序交替的 可以用单调栈维护这 ...
- OC MRC之循环引用问题(代码分析)
// // main.m // 07-循环引用 // // Created by apple on 13-8-9. // Copyright (c) 2013年 itcast. All rights ...